

Identification of immune-related molecular clusters and diagnostic markers in chronic kidney disease based on cluster analysis
- PMID: 36814902
- PMCID: PMC9939663
- DOI: 10.3389/fgene.2023.1111976
Identification of immune-related molecular clusters and diagnostic markers in chronic kidney disease based on cluster analysis
Abstract
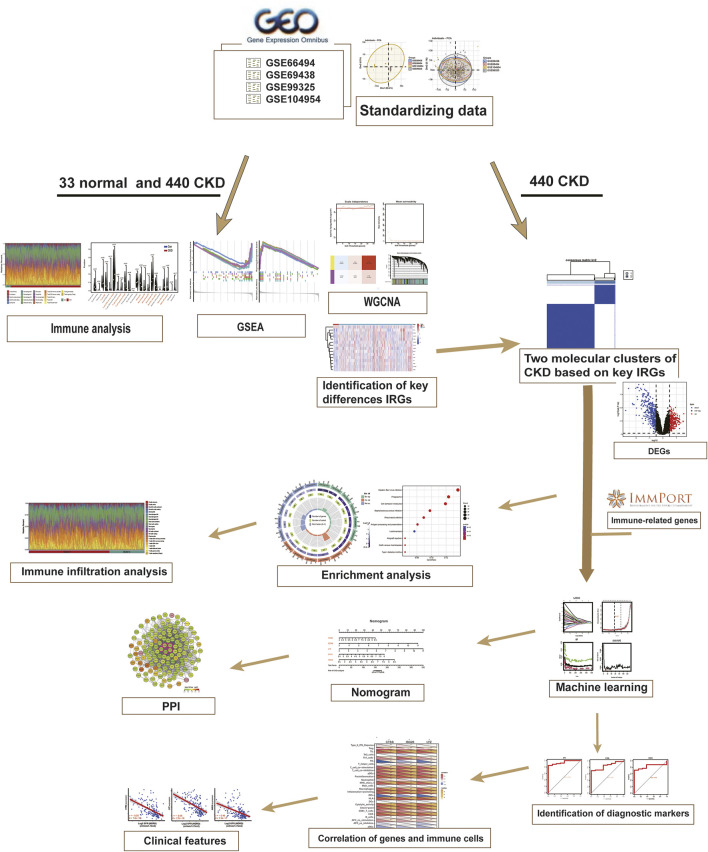
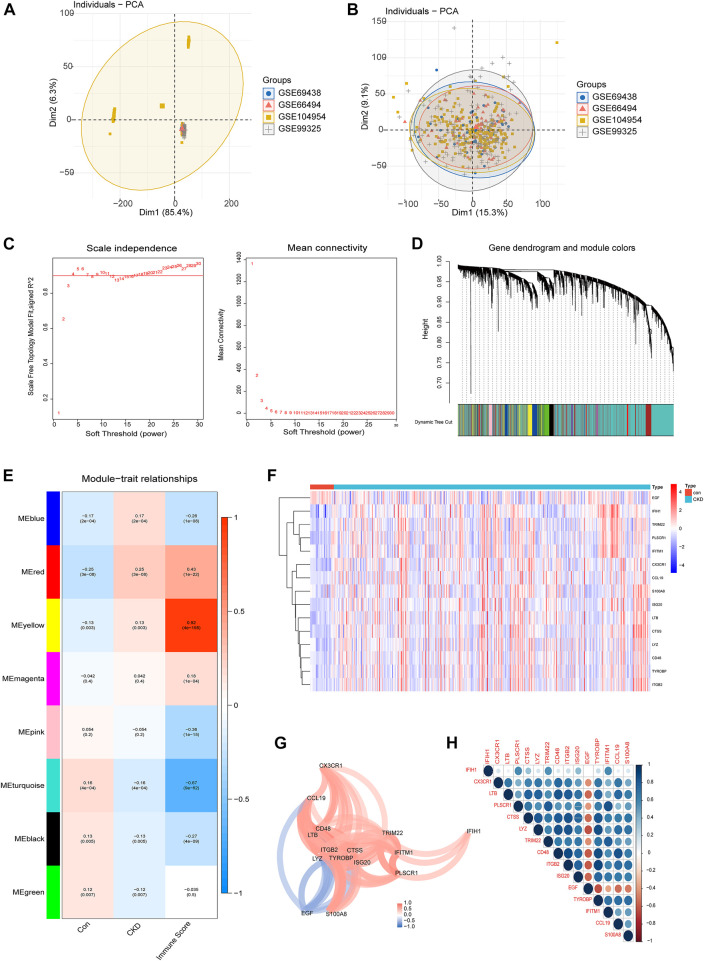
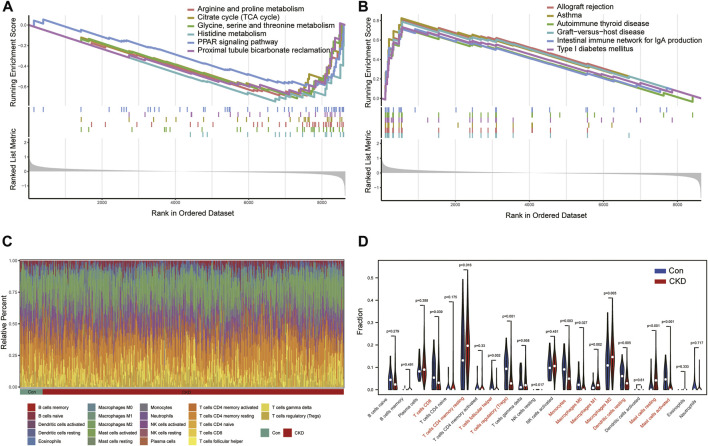
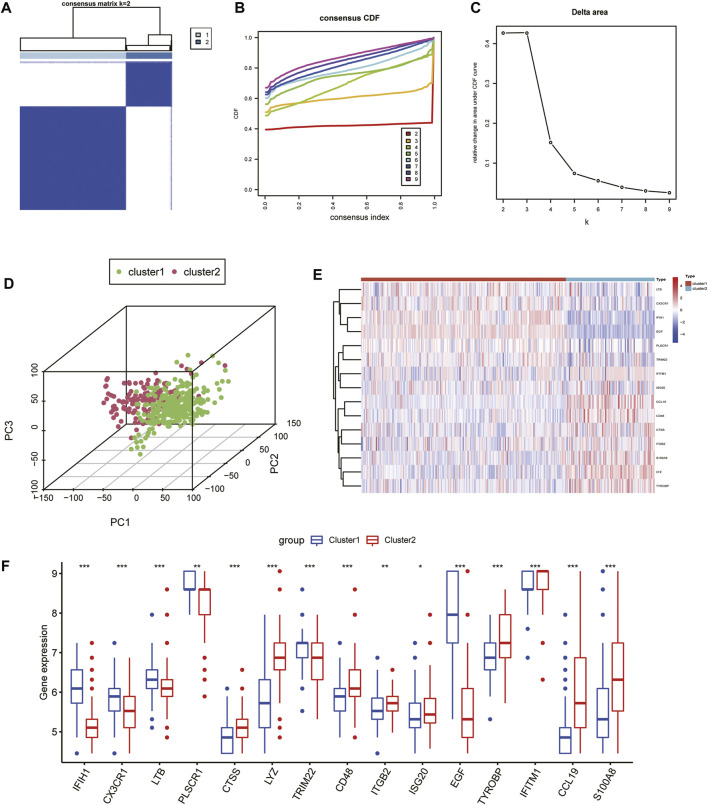
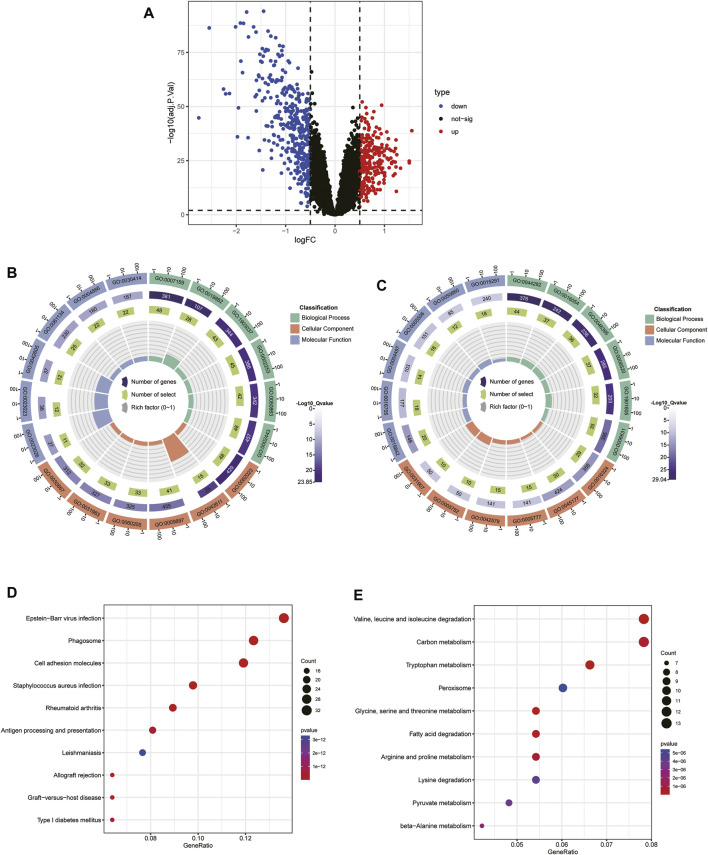
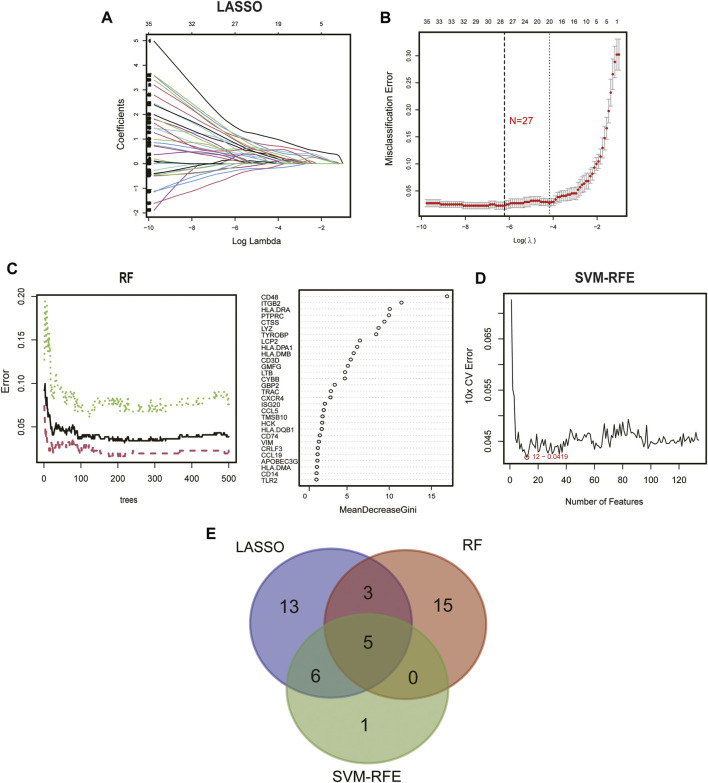
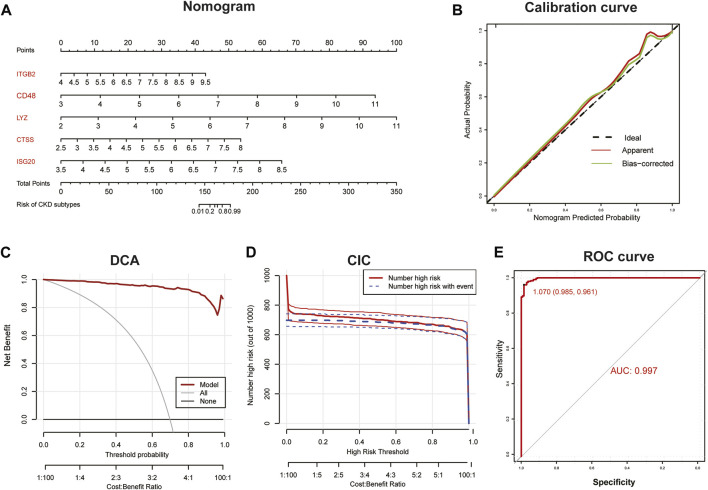
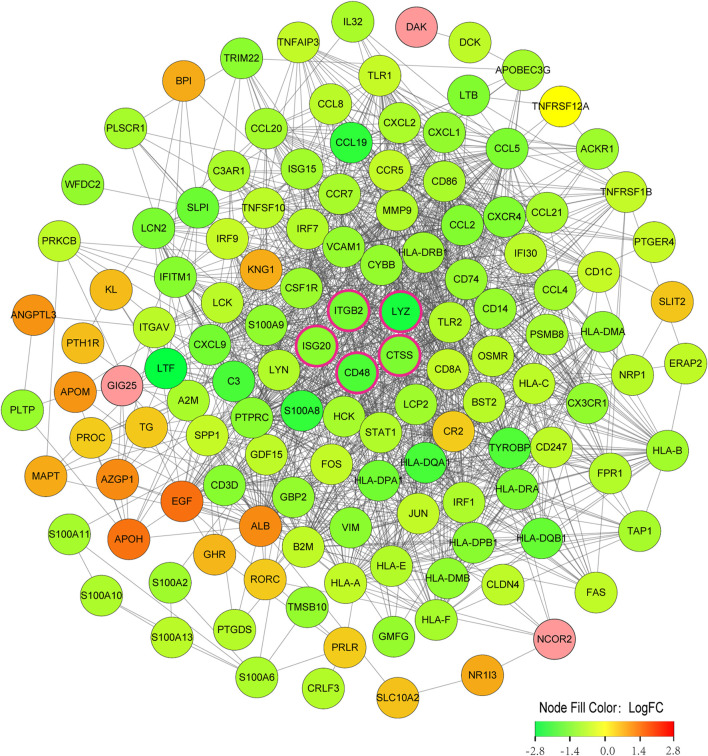
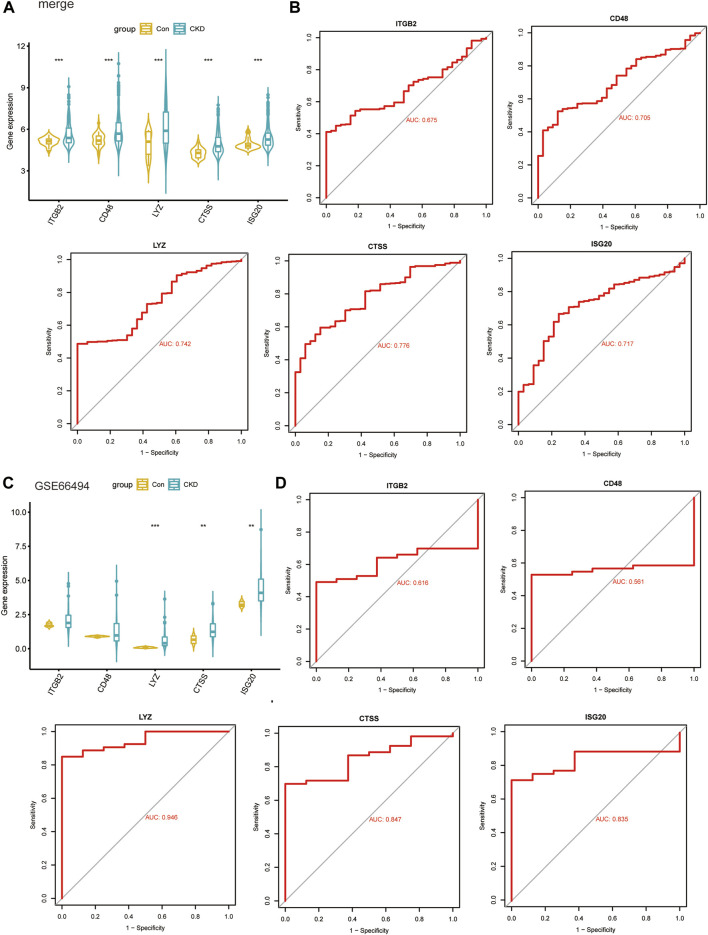
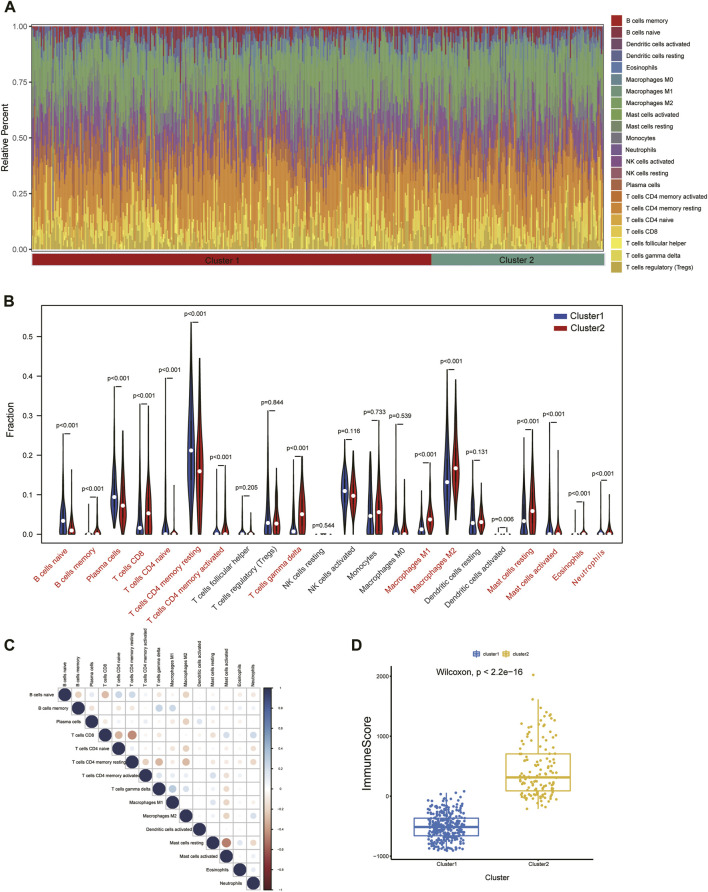
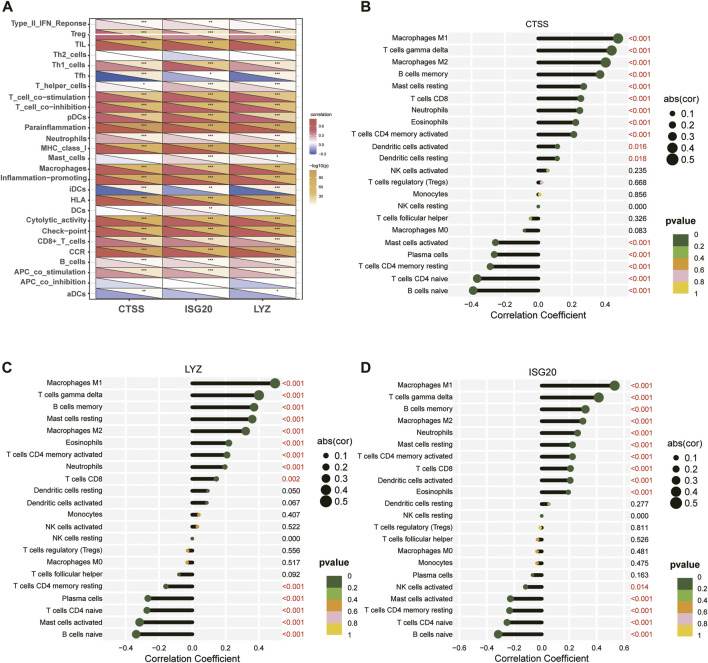
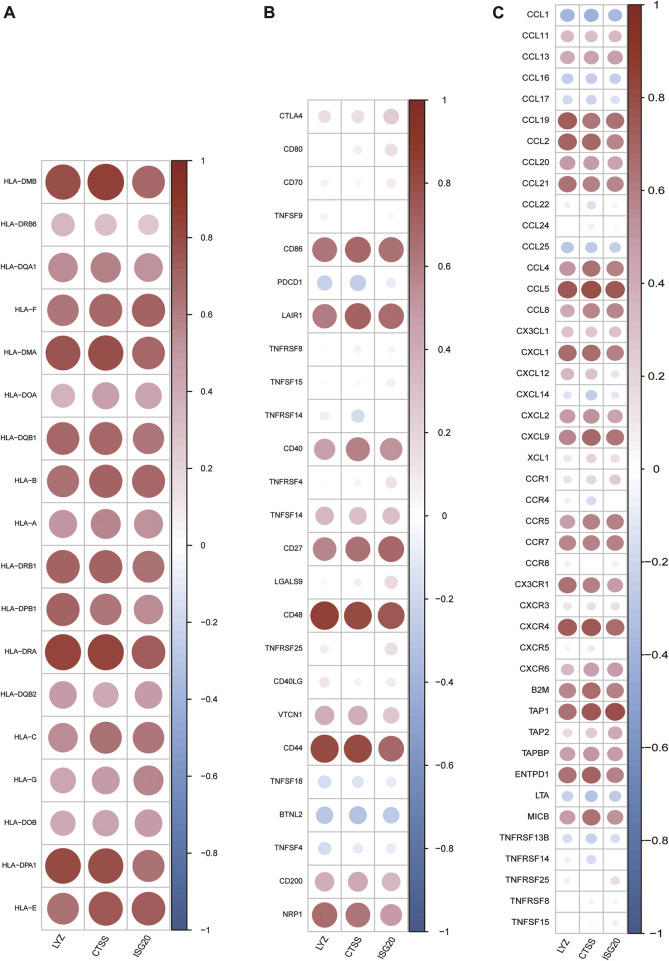
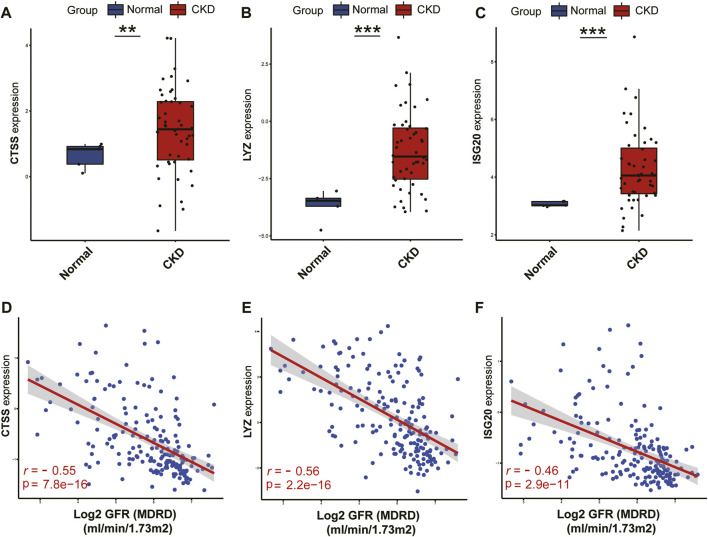
Background: Chronic kidney disease (CKD) is a heterogeneous disease with multiple etiologies, risk factors, clinical manifestations, and prognosis. The aim of this study was to identify different immune-related molecular clusters in CKD, their functional immunological properties, and to screen for promising diagnostic markers. Methods: Datasets of 440 CKD patients were obtained from the comprehensive gene expression database. The core immune-related genes (IRGs) were identified by weighted gene co-expression network analysis. We used unsupervised clustering to divide CKD samples into two immune-related subclusters. Then, functional enrichment analysis was performed for differentially expressed genes (DEGs) between clusters. Three machine learning methods (LASSO, RF, and SVM-RFE) and Venn diagrams were applied to filter out 5 significant IRGs with distinguished subtypes. A nomogram diagnostic model was developed, and the prediction effect was verified using calibration curve, decision curve analysis. CIBERSORT was applied to assess the variation in immune cell infiltration among clusters. The expression levels, immune characteristics and immune cell correlation of core diagnostic markers were investigated. Finally, the Nephroseq V5 was used to assess the correlation among core diagnostic markers and renal function. Results: The 15 core IRGs screened were differentially expressed in normal and CKD samples. CKD was classified into two immune-related molecular clusters. Cluster 2 is significantly enriched in biological functions such as leukocyte adhesion and regulation as well as immune activation, and has a severe immune prognosis compared to cluster 1. A nomogram diagnostic model with reliable prediction of immune-related clusters was developed based on five signature genes. The core diagnostic markers LYZ, CTSS, and ISG20 were identified as playing an important role in the immune microenvironment and were shown to correlate meaningfully with immune cell infiltration and renal function. Conclusion: Our study identifies two subtypes of CKD with distinct immune gene expression patterns and provides promising predictive models. Along with the exploration of the role of three promising diagnostic markers in the immune microenvironment of CKD, it is anticipated to provide novel breakthroughs in potential targets for disease treatment.
Keywords: IRGs; biomarker; chronic kidney disease; immune; machine learning; molecular clusters.
Copyright © 2023 Yan, Ke, Song and Fang.
Conflict of interest statement
The authors declare that the research was conducted in the absence of any commercial or financial relationships that could be construed as a potential conflict of interest.
Figures
Similar articles
-
Bioinformatics analysis of the expression of potential common genes and immune-related genes between atrial fibrillation and chronic kidney disease.Front Cardiovasc Med. 2025 Feb 26;12:1521722. doi: 10.3389/fcvm.2025.1521722. eCollection 2025. Front Cardiovasc Med. 2025. PMID: 40078458 Free PMC article.
-
Screening of immune-related secretory proteins linking chronic kidney disease with calcific aortic valve disease based on comprehensive bioinformatics analysis and machine learning.J Transl Med. 2023 Jun 1;21(1):359. doi: 10.1186/s12967-023-04171-x. J Transl Med. 2023. PMID: 37264340 Free PMC article.
-
Identification of the key immune-related genes and immune cell infiltration changes in renal interstitial fibrosis.Front Endocrinol (Lausanne). 2023 Nov 8;14:1207444. doi: 10.3389/fendo.2023.1207444. eCollection 2023. Front Endocrinol (Lausanne). 2023. PMID: 38027143 Free PMC article.
-
Comprehensive analysis of immune-related gene signature based on ssGSEA algorithms in the prognosis and immune landscape of hepatocellular carcinoma.Front Genet. 2022 Dec 9;13:1064432. doi: 10.3389/fgene.2022.1064432. eCollection 2022. Front Genet. 2022. PMID: 36568383 Free PMC article.
-
Immune Microenvironment Alterations and Identification of Key Diagnostic Biomarkers in Chronic Kidney Disease Using Integrated Bioinformatics and Machine Learning.Pharmgenomics Pers Med. 2024 Nov 19;17:497-510. doi: 10.2147/PGPM.S488143. eCollection 2024. Pharmgenomics Pers Med. 2024. PMID: 39588536 Free PMC article.
Cited by
-
Identification and preliminary validation of biomarkers associated with mitochondrial and programmed cell death in pre-eclampsia.Front Immunol. 2025 Jan 23;15:1453633. doi: 10.3389/fimmu.2024.1453633. eCollection 2024. Front Immunol. 2025. PMID: 39916955 Free PMC article.
-
Integrating bioinformatics and machine learning to discover sumoylation associated signatures in sepsis.Sci Rep. 2025 Apr 24;15(1):14398. doi: 10.1038/s41598-025-96956-x. Sci Rep. 2025. PMID: 40274894 Free PMC article.
-
Identification and Analysis of Key Immune- and Inflammation-Related Genes in Idiopathic Pulmonary Fibrosis.J Inflamm Res. 2025 Feb 11;18:1993-2009. doi: 10.2147/JIR.S489210. eCollection 2025. J Inflamm Res. 2025. PMID: 39959639 Free PMC article.
-
Establish a novel tumor budding-related signature to predict prognosis and guide clinical therapy in colorectal cancer.Sci Rep. 2024 Jan 25;14(1):2180. doi: 10.1038/s41598-024-52596-1. Sci Rep. 2024. PMID: 38273073 Free PMC article.
-
Construction of Clinical Predictive Models for Heart Failure Detection Using Six Different Machine Learning Algorithms: Identification of Key Clinical Prognostic Features.Int J Gen Med. 2024 Dec 28;17:6523-6534. doi: 10.2147/IJGM.S493789. eCollection 2024. Int J Gen Med. 2024. PMID: 39749257 Free PMC article.
References
LinkOut - more resources
Full Text Sources
Miscellaneous