. 2023 Apr;10(12):e2204794.
doi: 10.1002/advs.202204794. Epub 2023 Feb 23.

H3K4 Methylation Promotes Expression of Mitochondrial Dynamics Regulators to Ensure Oocyte Quality in Mice

Affiliations

H3K4 Methylation Promotes Expression of Mitochondrial Dynamics Regulators to Ensure Oocyte Quality in Mice

Ning-Hua Mei et al. Adv Sci (Weinh). 2023 Apr.

Abstract

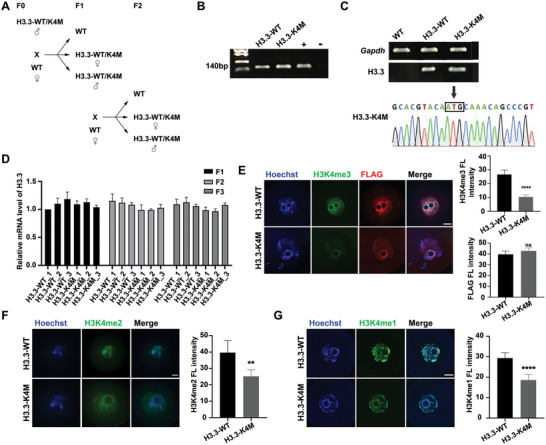
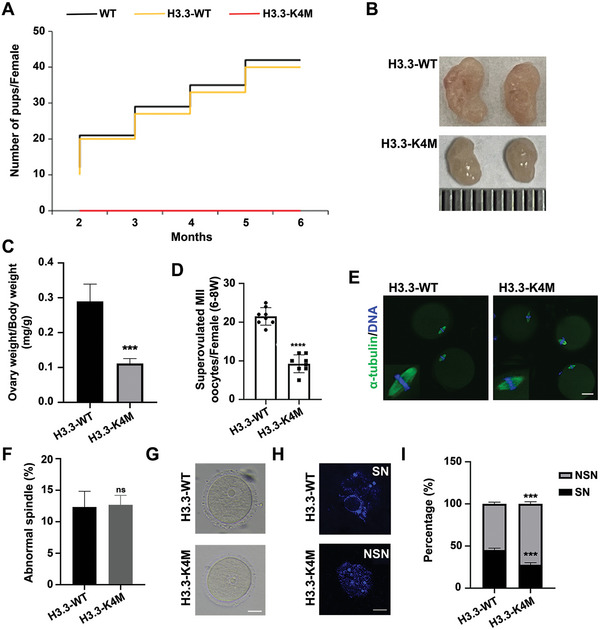
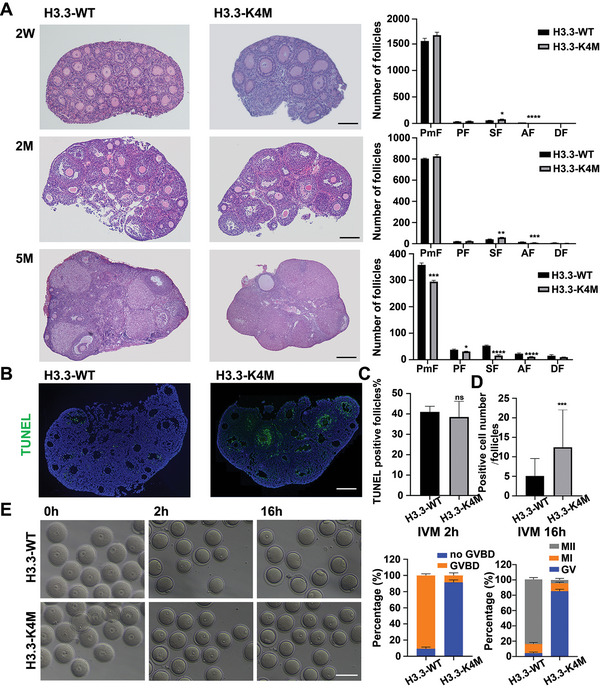
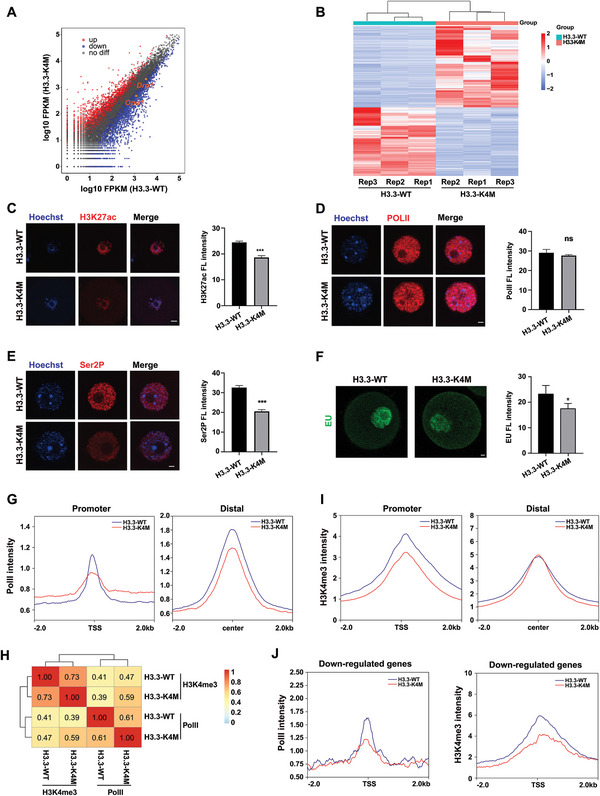
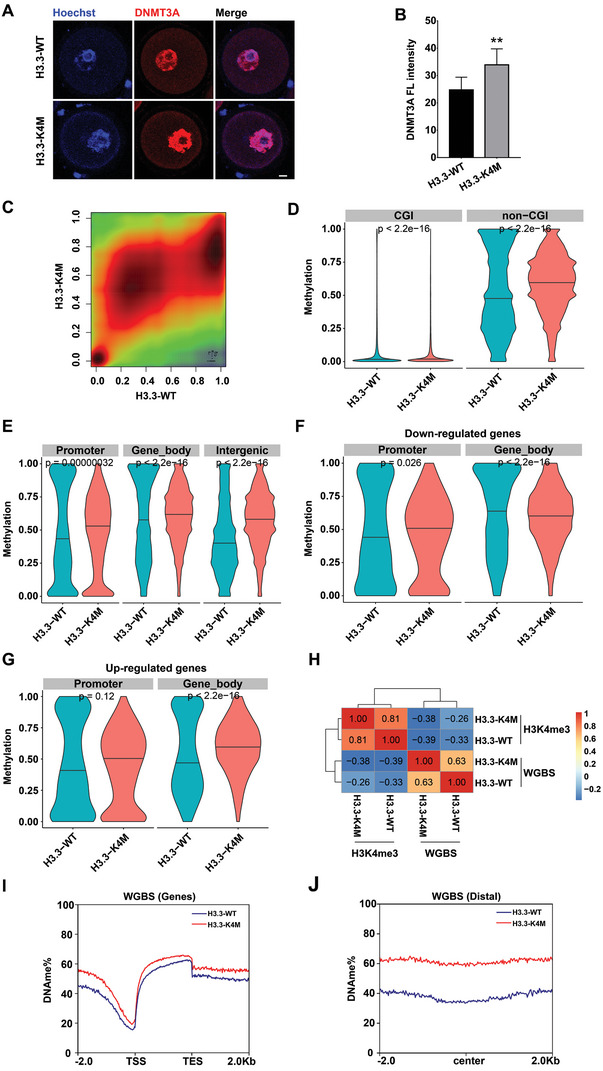
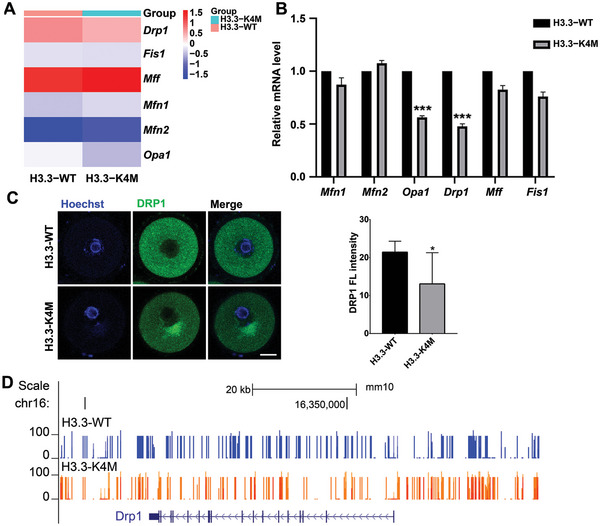
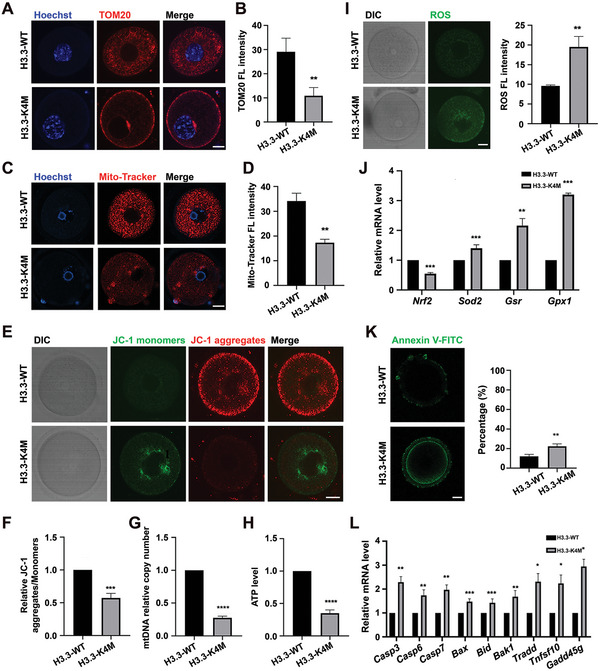
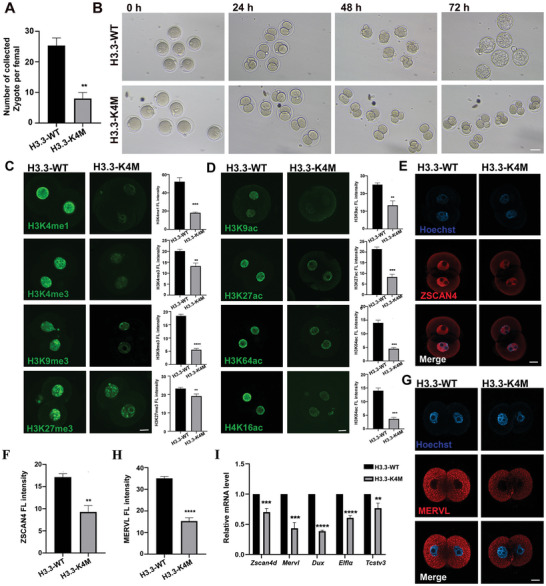
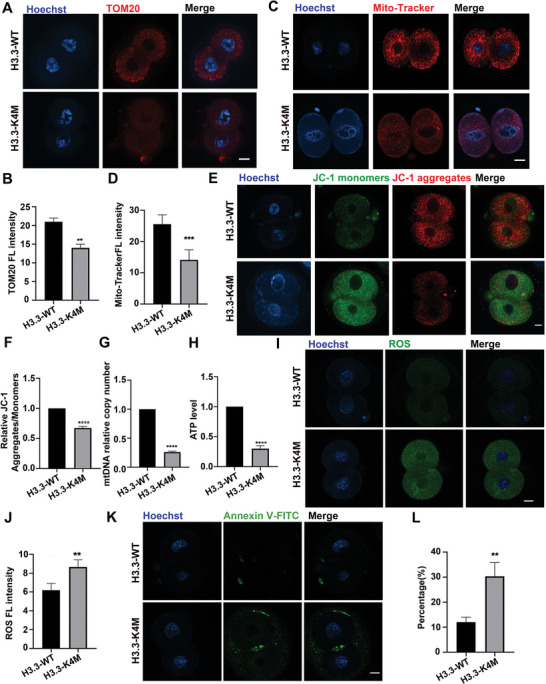
Significantly decreased H3K4 methylation in oocytes from aged mice indicates the important roles of H3K4 methylation in female reproduction. However, how H3K4 methylation regulates oocyte development remains largely unexplored. In this study, it is demonstrated that oocyte-specific expression of dominant negative mutant H3.3-K4M led to a decrease of the level of H3K4 methylation in mouse oocytes, resulting in reduced transcriptional activity and increased DNA methylation in oocytes, disturbed oocyte developmental potency, and fertility of female mice. The impaired expression of genes regulating mitochondrial functions in H3.3-K4M oocytes, accompanied by mitochondrial abnormalities, is further noticed. Moreover, early embryos from H3.3-K4M oocytes show developmental arrest and reduced zygotic genome activation. Collectively, these results show that H3K4 methylation in oocytes is critical to orchestrating gene expression profile, driving the oocyte developmental program, and ensuring oocyte quality. This study also improves understanding of how histone modifications regulate organelle dynamics in oocytes.

Keywords: H3K4 methylation; mitochondrial dysfunction; oocyte; oogenesis; zygotic genome activation.


Conflict of interest statement

The authors declare no conflict of interest.

Figures

Figure 1
Figure 1
Generation and verification of transgenic mouse models. A) Schematic illustration of breeding strategy. B) Representative genotyping results of H3.3‐WT, H3.3‐K4M, and WT mice. C) RT‐PCR combined with Sanger sequencing of PCR products proved the expression of H3.3‐K4M in the ovary of H3.3‐K4M transgenic mice. D) qRT‐PCR analysis of ovaries from F1, F2, and F3 generations at P14, and H3.3‐WT and H3.3‐K4M mice showed similar levels of exogenous H3.3 transcripts in ovaries. Data are presented as Mean ± SD (n = 3 for each group), ns p > 0.05. E–G) Immunofluorescence staining and fluorescence intensity quantification of H3K4me3 (E), FLAG (E), H3K4me2 (F), and H3K4me1 (G) in GV oocytes of H3.3‐WT and H3.3‐K4M transgenic mice. Scale bar = 10 µm. Data are presented as Mean ± SD (n = 8 for each group), ns p > 0.05, ****p < 0.0001, **p < 0.01.
Figure 2
Figure 2
H3.3‐K4M female mice were infertile and produced less mature oocytes. A) Cumulative numbers of pups per female of indicated genotypes. Note that H3.3‐K4M female mice were infertile. B,C) Representative bright field images of ovaries (left panel) and ovary/body weight ratio (right panel) of 2‐month‐old H3.3‐WT and H3.3‐K4M mice. Data are presented as Mean ± SD (n = 3 for each group), ***p < 0.001. D) The numbers of MII oocytes collected per adult female mice (6‐to‐8‐week) after superovulation. Data are presented as Mean ± SD (n = 8 for each group), ****p < 0.0001. E) Representative images of the spindle of MII oocytes derived from H3.3‐WT and H3.3‐K4M mice. Scale bar = 10 µm. F) The percent of abnormal spindle of MII oocytes derived from H3.3‐WT and H3.3‐K4M mice. Data are presented as Mean ± SD (n = 100 MII oocytes from each genotype), ns p > 0.05. G) Representative bright field images of GV oocytes from 2‐month‐old H3.3‐WT and H3.3‐K4M mice. Scale bar = 20 µm. H) Representative images of DAPI staining displaying the chromatin configuration of NSN and SN GV oocytes. Scale bar = 10 µm. I) Quantification of percentages of NSN and SN in H3.3‐WT (n = 145) and H3.3‐K4M (n = 136) GV oocytes from adult females (6–8 weeks). Data are presented as Mean ± SD (n = 8 for each group), ***p < 0.001.
Figure 3
Figure 3
Follicle development and oocyte maturation were disturbed in H3.3‐K4M mice. A) Hematoxylin/eosin staining of the paraffin slides showing the morphologies of ovaries from 2‐week(2W), 2‐month(2M), and 5‐month(5M)‐old H3.3‐WT and H3.3‐K4M mice. Statistical analysis of the numbers of follicles in the ovaries of H3.3‐WT and H3.3‐K4M transgenic mice are shown in right. Data are presented as Mean ± SD (n = 3 for each group), *p < 0.05, **p < 0.01, ***p < 0.001, ****p < 0.0001. B) TUNEL assay of paraffin slides of ovaries from 2‐month‐old H3.3‐WT and H3.3‐K4M mice, Scale bar = 200 µm. C,D) Statistical analysis of the TUNEL assay was performed. Data are presented as Mean ± SD, n = 3 for each group, ns p > 0.05, ***p < 0.001. E) GVBD ratio and maturation ratio of H3.3‐WT and H3.3‐K4M oocytes after IVM for 2 or 16 h. Left panel shows representative bright field images of H3.3‐WT and H3.3‐K4M oocytes after IVM for 2 or 16 h. Scale bar = 200 µm. Right panels show the quantification of the GVBD ratio and maturation ratio for H3.3‐WT (n = 50 for each group) and H3.3‐K4M (n = 50 for each group) GV oocytes from ovaries of 6‐to‐8‐week mice.
Figure 4
Figure 4
Transcriptome analysis of H3.3‐WT/K4M oocytes. A) Scatterplot displaying DEGs (downregulated, blue; upregulated, red) in H3.3‐K4M GV oocytes compared with H3.3‐WT GV oocytes, with Drp1 and Opa1 genes marked in orange. B) Heatmap showing differential gene expression in H3.3‐WT and H3.3‐K4M GV oocytes. C) Immunofluorescence staining and the fluorescence intensities of H3K27ac in H3.3‐WT and H3.3‐K4M GV oocytes. Scale bar = 10 µm. Data are presented as Mean ± SD, n = 20 GV oocytes derived from each genotype, ***p < 0.001. D) Immunofluorescence staining and the fluorescence intensities of PolII in H3.3‐WT and H3.3‐K4M GV oocytes. Scale bar = 10 µm. Data are presented as Mean ± SD, n = 20 GV oocytes derived from each genotype, ns p > 0.05. E) Immunofluorescence staining and the fluorescence intensities of Ser2P in H3.3‐WT and H3.3‐K4M GV oocytes. Scale bar = 10 µm. Data are presented as Mean ± SD, n = 20 GV oocytes derived from each genotype, ***p < 0.001. F) Immunofluorescence staining after EU treatment of oocytes and the fluorescence intensities of EU in H3.3‐WT and H3.3‐K4M GV oocytes. Scale bar = 20 µm. Data are presented as Mean ± SD, n = 10 GV oocytes derived from each genotype, *p < 0.05. G) Read density plot of PolII signals at the promoter (2 kb flanking TSSs) and distal (2 kb flanking center) regions in H3.3‐WT and H3.3‐K4M oocytes. H) Pearson correlation coefficient of H3K4me3 and PolII enrichment at gene promoters in H3.3‐WT and H3.3‐K4M oocytes. I) Read density plot of H3K4me3 signals at the promoter (2 kb flanking TSSs) and distal (2 kb flanking center) regions in H3.3‐WT and H3.3‐K4M oocytes. J) Read density plot showing PolII and H3K4me3 enrichment of down‐regulated genes at the promoter (2 kb flanking TSSs) regions in H3.3‐WT and H3.3‐K4M oocytes.
Figure 5
Figure 5
Increase of DNA methylation in H3.3‐K4M oocytes. A) Immunofluorescence staining and B) the fluorescence intensities of DNMT3A in H3.3‐WT and H3.3‐K4M GV oocytes. Scale bar = 10 µm. Data are presented as Mean ± SD, n = 18 GV oocytes derived from each genotype, **p < 0.01. C) Smooth scatter plot shows CpG methylation levels in H3.3‐WT and H3.3‐K4M GV oocytes. D) Violin plot shows alterations of DNA methylation at CGI and non‐CGI in H3.3‐WT and H3.3‐K4M GV oocytes. p values by Wilcoxon Test. E) Violin plot shows alterations of DNA methylation at gene feature regions, including promoter, gene body, and intergenic region, with black horizontal lines indicating the median. p values by Wilcoxon Test. F) Violin plot shows alterations of DNA methylation at gene feature regions of down‐regulated genes, including promoter, gene body, and intergenic region, with black horizontal lines indicating the median. p values by Wilcoxon Test. G) Violin plot shows alterations of DNA methylation at gene feature regions of up‐regulated genes, including promoter, gene body, and intergenic region, with black horizontal lines indicating the median. p values by Wilcoxon Test. H) Pearson correlation coefficient of H3K4me3 enrichment and DNA methylation at gene promoter regions in H3.3‐WT and H3.3‐K4M oocytes. Read density plot showing the percentage of DNA methylation at I) genic and J) distal regions in H3.3‐WT and H3.3‐K4M oocytes.
Figure 6
Figure 6
Downregulation of Drp1 in H3.3‐K4M oocytes. A) Heatmap of mean gene expression of key mitochondrial dynamics regulators in H3.3‐WT and H3.3‐K4M GV oocytes. B) Relative expression of mitochondrial dynamics regulators validated by qRT‐PCR. C) Immunofluorescence staining and the fluorescence intensities of DRP1 in H3.3‐WT and H3.3‐K4M GV oocytes. Scale bar = 10 µm. Data are presented as Mean ± SD, n = 17 GV oocytes derived from each genotype, **p < 0.01. D) Visualization of DNA methylation landscape at Drp1 locus in H3.3‐WT and H3.3‐K4M GV oocytes.
Figure 7
Figure 7
Mitochondrial dysfunction in H3.3‐K4M oocytes. A) Immunofluorescence staining of TOM20 in H3.3‐WT and H3.3‐K4M GV oocytes. Scale bar = 10 µm. B) The fluorescence intensity quantification of TOM20 in H3.3‐WT and H3.3‐K4M GV oocytes. Data are presented as Mean ± SD, n = 20 GV oocytes derived from each genotype, **p < 0.01. C) H3.3‐WT and H3.3‐K4M GV oocytes were labeled with Mito‐Tracker Red to visualize active mitochondria for examination of quantification and localization. Scale bar = 10 µm. D) The fluorescence intensity quantification of Mito‐Tracker Red in H3.3‐WT and H3.3‐K4M GV oocytes. Data are presented as Mean ± SD, n = 20 GV oocytes derived from each genotype, ** p <0.01. E) Representative images of mitochondrial membrane potential assessed by JC‐1 dye. Scale bar = 10 µm. F) Histogram showing the JC‐1 aggregates/monomers fluorescence ratio. Data are presented as Mean ± SD, n = 20 GV oocytes derived from each genotype, ***p < 0.001. G) The relative mtDNA copy numbers in H3.3‐WT and H3.3‐K4M GV oocytes. Data are presented as Mean ± SD, n = 20 GV oocytes derived from each genotype, ****p < 0.0001. H) Quantitative analysis of the relative ATP levels from H3.3‐WT and H3.3‐K4M GV oocytes. Data are presented as Mean ± SD, n = 20 GV oocytes derived from each genotype, ****p < 0.0001. I) H3.3‐WT and H3.3‐K4M GV oocytes were labeled with DCFH‐DA to visualize ROS level. Scale bar = 10 µm. Right panel shows the quantification of fluorescence intensity of ROS in H3.3‐WT and H3.3‐K4M oocytes. Data are presented as Mean ± SD, n = 20 GV oocytes derived from each genotype, **p < 0.01. J) Relative expression of Nrf2, Sod2, Gsr, and Gpx1 in H3.3‐WT and H3.3‐K4M oocytes by qRT‐PCR. Data are presented as Mean ± SD, n = 3, *p < 0.05, **p < 0.01, ***p < 0.001. K) H3.3‐WT and H3.3‐K4M oocytes were labeled with Annexin‐V‐FITC to visualize apoptosis level. Scale bar = 10 µm. Right panel shows the percent of Annexin‐V‐FITC positive oocytes from H3.3‐WT and H3.3‐K4M mice. Data are presented as Mean ± SD, n = 20 GV oocytes derived from each genotype, **p < 0.01. L) Relative expression of pro‐apoptotic related genes in H3.3‐WT and H3.3‐K4M oocytes by qRT‐PCR. Data are presented as Mean ± SD, n = 3, *p < 0.05, **p < 0.01, ***p < 0.001.
Figure 8
Figure 8
Early embryonic developmental arrest of H3.3‐K4M embryos. A) The numbers of zygotes per adult female mice (6‐to‐8‐week) after superovulation. Data are presented as Mean ± SD (n = 8), **p < 0.01. B) Representative bright field images of the early development of embryos by mating H3.3‐WT/K4M female with WT male for zygote collection and culturing for 24, 48, and 72, respectively. Scale bar = 50 µm. C,D) Immunofluorescence staining and fluorescence intensity quantification of histone methylation (C) and histone acetylation (D) in 2‐cell embryos derived from H3.3‐WT and H3.3‐K4M transgenic mice. Scale bar = 10 µm. Data are presented as Mean ± SD, n = 10 2‐cell embryos were derived from each genotype, *p < 0.05, **p < 0.01, ***p < 0.001, ****p < 0.0001. E) Immunofluorescence staining of ZSCAN4 in 2‐cell embryos from H3.3‐WT and H3.3‐K4M female. Scale bar = 10 µm. F) Quantification of fluorescence intensity of ZSCAN4 in 2‐cell embryos from H3.3‐WT and H3.3‐K4M females. Data are presented as Mean ± SD, n = 10 2‐cell embryos were derived from each genotype, **p < 0.01. G) Immunofluorescence staining of MERVL in 2‐cell embryos of H3.3‐WT and H3.3‐K4M female. Scale bar = 10 µm. H) Quantification of fluorescence intensity of MERVL in 2‐cell embryos of H3.3‐WT and H3.3‐K4M female. Data are presented as Mean ± SD, n = 10 2‐cell embryos were derived from each genotype, ****p < 0.0001. I) The relative mRNA levels of Zscan4d, Mervl, Dux, Eif1a, and Tcstv3 by RT‐qPCR in 2‐cell embryos derived from H3.3‐WT and H3.3‐K4M female. Data are presented as Mean ± SD, n = 10 2‐cell embryos were derived from each genotype, **p < 0.01, ****p < 0.0001.
Figure 9
Figure 9
Mitochondrial dysfunction in H3.3‐K4M embryos. A) Immunofluorescence staining of TOM20 in H3.3‐WT and H3.3‐K4M 2‐cell embryos. Scale bar = 10 µm. B) Fluorescence intensity quantification of TOM20 in H3.3‐WT and H3.3‐K4M 2‐cell embryos. Data are presented as Mean ± SD, n = 10 2‐cell embryos were derived from each genotype, **p < 0.01. C) H3.3‐WT and H3.3‐K4M 2‐cell embryos were labeled with Mito‐Tracker Red to visualize active mitochondria. Scale bar = 10 µm. D) Fluorescence intensity quantification of Mito‐Tracker Red in H3.3‐WT and H3.3‐K4M 2‐cell embryos. Data are presented as Mean ± SD, n = 10 2‐cell embryos were derived from each genotype, ***p < 0.001. E) Representative images of mitochondrial membrane potential assessed by JC‐1 dye. Scale bar = 10 µm. F) Histogram showing the JC‐1 aggregates/monomers fluorescence ratio. Data are presented as Mean ± SD, n = 10 2‐cell embryos were derived from each genotype, ****p < 0.0001. G) The relative mtDNA copy numbers in H3.3‐WT and H3.3‐K4M 2‐cell embryos. Data are presented as Mean ± SD, n = 10 2‐cell embryos were derived from each genotype, ****p < 0.0001. H) Quantitative analysis of the relative ATP levels in H3.3‐WT and H3.3‐K4M 2‐cell embryos. Data are presented as Mean ± SD, n = 10 2‐cell embryos were derived from each genotype, ****p < 0.0001. I) H3.3‐WT and H3.3‐K4M 2‐cell embryos were labeled with DCFH‐DA to visualize ROS level. Scale bar = 10 µm. J) The fluorescence intensity of ROS in H3.3‐WT and H3.3‐K4M 2‐cell embryos. Data are presented as Mean ± SD, n = 10 2‐cell embryos were derived from each genotype, **p < 0.01. K) H3.3‐WT and H3.3‐K4M 2‐cell embryos were labeled with Annexin‐V‐FITC to visualize apoptosis level. Scale bar = 10 µm. L) The percent of Annexin‐V‐FITC positive 2‐cell embryos from H3.3‐WT and H3.3‐K4M female. Data are presented as Mean ± SD, n = 10 2‐cell embryos were derived from each genotype, **p < 0.01.

References

    1. Vander Borght M., Wyns C., Clin. Biochem. 2018, 62, 2. - PubMed
    1. Zhou Z., Zheng D., Wu H., Li R., Xu S., Kang Y., Cao Y., Chen X., Zhu Y., Xu S., Chen Z.‐J., Mol B.w, Qiao J., BJOG 2018, 125, 432. - PubMed
    1. Zheng D., Zhou Z., Li R., Wu H., Xu S., Kang Y., Cao Y., Chen X., Zhu Y., Xu S., Chen Z.i‐J., Mol B. W., Qiao J., Reprod. Biomed. Online 2019, 38, 917. - PubMed
    1. Bilmez Y., Talibova G., Ozturk S., Histochem. Cell Biol. 2022, 157, 7. - PubMed
    1. Wang Y., Liu Q., Tang F., Yan L., Qiao J., Annu. Rev. Genomics Hum. Genet. 2019, 20, 21. - PubMed

Publication types

LinkOut - more resources