. 2023 Feb 3:11:1070117.
doi: 10.3389/fbioe.2023.1070117. eCollection 2023.

Eldecalcitol effectively prevents alveolar bone loss by partially improving Th17/Treg cell balance in diabetes-associated periodontitis

Affiliations

Eldecalcitol effectively prevents alveolar bone loss by partially improving Th17/Treg cell balance in diabetes-associated periodontitis

Ruihan Gao et al. Front Bioeng Biotechnol. .

Abstract

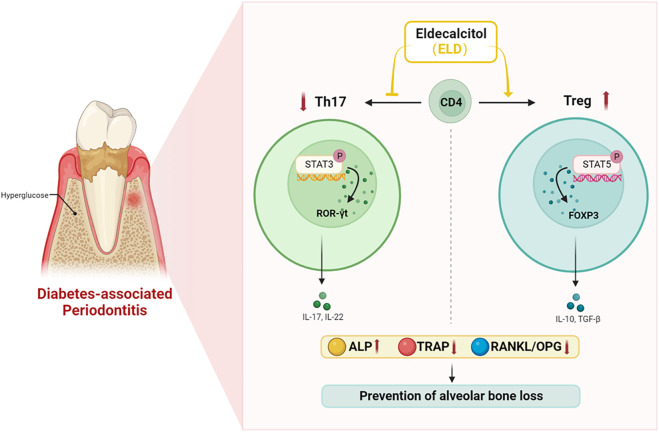
Background: Diabetes-associated periodontitis (DPD) is an inflammatory and destructive disease of periodontal tissues in the diabetic population. The disease is manifested as more severe periodontal destruction and is more difficult to treat when compared with periodontitis (PD). Eldecalcitol (ELD) is a novel active vitamin D3 analog; however, little clinical evidence is available on its role on improving PD and DPD, and its specific mechanisms remain unclear. In this study, we evaluated the preventative effects of ELD toward PD and DPD and explored its underlying molecular mechanisms. Methods: Experimental PD and DPD mouse models were established by ligation combined with lipopolysaccharide (LPS) from Porphyromonas gingivalis injection in C57BL/6J and C57BLKS/J Iar- + Leprdb/+Leprdb (db/db) mice, respectively. Simultaneously, ELD (0.25 μg/kg) was orally administered to mice via an intragastric method. Micro-computed tomography (CT), hematoxylin-eosin (HE) staining, immunohistochemistry (IHC), and tartrate-resistant acid phosphatase (TRAP) staining were used to evaluate alveolar bone alterations in vivo. Flow cytometry, immunofluorescence, and real-time polymerase chain reaction (qRT-PCR) were also used to examine gene expression and probe systemic and local changes in Treg and Th17 cell numbers. Additionally, western blotting and immunofluorescence staining were used to examine changes in STAT3/STAT5 signaling. Results: Micro-CT and HE staining showed that the DPD group had higher alveolar bone loss when compared with the PD group. After applying ELD, alveolar bone loss decreased significantly in both PD and DPD groups, and particularly evident in the DPD group. IHC and TRAP staining also showed that ELD promoted osteoblast activity while inhibiting the number of osteoclasts, and after ELD treatment, the receptor activator of nuclear factor-κB ligand (RANKL) to osteoprotegerin (OPG) ratio decreased. More importantly, this decreasing trend was more obvious in the DPD group. Flow cytometry and qRT-PCR also showed that the systemic Th17/Treg imbalance in PD and DPD groups was partially resolved when animals were supplemented with ELD, while immunofluorescence staining and qRT-PCR data showed the Th17/Treg imbalance was partially resolved in the alveolar bone of both ELD supplemented groups. Western blotting and immunofluorescence staining showed increased p-STAT5 and decreased p-STAT3 levels after ELD application. Conclusion: ELD exerted preventative effects toward PD and DPD by partially rectifying Th17/Treg cell imbalance via STAT3/STAT5 signaling. More importantly, given the severity of DPD, we found ELD was more advantageous in preventing DPD.

Keywords: STAT3/STAT5 signaling; Th17/Treg balance; diabetes-associated periodontitis; eldecalcitol; periodontitis.


Conflict of interest statement

The authors declare that the research was conducted in the absence of any commercial or financial relationships that could be construed as a potential conflict of interest.

Figures

FIGURE 1
FIGURE 1
Micro-CT analysis and histological alterations in the maxillary alveolar bone. (A) 3D images of micro-CT in the (A) control, (B) PD and (C) DPD groups. (d) Statistical analysis of alveolar bone loss. (B) Low magnification of histological images of the alveolar bone in the (A) control, (B) PD and (C) DPD groups. (d) Statistical analysis of alveolar bone loss. “*”, the alveolar ridge crest. (C) Double staining for ALP (brown) and TRAP (red) in the alveolar bone of the (A) control, (B) PD and (C) DPD groups. (d) Statistical analyses of ALP positive. (e) TRAP positive osteoclast count. Immunostaining of RANKL in the (f) control, (g) PD and (h) DPD groups. (i) Statistical analysis of the activity of RANKL. Immunostaining of OPG in the (j) control, (k) PD and (l) DPD groups. (m) Statistical analysis of the activity of OPG. (n) The ratio of RANKL/OPG. Positive staining has been marked with arrows or “*” in the figures. Data were shown as mean ± SD (*p < 0.05. **p < 0.01. ***p < 0.001 https://www.frontiersin.org/register. Ab, alveolar bone; D, dentin; L, ligature.
FIGURE 2
FIGURE 2
Flow cytometry and qRT-PCR analysis of Th17 and Treg cells in spleen lymphocytes. (A) (A) Flow cytometry analysis of CD4+ FOXP3+ T cells (in the upper right quadrant) in the spleen lymphocytes in the control, PD and DPD groups. (b) Statistical analysis of CD4+ FOXP3+ T cells in the spleen lymphocytes. (c) Flow cytometry analysis of CD4+ IL-17A+ T cells (in the upper right quadrant) in the spleen lymphocytes in the control, PD and DPD groups. (d) Statistical analysis of CD4+ IL-17A+ T cells in the spleen lymphocytes. (e) The ratio of Th17/Treg cells. (B) Relative mRNA expression level of (A) FOXP3, (b) TGF-β, (c) IL-17A, (d) ROR-ɣt, and (e) the ratio of IL-17A/FOXP3 in the control, PD and DPD groups. Data were shown as mean ± SD (*p < 0.05. **p < 0.01. ***p < 0.001).
FIGURE 3
FIGURE 3
Immunofluorescence and qRT-PCR analysis of Th17 and Treg cells in the maxillary alveolar bone. (A) The representative immunofluorescence staining images of CD4+ FOXP3+ T cells in the (a) control, (b) PD and (c) DPD groups. (d) The statistical analysis of CD4+FOXP3+ T cell counts. The representative immunofluorescence staining images of CD4+ IL-17A+ T cells in the (e) control, (f) PD and (g) DPD groups. (h) The statistical analysis of CD4+ IL-17A+ T cell counts. (i) The ratio of Th17/Treg cells. (B) Relative mRNA expression level of (a) FOXP3, (b) TGF-β, (c) IL-17A, (d) ROR-ɣt, and (e) the ratio of IL-17A/FOXP3 in the control, PD and DPD groups. Data were shown as mean ± SD (*p < 0.05. **p < 0.01. ***p < 0.001).
FIGURE 4
FIGURE 4
Micro-CT analysis and histological alterations in the maxillary alveolar bone with ELD treatment. (A) 3D images of micro-CT in the (a) PD, (B) PD + ELD, (c) DPD and (d)DPD + ELD groups. (e) Statistical analysis of the data from micro-CT for alveolar bone loss. (B) Low magnification of histological images of the alveolar bone in the (a) PD, (B) PD + ELD, (c) DPD and (d) DPD + ELD groups. (e) Statistical analysis of the data from HE staining for alveolar bone loss. “*“, the alveolar ridge crest. (C) Double staining for ALP (brown) and TRAP (red) in the alveolar bone of the (a) PD, (b) PD + ELD, (c) DPD and (d) DPD + ELD groups. Statistical analysis of (e) ALP positive and (f) TRAP positive osteoclast counts. Immunostaining of RANKL in the (G) PD, (h) PD + ELD, (i) DPD and (j) DPD + ELD groups. (k) Statistical analysis of the activity of RANKL. Immunostaining of OPG in the (l) PD, (m) PD + ELD, (n) DPD and (o) DPD + ELD groups. (p) Statistical analysis of the activity of OPG. (q) The ratio of RANKL/OPG. Positive staining has been marked with arrows or “*” in the figures. Data were shown as mean ± SD (*p < 0.05. **p < 0.01. ***p < 0.001). Ab, alveolar bone; D, dentin; L, ligature.
FIGURE 5
FIGURE 5
Flow cytometry and qRT-PCR analysis of Th17 and Treg cells with ELD treatment in spleen lymphocytes. (A) (a) Flow cytometry analysis of CD4+ FOXP3+ T cells (in the upper right quadrant) in the spleen lymphocytes in the PD, PD + ELD, DPD and DPD + ELD groups. (b) Statistical analysis of CD4+ FOXP3+ T cells in the spleen lymphocytes. (c) Flow cytometry analysis of CD4+ IL-17A+ T cells (in the upper right quadrant) in the spleen lymphocytes in the PD, PD + ELD, DPD and DPD + ELD groups. (d) Statistical analysis of CD4+ IL-17A+ T cells in the spleen lymphocytes. (e) The ratio of Th17/Treg cells. (B) Relative mRNA expression levels of (a) FOXP3, (b) TGF-β, (c) IL-17A, (d) ROR-ɣt and (e) the ratio of IL-17A/FOXP3 in the PD, PD + ELD, DPD and DPD + ELD groups. Data were shown as mean ± SD (*p < 0.05. **p < 0.01. ***p < 0.001).
FIGURE 6
FIGURE 6
Immunofluorescence and qRT-PCR analysis of Th17 and Treg cells in the maxillary alveolar bone with ELD treatment. (A) The representative immunofluorescence staining images of CD4+ FOXP3+ T cells in the (a) PD, (b) PD + ELD, (c) DPD and (d) DPD + ELD groups. (e) The statistical analysis of CD4+ FOXP3+ T cell counts. The representative immunofluorescence staining images of CD4+ IL-17A+ T cells in the (f) PD, (g) PD + ELD, (h) DPD and (i) DPD + ELD groups. (j) The statistical analysis of the number of CD4+ IL-17A+ T cells. (k) The ratio of Th17/Treg cells. (B) Relative mRNA expression levels of (A) FOXP3, (b) TGF-β, (c) IL-17A, (d) ROR-ɣt and (e) the ratio of IL-17A/FOXP3 in the PD, PD + ELD, DPD and DPD + ELD groups. Data were shown as mean ± SD (*p < 0.05. **p < 0.01. ***p < 0.001).
FIGURE 7
FIGURE 7
ELD regulated Th17/Treg cells through the STAT3/STAT5 signal. (A) (a) The protein expression of p-STAT3, STAT3, p-STAT5, STAT5 and GAPDH detected by western blotting in the PD, PD + ELD, DPD and DPD + ELD groups. The statistical analysis of (b) p-STAT3/STAT3, (c) p-STAT5/STAT5 and (d) the ratio of p-STAT3/p-STAT5 in western blotting. (B) The representative immunofluorescence staining images of p-STAT3+IL-17A+ cells in the (a) PD, (b) PD + ELD, (c) DPD and (d) DPD + ELD groups. (e) The statistical analysis of p-STAT3+IL-17A+ cell counts. The representative immunofluorescence staining images of p-STAT5+FOXP3+ cells in the (f) PD, (g) PD + ELD, (h) DPD and (i) DPD + ELD groups. (j) The statistical analysis of p-STAT5+FOXP3+ cell counts. (k) The ratio of p-STAT3+IL-17A+/p-STAT5+FOXP3+ cells. Data were shown as mean ± SD (*p < 0.05. **p < 0.01. ***p < 0.001).
FIGURE 8
FIGURE 8
ELD effectively prevented alveolar bone loss by partially correcting the imbalance in Th17/Treg cells in DPD via the STAT3/STAT5 signal. ELD prevented alveolar bone loss in DPD by partially correcting the imbalance in Th17/Treg cells. One possible action mechanism may be that ELD corrected the imbalance in Th17/Treg cells by the STAT3/STAT5 signal.

References

    1. Abroun S., Saki N., Ahmadvand M., Asghari F., Salari F., Rahim F. (2015). STATs: An old story, yet mesmerizing. Cell J. 17 (3), 395–411. 10.22074/cellj.2015.1 - DOI - PMC - PubMed
    1. Baeke F., Takiishi T., Korf H., Gysemans C., Mathieu C. (2010). Vitamin D: Modulator of the immune system. Curr. Opin. Pharmacol. 10 (4), 482–496. 10.1016/j.coph.2010.04.001 - DOI - PubMed
    1. Barutta F., Bellini S., Durazzo M., Gruden G. (2022). Novel insight into the mechanisms of the bidirectional relationship between diabetes and periodontitis. Biomedicines 10 (1), 178. 10.3390/biomedicines10010178 - DOI - PMC - PubMed
    1. Becerra-Ruiz J. S., Guerrero-Velázquez C., Martínez-Esquivias F., Martínez-Pérez L. A., Guzmán-Flores J. M. (2022). Innate and adaptive immunity of periodontal disease. From etiology to alveolar bone loss. Oral Dis. 28 (6), 1441–1447. 10.1111/odi.13884 - DOI - PubMed
    1. Bosshardt D. D. (2018). The periodontal pocket: Pathogenesis, histopathology and consequences. Periodontol. 2000 76 (1), 43–50. 10.1111/prd.12153 - DOI - PubMed