

Dynamic spectral cues do not affect human sound localization during small head movements
- PMID: 36816108
- PMCID: PMC9936143
- DOI: 10.3389/fnins.2023.1027827
Dynamic spectral cues do not affect human sound localization during small head movements
Abstract
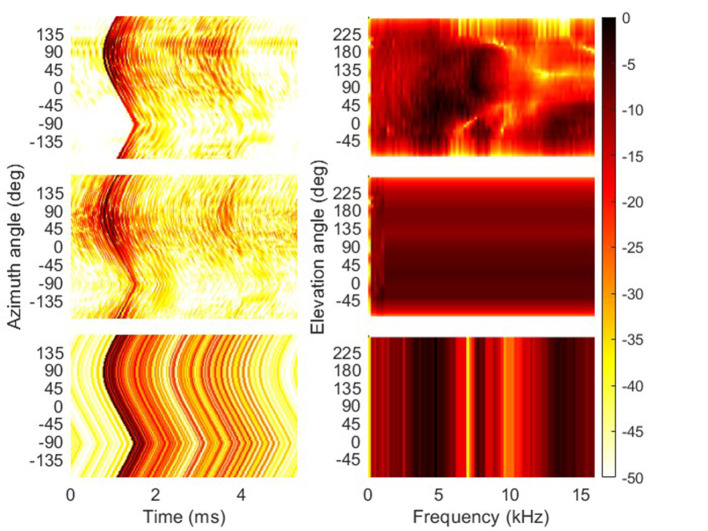
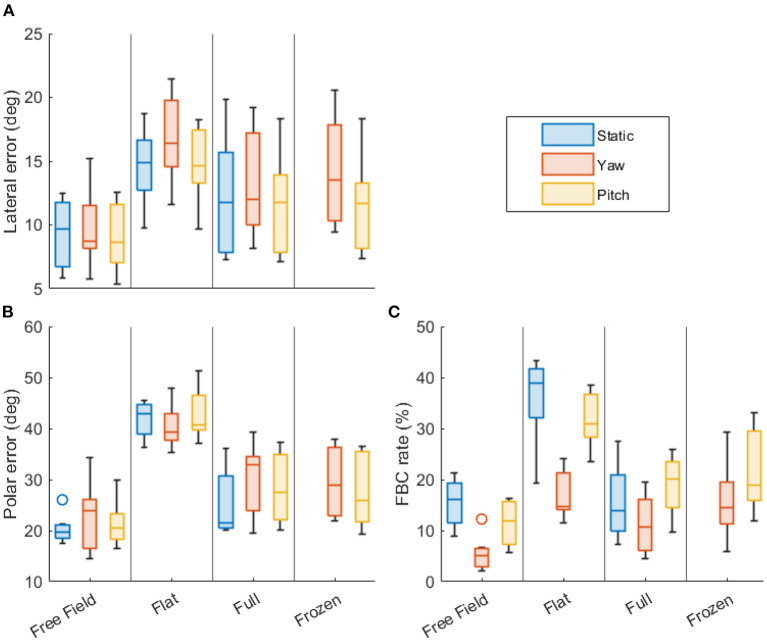
Natural listening involves a constant deployment of small head movement. Spatial listening is facilitated by head movements, especially when resolving front-back confusions, an otherwise common issue during sound localization under head-still conditions. The present study investigated which acoustic cues are utilized by human listeners to localize sounds using small head movements (below ±10° around the center). Seven normal-hearing subjects participated in a sound localization experiment in a virtual reality environment. Four acoustic cue stimulus conditions were presented (full spectrum, flattened spectrum, frozen spectrum, free-field) under three movement conditions (no movement, head rotations over the yaw axis and over the pitch axis). Localization performance was assessed using three metrics: lateral and polar precision error and front-back confusion rate. Analysis through mixed-effects models showed that even small yaw rotations provide a remarkable decrease in front-back confusion rate, whereas pitch rotations did not show much of an effect. Furthermore, MSS cues improved localization performance even in the presence of dITD cues. However, performance was similar between stimuli with and without dMSS cues. This indicates that human listeners utilize the MSS cues before the head moves, but do not rely on dMSS cues to localize sounds when utilizing small head movements.
Keywords: active localization; binaural audio; dynamic cues; front-back confusion; head rotation; spectral cues.
Copyright © 2023 McLachlan, Majdak, Reijniers, Mihocic and Peremans.
Conflict of interest statement
The authors declare that the research was conducted in the absence of any commercial or financial relationships that could be construed as a potential conflict of interest.
Figures


Similar articles
-
Head Movements Allow Listeners Bilaterally Implanted With Cochlear Implants to Resolve Front-Back Confusions.Ear Hear. 2018 Nov/Dec;39(6):1224-1231. doi: 10.1097/AUD.0000000000000581. Ear Hear. 2018. PMID: 29664750 Free PMC article.
-
Effects of Head Movements on Sound-Source Localization in Single-Sided Deaf Patients With Their Cochlear Implant On Versus Off.Ear Hear. 2020 Nov/Dec;41(6):1660-1674. doi: 10.1097/AUD.0000000000000882. Ear Hear. 2020. PMID: 33136640 Free PMC article.
-
Resolving front-back ambiguity with head rotation: The role of level dynamics.Hear Res. 2019 Jun;377:196-207. doi: 10.1016/j.heares.2019.03.020. Epub 2019 Apr 1. Hear Res. 2019. PMID: 30981050
-
[Sound localization cues of binaural hearing].Laryngorhinootologie. 2003 Apr;82(4):240-8. doi: 10.1055/s-2003-38932. Laryngorhinootologie. 2003. PMID: 12717598 Review. German.
-
Sound localization.Handb Clin Neurol. 2015;129:99-116. doi: 10.1016/B978-0-444-62630-1.00006-8. Handb Clin Neurol. 2015. PMID: 25726265 Review.
Cited by
-
Sound localization in noisy contexts: performance, metacognitive evaluations and head movements.Cogn Res Princ Implic. 2024 Jan 8;9(1):4. doi: 10.1186/s41235-023-00530-w. Cogn Res Princ Implic. 2024. PMID: 38191869 Free PMC article.
-
Ideal-observer model of human sound localization of sources with unknown spectrum.Sci Rep. 2025 Mar 1;15(1):7289. doi: 10.1038/s41598-025-91001-3. Sci Rep. 2025. PMID: 40025067 Free PMC article.
-
Head rotations follow those of a truncated Fick gimbal during an auditory-guided visual search task.J Neurophysiol. 2024 Dec 1;132(6):1857-1866. doi: 10.1152/jn.00298.2024. Epub 2024 Oct 30. J Neurophysiol. 2024. PMID: 39475488
-
Bayesian active sound localisation: To what extent do humans perform like an ideal-observer?PLoS Comput Biol. 2025 Jan 7;21(1):e1012108. doi: 10.1371/journal.pcbi.1012108. eCollection 2025 Jan. PLoS Comput Biol. 2025. PMID: 39774775 Free PMC article.
-
Head movement and its relation to hearing.Front Psychol. 2023 Jun 28;14:1183303. doi: 10.3389/fpsyg.2023.1183303. eCollection 2023. Front Psychol. 2023. PMID: 37448716 Free PMC article. Review.
References
-
- Becher A., Angerer J., Grauschopf T. (2018). Novel approach to measure motion-to-photon and mouth-to-ear latency in distributed virtual reality systems. arXiv. [preprint]. 10.48550/arXiv.1809.06320 - DOI
-
- Blauert J. (1997). Spatial Hearing: The Psychophysics of Human Sound Localization. Cambridge, MA: MIT press. 10.7551/mitpress/6391.001.0001 - DOI
LinkOut - more resources
Full Text Sources