. 2023 Feb 2:17:1058340.
doi: 10.3389/fnins.2023.1058340. eCollection 2023.

Spatial localization during open-loop smooth pursuit

Affiliations

Spatial localization during open-loop smooth pursuit

Stefan Dowiasch et al. Front Neurosci. .

Abstract

Introduction: Numerous previous studies have shown that eye movements induce errors in the localization of briefly flashed stimuli. Remarkably, the error pattern is indicative of the underlying eye movement and the exact experimental condition. For smooth pursuit eye movements (SPEM) and the slow phase of the optokinetic nystagmus (OKN), perceived stimulus locations are shifted in the direction of the ongoing eye movement, with a hemifield asymmetry observed only during SPEM. During the slow phases of the optokinetic afternystagmus (OKAN), however, the error pattern can be described as a perceptual expansion of space. Different from SPEM and OKN, the OKAN is an open-loop eye movement.

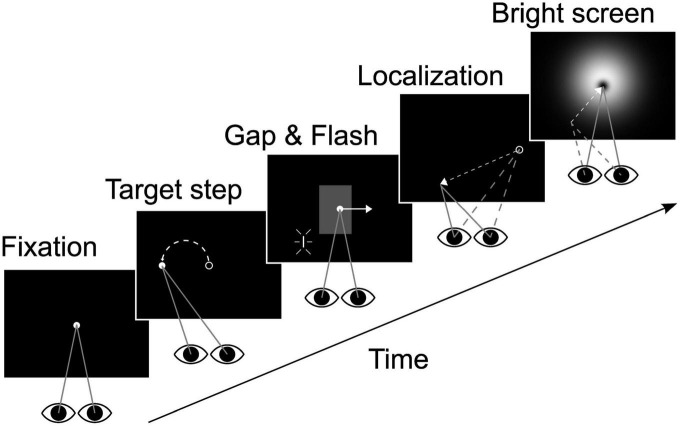
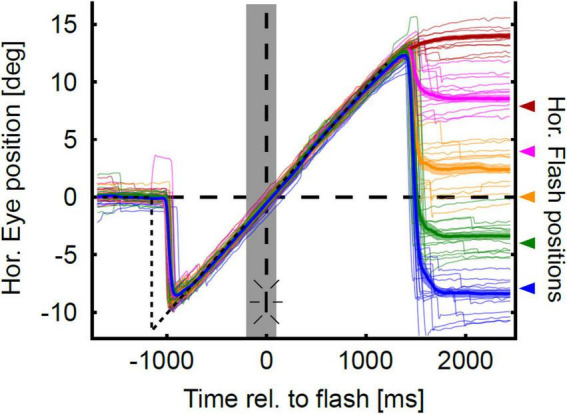
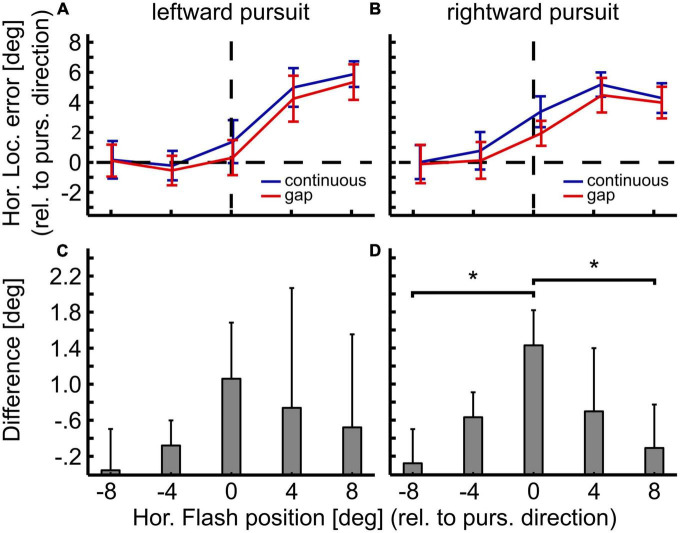
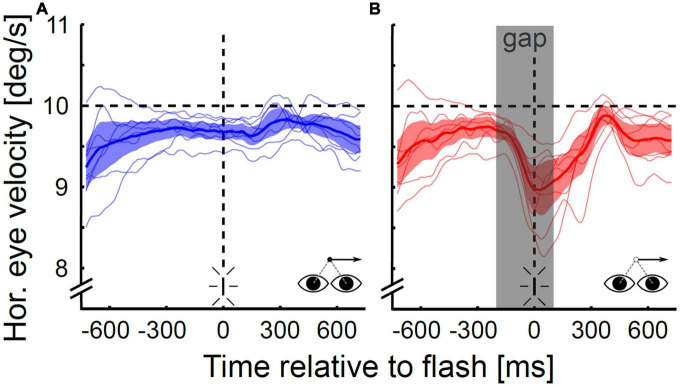
Methods: Visually guided smooth pursuit can be transformed into an open-loop eye movement by briefly blanking the pursuit target (gap). Here, we examined flash localization during open-loop pursuit and asked, whether localization is also prone to errors and whether these are similar to those found during SPEM or during OKAN. Human subjects tracked a pursuit target. In half of the trials, the target was extinguished for 300 ms (gap) during the steady-state, inducing open-loop pursuit. Flashes were presented during this gap or during steady-state (closed-loop) pursuit.

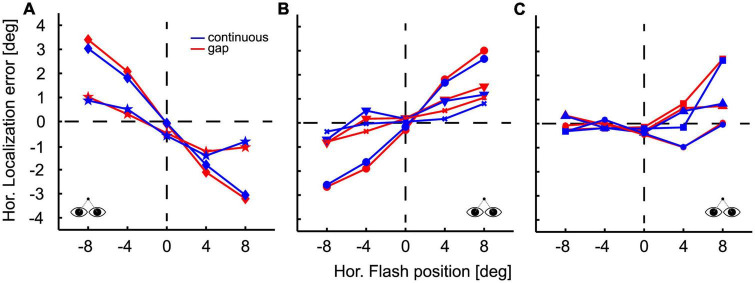
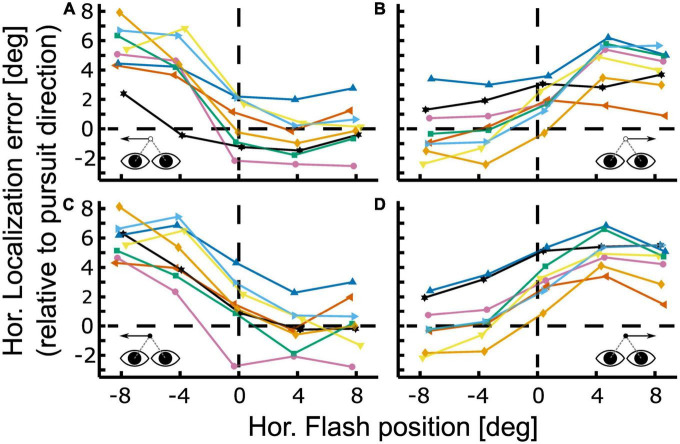
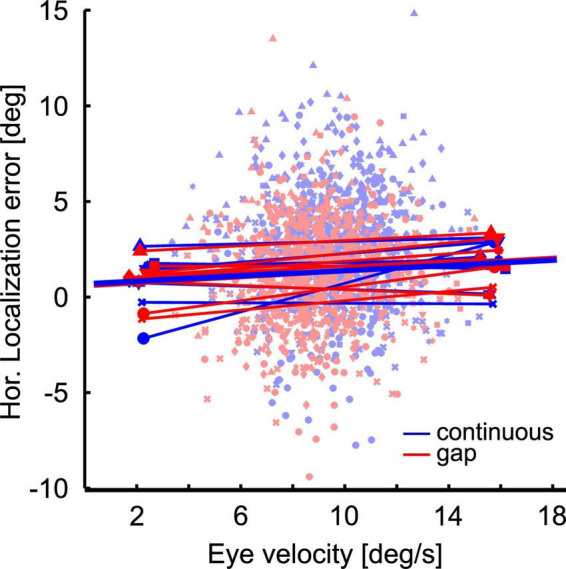
Results: In both conditions, perceived flash locations were shifted in the direction of the eye movement. The overall error pattern was very similar with error size being slightly smaller in the gap condition. The differences between errors in the open- and closed-loop conditions were largest in the central visual field and smallest in the periphery.

Discussion: We discuss the findings in light of the neural substrates driving the different forms of eye movements.

Keywords: localization; localization error; open-loop SPEM; open-loop eye movement; smooth eye movements; smooth pursuit.


Conflict of interest statement

The authors declare that the research was conducted in the absence of any commercial or financial relationships that could be construed as a potential conflict of interest.

Figures

FIGURE 1
FIGURE 1
Experimental design. After initial fixation (500 ms) the target was displaced by 12° either to the left or right (only leftward displacement shown here) and immediately started to move into the opposite direction at 10°/s (2,400 ms pursuit duration). The localization target (“flash”) was presented when the eyes were in the center of the screen. In one half of the trials the target was temporarily blanked (“gap” area indicated in gray in the middle panel, invisible in real trials). Blanking started 200 ms before and lasted till 100 ms after flash presentation. When the target reached 12° eccentricity it was extinguished and subjects performed a localization saccade to the perceived flash position. After position confirmation by key stroke a bright screen was presented to prevent dark adaptation. Flash or eye positions in the individual panels are not drawn to scale. See main text for geometrical details.
FIGURE 2
FIGURE 2
Localization during fixation. Flash position is plotted on the abscissa, localization error on the ordinate, defined as perceived minus presented flash position. Positive error values indicate that the PFP was to the right of the flash; negative error values indicate a perceptual shift to the left. Accordingly, a centripetal bias of flash localization is indicated by positive error values for stimuli presented in the left visual field and negative values for stimuli presented in the right visual fields. Likewise, a centrifugal bias is characterized by negative error values for stimuli in the left visual field and positive error values for stimuli in the right visual field. Conditions are color-coded: results for the continuous target presentation are depicted in blue and those for the gap condition in red. Different symbols indicate data from different subjects. Localization results during fixation were quite different across participants. Data are grouped for illustration purposes. Two subjects exhibited a centripetal bias (A) three subjects showed a centrifugal bias (B) and three subjects exhibited differences in localization in the left and right hemifield (C). Within subjects, differences in localization between pursuit conditions (continuous vs. gap) were not significant, except for one subject for one single target location (+4°) (C).
FIGURE 3
FIGURE 3
Eye position traces in the gap-condition. Sample horizontal eye position traces of one representative subject are color-coded for each flash position (horizontal at −8°, −4°, 0°, 4°, 8°) and aligned to flash onset. The thick colored lines show mean eye position over time, and the lighter colored trace around the mean eye position indicates the confidence intervals as determined by bootstrapping. Time of flash onset is indicated by the vertical dashed line and the flash symbol. Color-code corresponds to the horizontal flash positions which are indicated with arrows at the right axis of the figure. The gray shaded area indicates the duration of target blanking. The horizontal position trace of the pursuit target is indicated by the dashed black line. Eye position traces are initially on target. Target step occurs at −1,200 ms. With a delay of about 240 ms the eyes catch up the moving target and closely follow it despite target blanking. After a latency of about 150 ms after target extinction (at 1,200 ms), the subject executed eye movements toward the perceived horizontal position of the flash. Localization errors can be coarsely estimated as the distance between the mean eye trace and the corresponding flash position.
FIGURE 4
FIGURE 4
Localization during open- and closed-loop pursuit. Localization error is shown for the gap [panels (A,B)] and continuous condition [panels (C,D)] for leftward [panels (A,C)] and rightward [panels (B,D)] Pursuit. Colored lines with symbols depict baseline-corrected single subject data. Positive values indicate localization errors in pursuit direction. All cases show the typical smooth pursuit localization error pattern with small errors in the contraversive hemifield (the hemifield the eyes come from) and larger errors in the ipsiversive hemifield (the hemifield into which the eyes move). The representative subject shown in Figure 3 corresponds to the green line with square markers in this figure.
FIGURE 5
FIGURE 5
Differences in localization between open- and closed-loop condition. Panels in the top row show mean localization error and 95%-confidence intervals for gap (open-loop, red) and continuous (closed-loop, blue) conditions for leftward (A) and rightward pursuit (B). Panels in the bottom row show the difference in localization error between both conditions for leftward (C) and rightward pursuit (D) with 95%-confidence intervals. Overall, localization error was slightly smaller for the gap condition. Yet, this reduction was spatially specific: It was strongest for the straight-ahead flash position and smallest in the periphery. These spatial differences, however, were only statistically significant between the central and the most eccentric flash positions (±8°) for rightward pursuit. *p < 0.05, Wilcoxon signed–rank test, Bonferroni–corrected.
FIGURE 6
FIGURE 6
Horizontal eye velocity during open- and closed-loop pursuit. Data are shown for the continuous (A) and the gap condition (B) for rightward pursuit for the population of subjects (N = 8). The gray shaded area in (B) depicts the target occlusion duration (gap). On average, the eye velocity in the gap condition started to drop 112 ms after gap onset and was 0.7°/s or 7.3% lower at the time of the flash than in the steady-state condition. The minimum velocity was on average reached at 227 ms after gap onset after which subjects either maintained this reduced level for a short duration (∼150–300 ms) or started to re-accelerate.
FIGURE 7
FIGURE 7
Localization error as a function of eye velocity. The scatter plot shows at the single trial level the localization error as function of eye velocity at the time of flash presentation at straight ahead position. Colors (red and blue) indicate the conditions: Continuous (blue) vs. gap (red). Different symbols depict data from different subjects. Thin straight lines are regressions of the individual data sets, thick lines are the averages of these regressions.

Similar articles

References

    1. Barton E. J., Sparks D. L. (2001). Saccades to remembered targets exhibit enhanced orbital position effects in monkeys. Vision Res. 41 2393–2406. 10.1016/s0042-6989(01)00130-4 - DOI - PubMed
    1. Becker W., Fuchs A. F. (1985). Prediction in the oculomotor system: Smooth pursuit during transient disappearance of a visual target. Exp. Brain Res. 57 562–575. - PubMed
    1. Binda P., Morrone M. C. (2018). Vision during saccadic eye movements. Annu. Rev. Vision Sci. 4 193–213. - PubMed
    1. Blanke M., Harsch L., Knoll J., Bremmer F. (2010). Spatial perception during pursuit initiation. Vision Res. 50 2714–2720. - PubMed
    1. Blohm G., Missal M., Lefevre P. (2003). Smooth anticipatory eye movements alter the memorized position of flashed targets. J. Vision 3 761–770. 10.1167/3.11.10 - DOI - PubMed