

Formulation and Evaluation of Pravastatin Sodium-Loaded PLGA Nanoparticles: In vitro-in vivo Studies Assessment
- PMID: 36816332
- PMCID: PMC9936887
- DOI: 10.2147/IJN.S394701
Formulation and Evaluation of Pravastatin Sodium-Loaded PLGA Nanoparticles: In vitro-in vivo Studies Assessment
Abstract
Purpose: Pravastatin sodium (PVS) is a hypolipidemic drug which suffers from extensive first-pass metabolism and short half-life. Poly(d,l-lactide-co-glycolide) (PLGA) is considered a promising carrier to improve its hypolipidemic and hepatoprotective activities.
Methods: PVS-loaded PLGA nanoparticles (PVS-PLGA-NPs) were prepared by double emulsion method using a full 32 factorial design. The in vitro release and the physical stability studies of the optimized PVS-PLGA-NPs (F5) were performed. Finally, both hypolipidemic and hepatoprotective activities of the optimized F5 NPs were studied and compared to PVS solution.
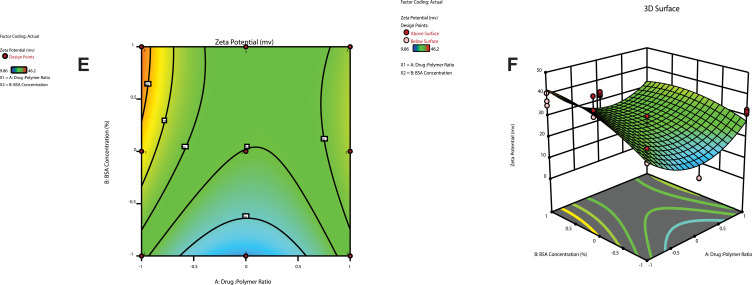
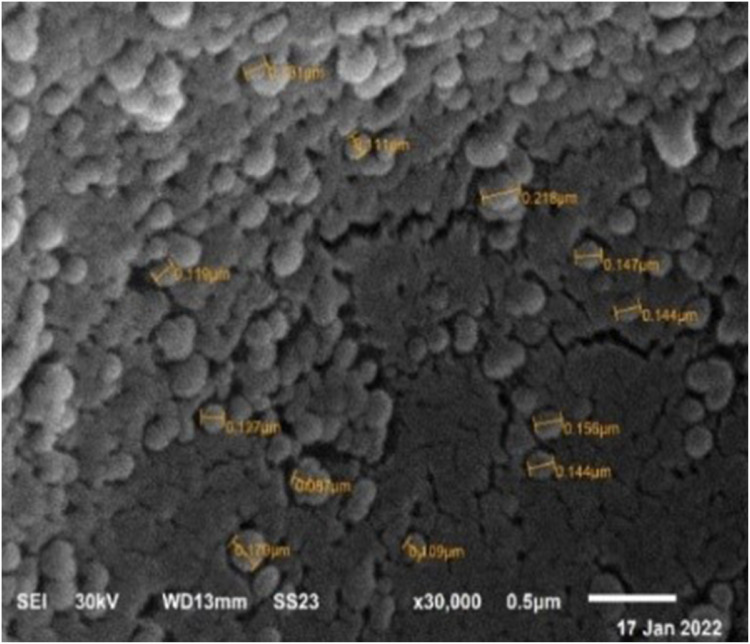
Results: All the studied physical parameters of the prepared NPs were found in the accepted range. The particle size (PS) ranged from 90 ± 0.125 nm to 179.33 ± 4.509 nm, the poly dispersity index (PDI) ranged from 0.121 ± 0.018 to 0.158 ± 0.014. The optimized NPs (F5) have the highest entrapment efficiency (EE%) (51.7 ± 5%), reasonable PS (168.4 ± 2.506 nm) as well as reasonable zeta potential (ZP) (-28.3 ± 1.18mv). Solid-state characterization indicated that PVS is well entrapped into NPs. All NPs have distinct spherical shape with smooth surface. The prepared NPs showed a controlled release profile. F5 showed good stability at 4 ± 2°C during the whole storage period of 3 months. In vivo study and histopathological examination indicated that F5 NPs showed significant increase in PVS hypolipidemic as well as hepatoprotective activity compared to PVS solution.
Conclusion: The PVS-PLGA-NPs could be considered a promising model to evade the first-pass effect and showed improvement in the hypolipidemic and hepatoprotective activities compared to PVS solution.
Keywords: PLGA; hypolipidemic and hepatoprotective activity; nanoparticles; pravastatin sodium.
© 2023 Elsayed et al.
Conflict of interest statement
The authors report no conflicts of interest in this work.
Figures


Similar articles
-
Brigatinib loaded poly(d,l-lactide-co-glycolide) nanoparticles for improved anti-tumoral activity against non-small cell lung cancer cell lines.Drug Dev Ind Pharm. 2021 Jul;47(7):1112-1120. doi: 10.1080/03639045.2021.1983585. Epub 2021 Oct 1. Drug Dev Ind Pharm. 2021. PMID: 34551665
-
Fabrication and statistical optimization of surface engineered PLGA nanoparticles for naso-brain delivery of ropinirole hydrochloride: in-vitro-ex-vivo studies.J Biomater Sci Polym Ed. 2013;24(15):1740-56. doi: 10.1080/09205063.2013.798880. Epub 2013 May 24. J Biomater Sci Polym Ed. 2013. PMID: 23705812
-
Preparation and characterization of surface-modified PLGA-polymeric nanoparticles used to target treatment of intestinal cancer.Artif Cells Nanomed Biotechnol. 2018 Mar;46(2):432-446. doi: 10.1080/21691401.2017.1324466. Epub 2017 May 14. Artif Cells Nanomed Biotechnol. 2018. Retraction in: Artif Cells Nanomed Biotechnol. 2020 Dec;48(1):1328. doi: 10.1080/21691401.2020.1842979. PMID: 28503995 Retracted.
-
In vitro degradation of poly (D, L-lactide-co-glycolide) nanoparticles loaded with linamarin.IET Nanobiotechnol. 2013 Jun;7(2):33-41. doi: 10.1049/iet-nbt.2012.0012. IET Nanobiotechnol. 2013. PMID: 24046903
-
Formulation optimization of etoposide loaded PLGA nanoparticles by double factorial design and their evaluation.Curr Drug Deliv. 2010 Jan;7(1):51-64. doi: 10.2174/156720110790396517. Curr Drug Deliv. 2010. PMID: 20044908 Review.
Cited by
-
A Novel Facile and Efficient Prophylaxis Avenue of Chitosan Oligosaccharide/PLGA Based Polydatin Loaded Nanoparticles Against Bleomycin-Induced Lung Inflammation in Experimental Rat Model.AAPS PharmSciTech. 2025 Jan 16;26(1):35. doi: 10.1208/s12249-024-03022-2. AAPS PharmSciTech. 2025. PMID: 39820828
-
Poly lactic-co-glycolic acid enhances the efficacy of the phytomedicine chrysin against cisplatin induced toxicity in submandibular salivary glands.Sci Rep. 2025 Mar 25;15(1):10262. doi: 10.1038/s41598-025-93112-3. Sci Rep. 2025. PMID: 40133531 Free PMC article.
-
Pharmacodynamic Studies of Pravastatin Sodium Nanoemulsion Loaded Transdermal Patch for Treatment of Hyperlipidemia.AAPS PharmSciTech. 2024 Feb 8;25(2):34. doi: 10.1208/s12249-024-02746-5. AAPS PharmSciTech. 2024. PMID: 38332233
-
Enhancing Therapeutic Efficacy against Brucella canis Infection in a Murine Model Using Rifampicin-Loaded PLGA Nanoparticles.ACS Omega. 2023 Dec 13;8(51):49362-49371. doi: 10.1021/acsomega.3c07892. eCollection 2023 Dec 26. ACS Omega. 2023. PMID: 38162745 Free PMC article.
-
PLGA/HA sustained-release system loaded with liraglutide for the treatment of diabetic periodontitis through inhibition of necroptosis.Mater Today Bio. 2025 Feb 15;31:101582. doi: 10.1016/j.mtbio.2025.101582. eCollection 2025 Apr. Mater Today Bio. 2025. PMID: 40051526 Free PMC article.
References
-
- Castañeda PS, Escobar-Chávez JJ, Vázquez JA, Cruz IMR, Contreras LMM. Pravastatin transdermal patches: effect of the formulation and two different lengths of microneedles on in-vitro percutaneous absorption studies. Iran J Pharm Res. 2020;19(2):127–133. doi:10.22037/ijpr.2019.1100914 - DOI - PMC - PubMed
-
- Campos‐Lara M, Pinto‐Almazán R, Oropeza MV, Mendoza‐Espinoza JA. Optimization of a pravastatin quantification method using HPLC with ultraviolet detection in human serum for monitoring dyslipidemic patients. J Liq Chromatogr. 2008;31(5):667–674. doi:10.1080/10826070701853784 - DOI
MeSH terms
Substances
LinkOut - more resources
Full Text Sources
Research Materials
Miscellaneous
