. 2023 Feb 15;10(2):220567.
doi: 10.1098/rsos.220567. eCollection 2023 Feb.

Luminance contrast provides metric depth information

Affiliations

Luminance contrast provides metric depth information

Paul B Hibbard et al. R Soc Open Sci. .

Abstract

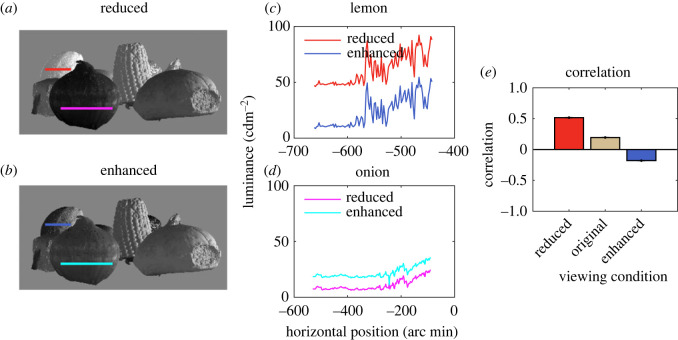
The perception of depth from retinal images depends on information from multiple visual cues. One potential depth cue is the statistical relationship between luminance and distance; darker points in a local region of an image tend to be farther away than brighter points. We establish that this statistical relationship acts as a quantitative cue to depth. We show that luminance variations affect depth in naturalistic scenes containing multiple cues to depth. This occurred when the correlation between variations of luminance and depth was manipulated within an object, but not between objects. This is consistent with the local nature of the statistical relationship in natural scenes. We also showed that perceived depth increases as contrast is increased, but only when the depth signalled by luminance and binocular disparity are consistent. Our results show that the negative correlation between luminance and distance, as found under diffuse lighting, provides a depth cue that is combined with depth from binocular disparity, in a way that is consistent with the simultaneous estimation of surface depth and reflectance variations. Adopting more complex lighting models such as ambient occlusion in computer rendering will thus contribute to the accuracy as well as the aesthetic appearance of three-dimensional graphics.

Keywords: binocular disparity; image statistics; shape from shading; stereopsis; vision.


Conflict of interest statement

We declare we have no competing interests.

Figures

Figure 1.
Figure 1.
(a) In traditional models of shape-from-shading, under the assumption of a directional light source, luminance depends on the orientation of the surface relative to the direction of the light source. (b) The resulting image has its brightest points where the surface is normal to the lighting direction and its darkest points where the surface normal is rotated furthest away from the lighting direction. In this image, pixel luminance is proportional to the cosine of the angle between the surface and the light source. (c) Under the assumption of diffuse lighting, luminance depends on the area of the light source to which a point is exposed. Light from some directions will be occluded from points that are in crevices in the surface, as shown on the left. (d) These more distant, occluded points will appear darker in the image, while the points that are locally the closest to the observer will appear brighter. This image was created using a Monte Carlo ambient occlusion model, in which pixel luminance is proportional to the area of the diffuse light source to which it is exposed.
Figure 2.
Figure 2.
(a) Set distance ratios for the global, between object condition. Observers tended to underestimate distance, but there was no effect of luminance manipulation or the presence of binocular depth cues. Scatterplots of the settings in the enhanced versus reduced condition are shown in (b) for monocular viewing and (c) for binocular viewing. (d) Scatterplot of distance settings in all conditions against the ground truth (legend: q monocular reduced, p monocular enhanced, ¢ binocular reduced, u binocular enhanced). Error bars represent ±1 standard deviation.
Figure 3.
Figure 3.
In the within-object condition, the luminance of individual pixels was made brighter or darker, depending on its distance relative to other points on the same object. (a) In the reduced condition, closer points were made darker and farther points brighter. (b) The opposite manipulation was made in the enhanced condition. (c) A horizontal sample through the images (shown by the lines in (a) and (b)) indicates luminance reducing as the surface gets closer to the observer in the reduced condition, and increasing in the enhanced condition. (d) Our original scene contained a negative correlation between the depth difference and luminance difference between pairs of pixels from the same object. The size of this correlation was increased in our enhanced condition, and decreased in our reduced condition.
Figure 4.
Figure 4.
In the between-object condition, the manipulation of luminance was based on the distances of all points in an object considered together, to create (a) reduced and (b) enhanced conditions. (c) shows a luminance sample in the reduced and enhanced condition for a far object (the lemon) and (d) shows samples for a close object (the onion). In the reduced condition, the far object is made brighter and the close object darker in comparison with the enhanced condition. (e)There was a positive correlation between the mean luminance and distance of objects. This positive correlation increased in our reduced condition, and was negative in our enhanced condition.
Figure 5.
Figure 5.
(a) Mean ratio of set distance to actual three-dimensional distance for the local, within-object condition. Settings were larger in the enhanced condition with monocular depth cues, but not with binocular depth cues. Settings were smaller, and more accurate when binocular depth cues are available. Scatterplots of the settings in the enhanced versus reduced condition are shown in (b) for monocular viewing and (c) for binocular viewing. (d) Scatterplot of distance settings in all conditions against the ground truth (legend: q monocular reduced, p monocular enhanced, ¢ binocular reduced, u binocular enhanced). Although in this plot the data cluster around the identity line, there is a significant change that is difficult to discern given the range of distance settings and the generally good performance on the task. This plot is included to demonstrate the additive nature of the effects of changing the luminance/depth relationship, and the effect of the other depth cues contained in the stimuli. Error bars represent ±1 standard deviation.
Figure 6.
Figure 6.
(a) The second experiment used random dot stereograms in which the luminance of the dots, as well as their binocular disparity, was varied. Luminance and disparity were either (b) consistent, so that nearer points were brighter or (c) inconsistent. The observers' task was to set the length of the horizontal line to match the apparent distance in depth between the nearest and furthest point on the surface.
Figure 7.
Figure 7.
Predicted and measured depth in the second experiment as a function of disparity (top row) and contrast (bottom row). Data are plotted separately for cases in which the sign of depth is consistent or inconsistent. The lefthand column shows predictions for the mandatory-combination model (equation (1.1)). Since the exact predictions will depend on the weights used, they are plotted in arbitrary depth units. In all cases, data show the total effect of each cue (disparity or contrast) averaged across all other values of the other cue, which had a mean value of zero across all stimuli (a) Depth is predicted to increase with disparity, and to be greater when cues are consistent (and add) than when they are inconsistent (and subtract). The deviation from linearity shown for inconsistent cues for small values reflects the change in sign of depth (relative to that predicted by disparity) and the calculation of absolute depth (which is what the participants reported). (b) In this model, depth is predicted to increase with increasing contrast when the cues are consistent but to decrease with increasing contrast when the cues are inconsistent. The middle column shows the predictions for the consistency-dependent combination model (equation (1.2)). (c) Estimated depth is again predicted to increase with disparity, and to be greater for consistent cues. (d) When the cues are consistent, depth is predicted to increase with increasing contrast. When they are inconsistent, depth is not affected by changes in contrast. (e) Psychophysical results show that depth increases with disparity for both consistent and inconsistent stimuli. (f) For consistent stimuli, perceived depth increases with contrast. For inconsistent stimuli, perceived depth is unaffected by contrast. These results are predicted by the consistency-dependent combination model, but not the mandatory-combination model. Symbols show the mean results across participants and conditions, and error bars show ±1 standard deviation.

References

    1. Cutting JE, Vishton PM. 1995. Perceiving layout and knowing distances: The integration, relative potency, and contextual use of different information about depth. In Perception of Space and Motion, pp. 69-117.
    1. Todd JT. 2020. On the ambient optic array: James Gibson's insights about the phenomenon of chiaroscuro. i-Perception 11, 2041669520952097. - PMC - PubMed
    1. Horn BKP, Brooks MJ. 1989. Shape from Shading. Cambridge, MA: MIT Press.
    1. Ramachandran VS. 1988. Perception of shape from shading. Nature 331, 163-166. (10.1038/331163a0) - DOI - PubMed
    1. Mamassian P, Goutcher R. 2001. Prior knowledge on the illumination position. Cognition 81, B1-B9. (10.1016/S0010-0277(01)00116-0) - DOI - PubMed

LinkOut - more resources