. 2023 Feb 3:16:1023665.
doi: 10.3389/fnins.2022.1023665. eCollection 2022.

Integration of structural MRI and epigenetic analyses hint at linked cellular defects of the subventricular zone and insular cortex in autism: Findings from a case study

Affiliations

Integration of structural MRI and epigenetic analyses hint at linked cellular defects of the subventricular zone and insular cortex in autism: Findings from a case study

Emi Takahashi et al. Front Neurosci. .

Abstract

Introduction: Autism Spectrum Disorder (ASD) is a neurodevelopmental disorder characterized by deficits in social interaction, communication and repetitive, restrictive behaviors, features supported by cortical activity. Given the importance of the subventricular zone (SVZ) of the lateral ventrical to cortical development, we compared molecular, cellular, and structural differences in the SVZ and linked cortical regions in specimens of ASD cases and sex and age-matched unaffected brain.

Methods: We used magnetic resonance imaging (MRI) and diffusion tractography on ex vivo postmortem brain samples, which we further analyzed by Whole Genome Bisulfite Sequencing (WGBS), Flow Cytometry, and RT qPCR.

Results: Through MRI, we observed decreased tractography pathways from the dorsal SVZ, increased pathways from the posterior ventral SVZ to the insular cortex, and variable cortical thickness within the insular cortex in ASD diagnosed case relative to unaffected controls. Long-range tractography pathways from and to the insula were also reduced in the ASD case. FACS-based cell sorting revealed an increased population of proliferating cells in the SVZ of ASD case relative to the unaffected control. Targeted qPCR assays of SVZ tissue demonstrated significantly reduced expression levels of genes involved in differentiation and migration of neurons in ASD relative to the control counterpart. Finally, using genome-wide DNA methylation analyses, we identified 19 genes relevant to neurological development, function, and disease, 7 of which have not previously been described in ASD, that were significantly differentially methylated in autistic SVZ and insula specimens.

Conclusion: These findings suggest a hypothesis that epigenetic changes during neurodevelopment alter the trajectory of proliferation, migration, and differentiation in the SVZ, impacting cortical structure and function and resulting in ASD phenotypes.

Keywords: DNA methylation; MRI; SVZ; autism; cortex; epigenetic.


Conflict of interest statement

The authors declare that the research was conducted in the absence of any commercial or financial relationships that could be construed as a potential conflict of interest.

Figures

FIGURE 1
FIGURE 1
At the level of the insula/thalamus, longer tractography pathways are decreased and shorter pathways are increased in ASD. (A) Overall tractography pathways in right hemisphere of Control (#6032; 4 years and 51 days old). (B) Overall tractography pathways in right hemisphere of a brain diagnosed with ASD (#5308; 4 years and 183 days old). (C) Tractography pathways from/to the insula at level of insula/thalamus in control. (D) Tractography pathways from/to the insula at level of insula/thalamus in ASD. (E) Long tractography pathways (>16 mm) from/to the insula of control. (F) Long tractography pathways (>16 mm) from/to the insula of ASD. (G) Short tractography pathways (<8 mm) within the insula/thalamus of control. (H) Short tractography pathways (<8 mm) within the insula/thalamus of ASD.
FIGURE 2
FIGURE 2
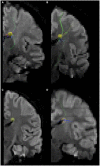
Tractography pathways associated with the dorsal SVZ are more sparse and fewer in ASD compared to control in vivo. Tractography pathways associated with the dorsal SVZ in (A,B) 16YO male controls and (C,D) 16YO male patients diagnosed with ASD. We examined in vivo diffusion tractography in coronal slabs at the level of the insula and thalamus. Yellow spheres (4 mm radius) in each brain image were created in the dorsal SVZ as regions of interest (ROIs) to detect pathways from/to the ROIs.
FIGURE 3
FIGURE 3
Tractography pathways associated with the dorsal SVZ are more sparse and fewer in ASD compared to control ex vivo. Tractography pathways associated with the dorsal SVZ in (A–C) control 6032; 4 years and 51 days old; (D–F) ASD #M4021M; 3 years 114 days old; (G–I) Control #5282; 2 years 308 days old; and (J–L) ASD #5308; 4 years 183 days old. Yellow spheres (4 mm radius) in each brain image were created in the dorsal SVZ as regions of interest (ROIs) to detect pathways from/to the ROIs. Tractography pathways without the ROIs are shown in (C,F,I,L). Brain images (A,D) were previously published (Wilkinson et al., 2016).
FIGURE 4
FIGURE 4
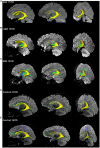
Pathways between the posterior SVZ and the insula were absent or fewer in controls compared to ASD patients. Tractography pathways from the entire SVZ (yellow) in patients with ASD and control at three different slices. (A) 15-year-old with ASD; (B) 15-year-old with ASD; (C) 16-year-old with ASD; (D) 16-year-old control; (E) 16-year-old control. Images from each patient are shown at mid-sagittal slices (left column), lateral sagittal slices at the level of the insula (middle column), and posterior oblique views with mid-sagittal slices and coronal slices at the level of the insula (right column) are shown. Pathways between the posterior SVZ and the insula were absent or fewer in controls compared to ASD patients.
FIGURE 5
FIGURE 5
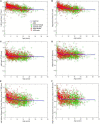
Cortical thickness variability of several regions of the insula were found to be elevated in ASD. The mean cortical thickness of the (A) left and (B) right insula. Standard deviation of the cortical thicknesses of the (C) left and (D) right insula. Standard deviation of the thicknesses of the (E) left and (F) right inferior segment of the circular sulcus of the insula across all ages available (Levman et al., 2019).
FIGURE 6
FIGURE 6
Venn diagram of genes associated with neurological disease, developmental disorder, and nervous system development and function found to be altered in ASD according to IPA analysis. A total of 19 genes were found to overlap all three groups.
FIGURE 7
FIGURE 7
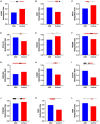
Genes altered in ASD samples according to IPA that overlap with neurological disease, developmental disorder, and nervous system function and development. Methylation levels were compared between ASD and Control insular cortex samples for genes (A) AXIN2, (B) BIN1, (C) HRH2, (D) KCNJ10, (E) MEF2C, (F) miR-206, (G) miR-146b, (H) S100B, (I) SOX10, (J) TYROBP, (K) MAG, and (L) MBP. Diagrams above each bar graph show a linear depiction of the associated gene from 5′ to 3′ with the methylation site highlighted in red (1099 bp). Diagrams are not to scale. Reference genome RGCh38/hg38.
FIGURE 8
FIGURE 8
Cell sorting by flow cytometry indicates a higher ratio of proliferating cells in postmortem SVZ tissue of ASD sample. (A) Fluorescence Activated Cell Sorting (FACS) of nuclei from in postmortem SVZ brain tissue of control (male, 42 years old) and (B) ASD (male, 43 years old) patients’ samples. Nuclei were purified by sucrose gradient and stained with Alexa488NeuN antibody and DAPI. Gates indicated as I select nuclei from mature neurons (Alexa488NeuN+DAPI+) and II select nuclei from glial cells (Alexa488NeuN-DAPI+), nuclei from these gates were sorted for expression analysis. Gate labeled as III select 2X DAPI+ Alexa488NeuN- glial dividing cells. (C) ASD/Control ratio of nuclei from the three cell types. (D) qPCR expression analysis of cell stage gene markers in postmortem SVZ brain tissue of control (male, 42 years old) and ASD (male, 43 years old) patients’ samples *p < 0.05.
FIGURE 9
FIGURE 9
Gene expression pattern in SVZ of ASD and control patients’ samples demonstrates divergent populations of cell stages. (A) SVZ cell types and specific cell stage gene markers. (B) qPCR expression analysis of cell stage gene markers from the same postmortem SVZ brain tissue samples as in Figure 8. (C) qPCR expression analysis of cell stage gene markers in sorted nuclei from Figure 8.
FIGURE 10
FIGURE 10
Proposed general model of cortex development in ASD. Adapted from “Distribution of Histamine and Serotonin Neurotransmitters in the Human Brain” by BioRender.com (2022). Retrieved from https://app.biorender.com/biorender-templates.

References

    1. Abdel Razek A., Mazroa J., Baz H. (2014). Assessment of white matter integrity of autistic preschool children with diffusion weighted MR imaging. Brain Dev. 36 28–34. 10.1016/j.braindev.2013.01.003 - DOI - PubMed
    1. American Psychiatric Association (2013). Diagnostic and statistical manual of mental disorders: DSM-5, 5th Edn. Arlington, VA: American Psychiatric Association.
    1. Anteraper S. A., Guell X., Hollinshead M. O., D’Mello A., Whitfield-Gabrieli S., Biederman J., et al. (2020). Functional alterations associated with structural abnormalities in adults with high-functioning autism spectrum disorder. Brain Connect. 10 368–376. 10.1089/brain.2020.0746 - DOI - PubMed
    1. Bailey A., Le Couteur A., Gottesman I., Bolton P., Simonoff E., Yuzda E., et al. (1995). Autism as a strongly genetic disorder: Evidence from a British twin study. Psychol. Med. 25 63–77. 10.1017/s0033291700028099 - DOI - PubMed
    1. Balaan C., Corley M. J., Eulalio T., Leite-Ahyo K., Pang A. P. S., Fang R., et al. (2019). Juvenile Shank3b deficient mice present with behavioral phenotype relevant to autism spectrum disorder. Behav. Brain Res. 356 137–147. 10.1016/j.bbr.2018.08.005 - DOI - PMC - PubMed

LinkOut - more resources