. 2023 Feb 1:14:1111797.
doi: 10.3389/fimmu.2023.1111797. eCollection 2023.

Different cytokine and chemokine profiles in hospitalized patients with COVID-19 during the first and second outbreaks from Argentina show no association with clinical comorbidities

Affiliations

Different cytokine and chemokine profiles in hospitalized patients with COVID-19 during the first and second outbreaks from Argentina show no association with clinical comorbidities

Laura Almada et al. Front Immunol. .

Abstract

Background: COVID-19 severity has been linked to an increased production of inflammatory mediators called "cytokine storm". Available data is mainly restricted to the first international outbreak and reports highly variable results. This study compares demographic and clinical features of patients with COVID-19 from Córdoba, Argentina, during the first two waves of the pandemic and analyzes association between comorbidities and disease outcome with the "cytokine storm", offering added value to the field.

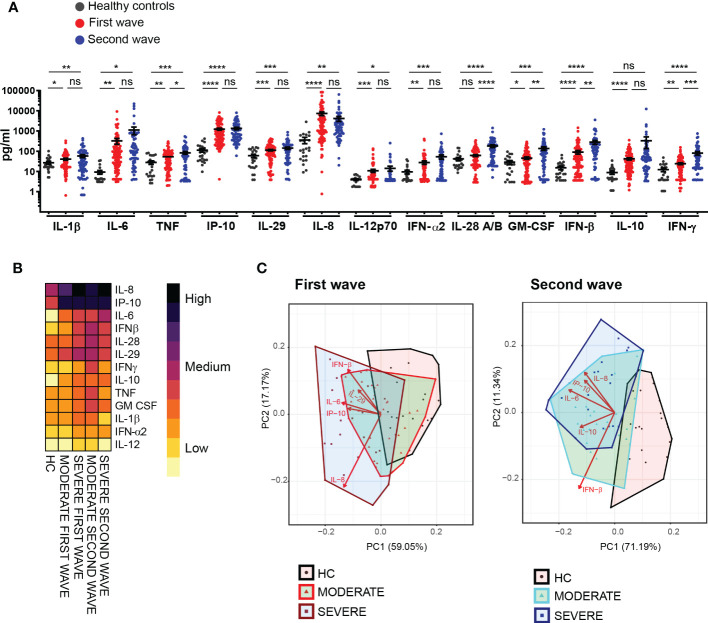
Methods: We investigated serum concentration of thirteen soluble mediators, including cytokines and chemokines, in hospitalized patients with moderate and severe COVID-19, without previous rheumatic and autoimmune diseases, from the central region of Argentina during the first and second infection waves. Samples from healthy controls were also assayed. Clinical and biochemical parameters were collected.

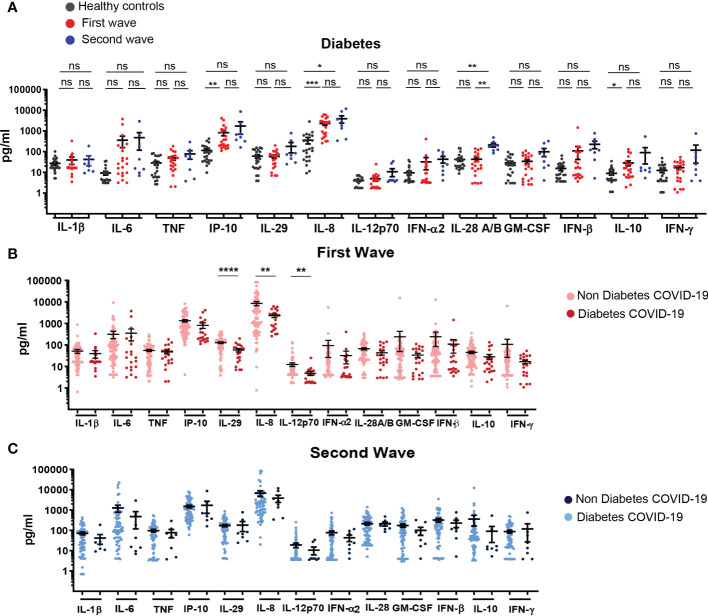
Results: Comparison between the two first COVID-19 waves in Argentina highlighted that patients recruited during the second wave were younger and showed less concurrent comorbidities than those from the first outbreak. We also recognized particularities in the signatures of systemic cytokines and chemokines in patients from both infection waves. We determined that concurrent pre-existing comorbidities did not have contribution to serum concentration of systemic cytokines and chemokines in COVID-19 patients. We also identified immunological and biochemical parameters associated to inflammation which can be used as prognostic markers. Thus, IL-6 concentration, C reactive protein level and platelet count allowed to discriminate between death and discharge in patients hospitalized with severe COVID-19 only during the first but not the second wave.

Conclusions: Our data provide information that deepens our understanding of COVID-19 pathogenesis linking demographic features of a COVID-19 cohort with cytokines and chemokines systemic concentration, presence of comorbidities and different disease outcomes. Altogether, our findings provide information not only at local level by delineating inflammatory/anti-inflammatory response of patients but also at international level addressing the impact of comorbidities and the infection wave in the variability of cytokine and chemokine production upon SARS-CoV-2 infection.

Keywords: COVID-19; SARS-CoV-2; comorbidities; cytokine storm; first infection wave; hypertension; mortality; second infection wave.


Conflict of interest statement

The authors declare that the research was conducted in the absence of any commercial or financial relationships that could be construed as a potential conflict of interest.

Figures

Figure 1
Figure 1
Demographic and clinical characteristic of hospitalized COVID-19 patients from the first and the second waves in Argentina. (A) Number of patients distributed by age range during the first (red, n=62) or second waves (blue, n=56). (B) Gender distribution of patients from the first and second waves stratified according to clinical disease severity in moderate and severe. (C) Frequency of occurrence of death (mortality) by gender of patients from the first and second waves stratified according to clinical disease severity in moderate and severe. (D) Frequency of comorbidities in patients during the first (left upper chart) and second (left lower chart) waves, pie charts on the right show frequency of concurrent comorbidities in patients from each wave of infection.
Figure 2
Figure 2
Different intensity in the signatures of systemic cytokines and chemokines in patients recruited during the first and second waves of COVID-19. (A) Serum concentration of 13 cytokines/chemokines quantified by LEGENDplexTM in samples from healthy controls (HC) (black, n=24) and from COVID-19 patients from the first (red, n=102) and the second wave (blue, n=66). Dots show individual measurements and black line show mean concentration of each analyte ± SEM. Unpaired t test with Welch’s correction was used for statistical analysis. ****P < 0.0001, ***P < 0.001, **P < 0.01 and *P < 0.05; ns: not significant. (B) Heat map depicting average concentration of serum cytokines/chemokines in HC and patients from the first and the second waves stratified as moderate and severe according to clinical disease severity. (C) PCA biplots average cytokines/chemokines systemic concentration from HC and patients from the first (left plot) and the second (right plot) waves stratified as moderate and severe according to clinical disease severity.
Figure 3
Figure 3
Profile of systemic cytokines and chemokines in hospitalized COVID-19 patients with arterial hypertension recruited during the first and second waves. (A) Serum concentration of cytokines/chemokines quantified in samples from HC (black, n=24) and COVID-19 patients with arterial hypertension recruited during the first (red, n=55) and second (blue, n=29) waves. (B) Serum concentration of cytokines/chemokines determined in samples of COVID-19 patients without (light pink, n=47) or with (dark pink, n=55) arterial hypertension of first wave. (C) Serum concentration of cytokines/chemokines determined in samples of COVID-19 patients without (light blue, n=37) or with (dark blue, n=29) arterial hypertension of the second wave. The scatter plots in (A-C) show individual measurements (dots) and the concentration mean of each analyte as black line ± SEM. For statistical analyses Unpaired t test with Welch’s correction was used (****P < 0.0001, ***P < 0.001, **P < 0.01 and *P < 0.05; ns: not significant).
Figure 4
Figure 4
Profile of systemic cytokines and chemokines in hospitalized COVID-19 patients with diabetes recruited during the first and second infection waves. (A) Serum concentration of cytokines/chemokines quantified in samples from HC (black, n=24) and COVID-19 patients with diabetes recruited during the first (red, n=23) and second (blue, n=8) waves (B) Serum concentration of cytokines/chemokines in samples of COVID-19 patients without (light pink, n=81) or with (dark pink, n=21) diabetes recruited during the first wave. (C) Serum concentration of cytokines/chemokines determined in samples of COVID-19 patients without (light blue, n=58) or with (dark blue, n=8) diabetes recruited during the second wave. The scatter plots in (A-C) show individual measurements (dots) and the concentration mean of each analyte as black line ± SEM. For statistical analyses Unpaired t test with Welch’s correction was used (****P < 0.0001, ***P < 0.001, **P < 0.01 and *P < 0.05; ns: not significant).
Figure 5
Figure 5
Profile of systemic cytokines and chemokines expression in in hospitalized COVID-19 patients with obesity recruited during the first and second infection waves. (A) Serum concentration of cytokines/chemokines in samples from HC (black, n=24) and hospitalized COVID-19 patients with obesity recruited during the first (red, n=32) and second waves (blue, n=14). (B) Serum concentration of cytokines/chemokines in samples of COVID-19 patients without (light pink, n=70) or with (dark pink, n= 32) obesity recruited during the first wave of infection. (C) Serum concentration of cytokines/chemokines in samples of COVID-19 patients without (light blue, n=52) or with (dark blue, n=14) obesity during the second wave. The scatter plots in (A-C) show individual measurements (dots) and the concentration mean of each analyte as black line ± SEM. For statistical analyses Unpaired t test with Welch’s correction was used (***P < 0.001, **P < 0.01 and *P < 0.05; ns: not significant).
Figure 6
Figure 6
Impact of the number of comorbidities in the serum levels of cytokines and chemokines in hospitalized COVID-19 patients recruited during the first and second infection waves. (A–F) Serum concentration of IL-6 (A), IP-10 (B), IL-8 (C), IL-10 (D), IFN-β (E) and IFN-γ (F) in HC and COVID-19 patients without comorbidities (0, x symbol) and with one (1, ⚬ symbol) or two or more than two (>=2, ● symbol) concurrent comorbidities recruited during the first (red symbols) and the second (blue symbols) waves. The scatter plots in (A-F) show individual measurements (dots) and the concentration mean of each analyte as black line ± SEM. For statistical analyses Unpaired t test with Welch’s correction was used (****P < 0.0001, ***P < 0.001,**P < 0.01 and *P < 0.05; ns: not significant).
Figure 7
Figure 7
Differences in cytokine and chemokine concentration in hospitalized patients with severe COVID-19 that had different clinical outcome. (A, B) Serum concentration of IL-6, IL-8, IL-10 and IP-10 (A) and IFN-α2 and IFN-β (B) determined in samples from HC (gray) and from discharged and deceased severe COVID-19 patients recruited during first (red) and second (blue) waves. Scatter plots show the individual measurements (dots) and black line show the concentration mean of each analyte. For statistical analyses Unpaired t test with Welch’s correction was used (***P < 0.001, **P < 0.01 and *P < 0.05; ns, not significant). (C, D) ROC curve of serum IL-6 (C) and IFN-α2 (D) concentrations in deceased versus discharged severe COVID-19 patients from the first (blue lines) and the second (red lines) waves. Values of AUC for each wave are shown with the corresponding color code.

References

    1. Zhu N, Zhang D, Wang W, Li X, Yang B, Song J, et al. A novel coronavirus from patients with pneumonia in China, 2019. N Engl J Med (2020) 382:727–33. doi: 10.1056/NEJMoa2001017 - DOI - PMC - PubMed
    1. Johns Hopkins Coronavirus Resource Center . Available at: https://coronavirus.jhu.edu/.
    1. Wang D, Hu B, Hu C, Zhu F, Liu X, Zhang J, et al. Clinical characteristics of 138 hospitalized patients with 2019 novel coronavirus–infected pneumonia in wuhan, China. JAMA. (2020) 323:1061–9. doi: 10.1001/jama.2020.1585 - DOI - PMC - PubMed
    1. Lucas C, Wong P, Klein J, Castro TBR, Silva J, Sundaram M, et al. Longitudinal analyses reveal immunological misfiring in severe COVID-19. Nature (2020) 584:463–9. doi: 10.1038/s41586-020-2588-y - DOI - PMC - PubMed
    1. Zhou F, Yu T, Du R, Fan G, Liu Y, Liu Z, et al. Clinical course and risk factors for mortality of adult inpatients with COVID-19 in wuhan, China: a retrospective cohort study. Lancet. (2020) 395:1054–62. doi: 10.1016/S0140-6736(20)30566-3 - DOI - PMC - PubMed

Publication types