. 2023 Feb 2:14:1028404.
doi: 10.3389/fimmu.2023.1028404. eCollection 2023.

Identification of immune related gene signature for predicting prognosis of cholangiocarcinoma patients

Affiliations

Identification of immune related gene signature for predicting prognosis of cholangiocarcinoma patients

Zi-Jian Zhang et al. Front Immunol. .

Abstract

Objective: To identify the gene subtypes related to immune cells of cholangiocarcinoma and construct an immune score model to predict the immunotherapy efficacy and prognosis for cholangiocarcinoma.

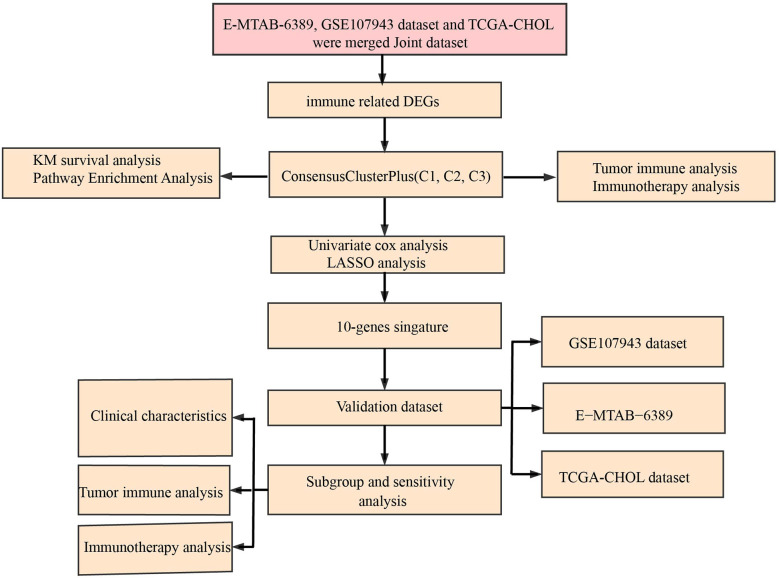
Methods: Based on principal component analysis (PCA) algorithm, The Cancer Genome Atlas (TCGA)-cholangiocarcinoma, GSE107943 and E-MTAB-6389 datasets were combined as Joint data. Immune genes were downloaded from ImmPort. Univariate Cox survival analysis filtered prognostically associated immune genes, which would identify immune-related subtypes of cholangiocarcinoma. Least absolute shrinkage and selection operator (LASSO) further screened immune genes with prognosis values, and tumor immune score was calculated for patients with cholangiocarcinoma after the combination of the three datasets. Kaplan-Meier curve analysis determined the optimal cut-off value, which was applied for dividing cholangiocarcinoma patients into low and high immune score group. To explore the differences in tumor microenvironment and immunotherapy between immune cell-related subtypes and immune score groups of cholangiocarcinoma.

Results: 34 prognostic immune genes and three immunocell-related subtypes with statistically significant prognosis (IC1, IC2 and IC3) were identified. Among them, IC1 and IC3 showed higher immune cell infiltration, and IC3 may be more suitable for immunotherapy and chemotherapy. 10 immune genes with prognostic significance were screened by LASSO regression analysis, and a tumor immune score model was constructed. Kaplan-Meier (KM) and receiver operating characteristic (ROC) analysis showed that RiskScore had excellent prognostic prediction ability. Immunohistochemical analysis showed that 6 gene (NLRX1, AKT1, CSRP1, LEP, MUC4 and SEMA4B) of 10 genes were abnormal expressions between cancer and paracancer tissue. Immune cells infiltration in high immune score group was generally increased, and it was more suitable for chemotherapy. In GSE112366-Crohn's disease dataset, 6 of 10 immune genes had expression differences between Crohn's disease and healthy control. The area under ROC obtained 0.671 based on 10-immune gene signature. Moreover, the model had a sound performance in Crohn's disease.

Conclusion: The prediction of tumor immune score model in predicting immune microenvironment, immunotherapy and chemotherapy in patients with cholangiocarcinoma has shown its potential for indicating the effect of immunotherapy on patients with cholangiocarcinoma.

Keywords: RiskScore; cholangiocarcinoma; immune; immunotherapy; molecular subtype.


Conflict of interest statement

The authors declare that the research was conducted in the absence of any commercial or financial relationships that could be construed as a potential conflict of interest.

Figures

Figure 1
Figure 1
Working flow chart.
Figure 2
Figure 2
Principal component analysis. (A) PCA analysis before removal of batch effects. (B) PCA analysis after removal of batch effects.
Figure 3
Figure 3
Identification of molecular subtypes. (A) Forest map of immune genes with significant prognosis analysed by univariate Cox regression. (B) Pearson correlation analysis of immune genes associated with prognosis. (C) Cumulative distribution function. (D) Delta area of Cumulative distribution function. (E) Clustering heatmap of samples in Joint data when k=3. (F) KM prognosis curve of 3 molecular subtypes. (G) Heatmap of immune genes associated with prognosis in 3 molecular subtypes.
Figure 4
Figure 4
Immune characteristics of 3 molecular subtypes. (A) 28 immune cells scores differences of 3 molecular subtypes determined by ssGSEA. (B) 10 immune cells scores differences of 3 molecular subtypes determined by MCP-Counter. (C) StromalScore difference of 3 molecular subtypes determined by ESTIMATE. (D) ImmuneScore difference of 3 molecular subtypes determined by ESTIMATE. (E) ESTIMATEScore difference of 3 molecular subtypes determined by ESTIMATE. * p<0.05, ** p<0.01, *** p<0.001, **** p<0.0001, ns, no sense.
Figure 5
Figure 5
Immunotherapy analysis. (A) The expression levels of 20 immune checkpoint genes in 3 molecular subtypes. (B) TIDE analysis in 3 molecular subtypes. (C) The box plots of the estimated IC50 for Cisplatin, Sunitinib, Sorafenib, Imatinib, Crizotinib and AKT inhibitor VIII in 3 molecular subtypes. * p<0.05, ** p<0.01, *** p<0.001, **** p<0.0001, ns, no sense.
Figure 6
Figure 6
Identification of hub immune genes. (A) A total of promising immune genes candidates were identified through Lasso Cox regression. (B) The trajectory of each independent variable as lambda changes. (C) Confidence intervals under lambda. (D) Distribution of LASSO coefficients of the immune prognostic gene signature.
Figure 7
Figure 7
Validation of immune genes signature. (A) The KM curve and ROC analysis of RiskScore in Joint data. (B) The KM curve and ROC analysis of RiskScore in E−MTAB−6389 dataset. (C) The KM curve and ROC analysis of RiskScore in TCGA dataset. (D) The KM curve and ROC analysis of RiskScore in GSE107943 dataset.
Figure 8
Figure 8
The analysis 6 genes using immunohistochemistry and KM survival curve. (A-F) the expression dysregulations of NLRX1, AKT1, CSRP1, LEP, MUC4 and SEMA4B in cancer tissues by immunohistochemistry. (G-L) Survival was better in patients with high NLRX1 expression and low SEMA4B expression compared with those with low NLRX1 expression and high SEMA4B expression. (M) 6 genes had difference expressions between cancer tissue and para-carcinoma.
Figure 9
Figure 9
Immune characteristics and Functional enrichment analysis. (A) 28 immune cells scores differences between high group and low group determined by ssGSEA. (B) the correlation analysis between RiskScore and 28 immune cells scores. * p<0.05, ** p<0.01, *** p<0.001, **** p<0.0001, ns, no sense.
Figure 10
Figure 10
Correlation analysis between KEGG pathway and RiskScore with correlation greater than 0.2 in Joint data. * p<0.05, ** p<0.01, *** p<0.001.
Figure 11
Figure 11
Immunotherapy analysis. (A) The expression levels of 20 immune checkpoint genes in high group and low group. (B) TIDE analysis in high group and low group. (C) The box plots of the estimated IC50 for Cisplatin, Sunitinib, Sorafenib, Imatinib, Crizotinib and AKT inhibitor VIII in high group and low group. * p<0.05, ** p<0.01, *** p<0.001, **** p<0.0001, ns, no sense.
Figure 12
Figure 12
Performance examination of RiskScore in Crohn’s disease. (A) Volcano Plot of differentially expressed genes in GSE112366 dataset. (B) Boxplot of differentially expressed genes between Crohn’s disease and healthy samples in GSE112366 dataset. (C) RiskScore difference of between Crohn’s disease and healthy samples in GSE112366 dataset. (D) ROC curve of RiskScore in dataset GSE112366 dataset. * p<0.05, ** p<0.01, *** p<0.001, **** p<0.0001, ns, no sense.

References

    1. Chong DQ, Zhu AX. The landscape of targeted therapies for cholangiocarcinoma: Current status and emerging targets. Oncotarget (2016) 7(29):46750–67. doi: 10.18632/oncotarget.8775 - DOI - PMC - PubMed
    1. Massironi S, Pilla L, Elvevi A, Longarini R, Rossi RE, Bidoli P, et al. . New and emerging systemic therapeutic options for advanced cholangiocarcinoma. Cells (2020) 9(3):688. doi: 10.3390/cells9030688 - DOI - PMC - PubMed
    1. Bridgewater JA, Goodman KA, Kalyan A, Mulcahy MF. Biliary tract cancer: Epidemiology, radiotherapy, and molecular profiling. Am Soc Clin Oncol Educ book Am Soc Clin Oncol Annu Meeting (2016) 35:e194–203. doi: 10.1200/EDBK_160831 - DOI - PubMed
    1. Bertuccio P, Malvezzi M, Carioli G, Hashim D, Boffetta P, El-Serag HB, et al. . Global trends in mortality from intrahepatic and extrahepatic cholangiocarcinoma. J Hepatol (2019) 71(1):104–14. doi: 10.1016/j.jhep.2019.03.013 - DOI - PubMed
    1. Khan SA, Genus T, Morement H, Murphy A, Rous B, Tataru D. Global trends in mortality from intrahepatic and extrahepatic cholangiocarcinoma. J Hepatol (2019) 71(6):1261–2. doi: 10.1016/j.jhep.2019.07.024 - DOI - PubMed

Publication types

Substances