. 2023 Feb 1:14:1131256.
doi: 10.3389/fendo.2023.1131256. eCollection 2023.

Integration of parallel metabolomics and transcriptomics reveals metabolic patterns in porcine oocytes during maturation

Affiliations

Integration of parallel metabolomics and transcriptomics reveals metabolic patterns in porcine oocytes during maturation

Ming Gao et al. Front Endocrinol (Lausanne). .

Abstract

Well-controlled metabolism is the prerequisite for optimal oocyte development. To date, numerous studies have focused mainly on the utilization of exogenous substrates by oocytes, whereas the underlying mechanism of intrinsic regulation during meiotic maturation is less characterized. Herein, we performed an integrated analysis of parallel metabolomics and transcriptomics by isolating porcine oocytes at three time points, cooperatively depicting the global picture of the metabolic patterns during maturation. In particular, we identified the novel metabolic features during porcine oocyte meiosis, such as the fall in bile acids, the active one-carbon metabolism and a progressive decline in nucleotide metabolism. Collectively, the current study not only provides a comprehensive multiple omics data resource, but also may facilitate the discovery of molecular biomarkers that could be used to predict and improve oocyte quality.

Keywords: energy metabolism; metabolomics; oocyte; reproduction; transcriptomics.


Conflict of interest statement

The authors declare that the research was conducted in the absence of any commercial or financial relationships that could be construed as a potential conflict of interest.

Figures

Figure 1
Figure 1
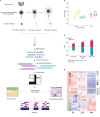
Metabolomic profiling of porcine oocyte maturation. (A) Collection of porcine oocytes cultured in vitro at key time points (0h, 22h, 46h). (B) Workflow for UPLC/MS-based metabolome profiling on porcine oocytes. (C–E) : OPLS-DA score plot for metabolomic datasets clearly distinguished oocyte samples from three time points. (F) Heatmap visualizing relative abundance of differential metabolites during porcine oocyte maturation, classified by metabolic pathway. (G) Z-score plots of 20 representative differential metabolites in oocytes in vitro cultured for 0h and 22h (meiotic resumption). (H) Z-score plots of 20 representative differential metabolites in oocytes in vitro cultured for 0 and 46h (meiotic maturation). Each color represents one phase, and each point represents one metabolite in one sample. The complete metabolomic data are available in Supplementary Table 1 .
Figure 2
Figure 2
Transcriptomic profiling of porcine oocyte maturation. (A) Schematic overview of the workflow for transcriptome profiling in oocytes. (B) PCA plot for transcriptomic datasets separating 0h, 22h, and 46h oocyte samples. (C) Bar chart showing the up-regulated and down-regulated DEGs. (D) Heat map of hierarchical clustering of 2,686 differentially expressed genes from porcine oocytes cultured in vitro at key time points.
Figure 3
Figure 3
Reduced fatty acid beta oxidation during meiotic resumption. (A–C) Relative levels of metabolites related to fatty acid oxidation in oocytes at three time points. (D) Schematic diagram of carnitine shuttle system and utilization of fatty acid during porcine oocyte maturation, derived from metabolomics and transcriptomics. Metabolites decreased in oocytes during meiotic resumption are indicated by bold blue arrows. Differential expression genes decreased are indicated by blue triangles (E) Dynamic changes in the relative level of CPTIB during meiotic maturation. Error bars, SD. Student’s t test was used for statistical analysis in all panels, comparing to GV. n.s., not significant.
Figure 4
Figure 4
Enhanced catabolism of arginine and proline during meiotic resumption.(A–H) Relative levels of metabolites involved in arginine and proline metabolism in oocytes at three time points. (I) Schematic diagram of arginine and proline metabolism during meiotic resumption, based on metabolomics and transcriptomics. The red and blue arrows denote the metabolites that were upregulated and downregulated, respectively. Differential expression genes increased are indicated by red triangles. (J–M) Relative levels of differential expression genes related to arginine and proline metabolism during meiotic resumption. Error bars, SD. Student’s t test was used for statistical analysis in all panels, comparing to GV. n.s., not significant.
Figure 5
Figure 5
Active one-carbon metabolism in porcine oocytes. (A–J) Relative levels of metabolites related to one-carbon metabolism in oocytes at three time points. (K) Overview of the metabolic processes of one-carbon metabolism in porcine oocytes upon meiotic resumption, derived from metabolomics and transcriptomics. The red and blue arrows denote the metabolites that are upregulated and downregulated, respectively. Differential expression genes increased and decreased are indicated by red and blue triangles, respectively. (L–S) Relative levels of representative genes involved in inputs and outputs of one-carbon metabolism during meiotic resumption. Error bars, SD. Student’s t test was used for statistical analysis in all panels, comparing to GV. n.s., not significant.
Figure 6
Figure 6
Tryptophan utilization during porcine oocyte maturation. (A–G) Relative levels of metabolites related to tryptophan metabolism in oocytes at three time points. (H) Schematic diagram of tryptophan metabolism during meiotic maturation, derived from metabolomics and transcriptomics. The red and blue arrows denote the metabolites that are upregulated and downregulated, respectively. DEGs increased and decreased are indicated by red and blue triangles, respectively. (I–O) Relative levels of representative differential expression genes involved in tryptophan utilization for maturation of porcine oocytes. Error bars, SD. Student’s t test was used for statistical analysis in all panels, comparing to GV. n.s., not significant.
Figure 7
Figure 7
Carbohydrate metabolism activity during oocyte maturation. (A-E) Relative levels of metabolites related to carbohydrate metabolism in oocytes at three time points. (F) Schematic diagram of carbohydrate metabolism during meiotic maturation, derived from metabolomics and transcriptomics. The red and blue arrows denote the metabolites that are upregulated and downregulated, respectively. Differential expression genes increased and decreased are indicated by red and blue triangles. (G–R) Relative levels of differential expression genes involved in carbohydrate metabolism during oocyte maturation. Error bars, SD. Student’s t test was used for statistical analysis in all panels, comparing to GV. n.s., not significant.
Figure 8
Figure 8
Metabolic changes in nucleotides during oocyte maturation. (A-L) Relative levels of metabolites related to nucleotide metabolism in oocytes at three time points. (M) Schematic diagram of nucleotide metabolism during meiotic maturation, derived from metabolomics and transcriptomics. The red and blue arrows denote the metabolites that are upregulated and downregulated, respectively. DEGs increased and decreased are indicated by red and blue triangles, respectively. (N–S) Relative levels of DEGs involved in glucose metabolism during oocyte maturation. Error bars, SD. Student’s t test was used for statistical analysis in all panels, comparing to GV. n.s., not significant.
Figure 9
Figure 9
Characteristics of global metabolic patterns during porcine oocyte maturation. Diagram illustrating the dynamic changes in metabolites and gene expression during porcine oocyte maturation.

References

    1. Lonergan P, Fair T. Maturation of oocytes in vitro. Annu Rev Anim Biosci (2016) 4:255–68. doi: 10.1146/annurev-animal-022114-110822 - DOI - PubMed
    1. Li L, Zhu S, Shu W, Guo Y, Guan Y, Zeng J, et al. . Characterization of metabolic patterns in mouse oocytes during meiotic maturation. Mol Cell (2020) 80(3):525–40e9. doi: 10.1016/j.molcel.2020.09.022 - DOI - PMC - PubMed
    1. Miao Y-L, Kikuchi K, Sun Q-Y, Schatten H. Oocyte aging: cellular and molecular changes, developmental potential and reversal possibility. Hum Reprod Update. (2009) 15(5):573–85. doi: 10.1093/humupd/dmp014 - DOI - PubMed
    1. Gu L, Liu H, Gu X, Boots C, Moley KH, Wang Q. Metabolic control of oocyte development: linking maternal nutrition and reproductive outcomes. Cell Mol Life Sci (2015) 72(2):251–71. doi: 10.1007/s00018-014-1739-4 - DOI - PMC - PubMed
    1. Jungheim ES, Schoeller EL, Marquard KL, Louden ED, Schaffer JE, Moley KH. Diet-induced obesity model: abnormal oocytes and persistent growth abnormalities in the offspring. Endocrinology (2010) 151(8):4039–46. doi: 10.1210/en.2010-0098 - DOI - PMC - PubMed

Publication types