. 2023 Jan;10(1):015005.
doi: 10.1117/1.NPh.10.1.015005. Epub 2023 Feb 16.

In vivo characterization of cerebrovascular impairment induced by amyloid β peptide overload in glymphatic clearance system using swept-source optical coherence tomography

Affiliations

In vivo characterization of cerebrovascular impairment induced by amyloid β peptide overload in glymphatic clearance system using swept-source optical coherence tomography

Yao Yu et al. Neurophotonics. 2023 Jan.

Abstract

Significance: Antiamyloid β ( A β ) immunotherapy is a promising therapeutic strategy for Alzheimer's disease (AD) but generates large amounts of soluble A β peptides that could overwhelm the clearance pathway, leading to serious side effects. Direct implications of A β in glymphatic drainage transport for cerebral vasculature and tissue are not well known. Studies are needed to resolve this issue and pave the way to better monitoring abnormal vascular events that may occur in A β -modifying therapies for AD.

Aim: The objective is to characterize the modification of cerebral vasculature and tissue induced by soluble A β abundantly present in the glymphatic clearance system.
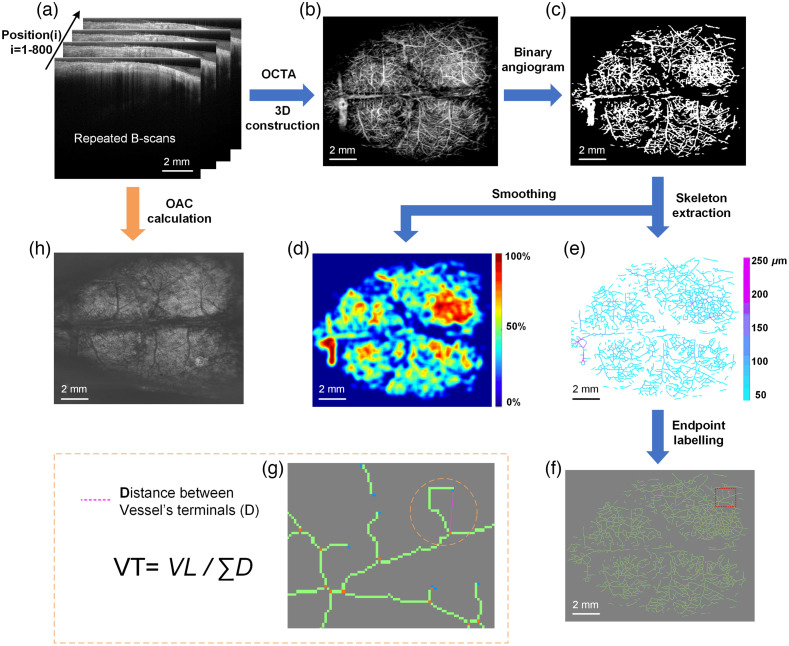
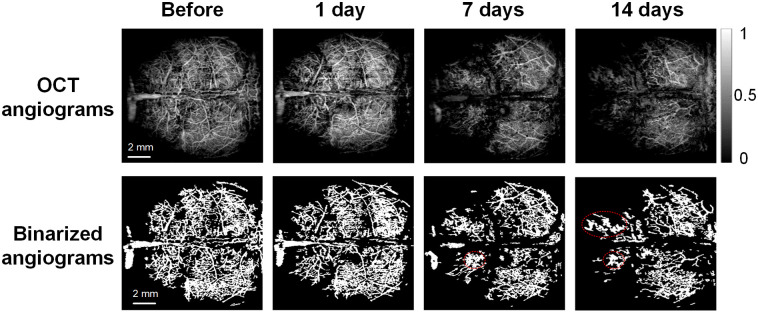
Approach: A β 1 - 42 peptide was injected intracerebroventricularly and swept-source optical coherence tomography (SS-OCT) was used to monitor the progression of changes in the brain microvascular network and tissue in vivo over 14 days. Parameters reflecting vascular morphology and structure as well as tissue status were quantified and compared before treatment.

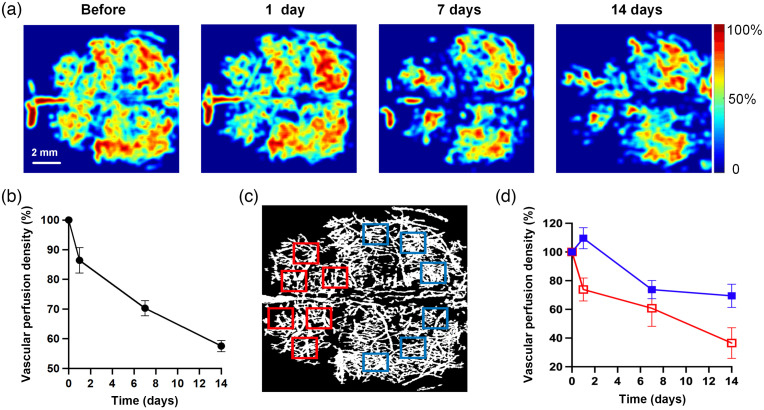
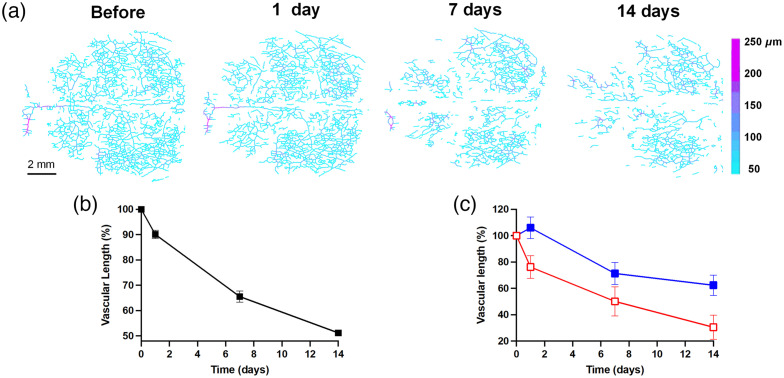
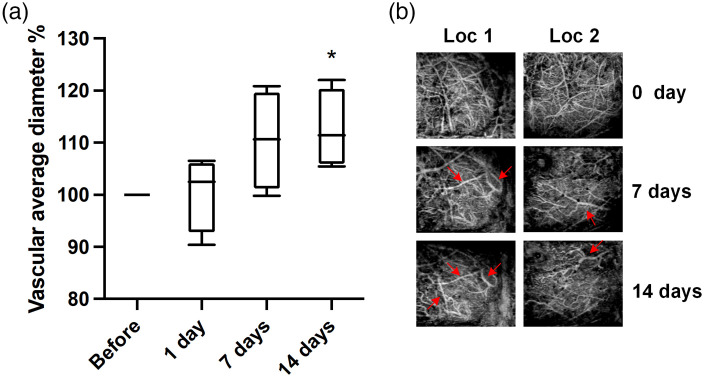
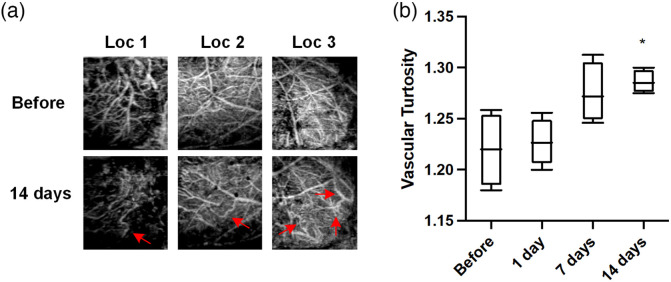
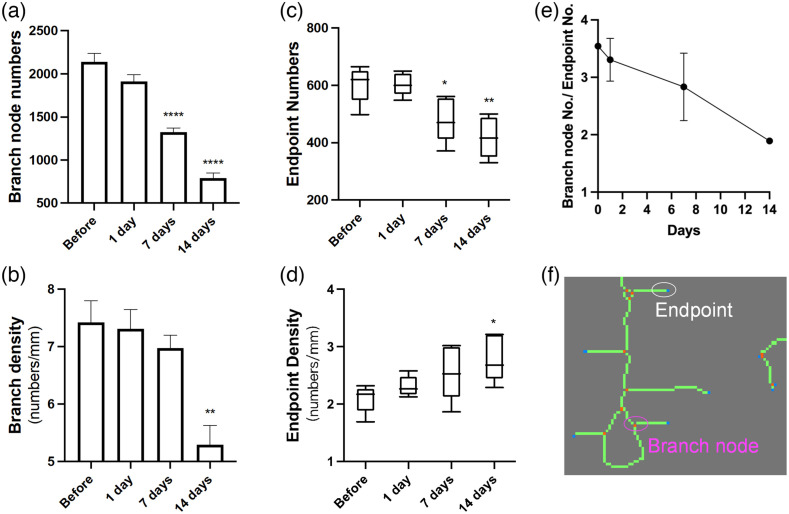
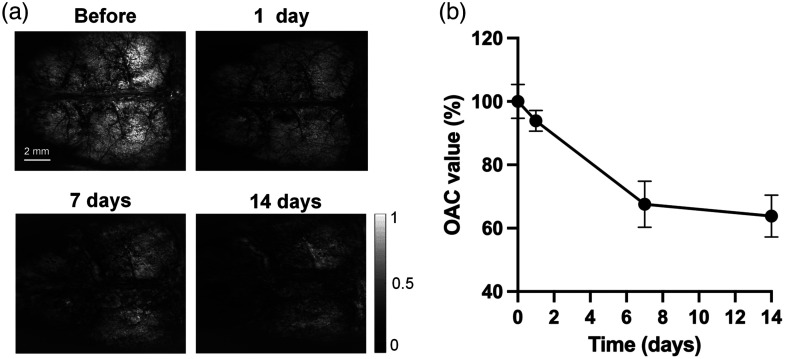
Results: Vascular perfusion density, vessel length, and branch density decreased sharply and persistently following peptide administration. In comparison, vascular average diameter and vascular tortuosity were moderately increased at the late stage of monitoring. Endpoint density gradually increased, and the global optical attenuation coefficient value decreased significantly over time.

Conclusions: A β burden in the glymphatic system directly contributes to cerebrovascular structural and morphological abnormalities and global brain tissue damage, suggesting severe deleterious properties of soluble cerebrospinal fluid- A β . We also show that OCT can be used as an effective tool to monitor cerebrovascular dynamics and tissue property changes in response to therapeutic treatments in drug discovery research.

Keywords: Alzheimer’s disease; amyloid β; cerebrovasculature; glymphatic system; optical coherence tomography.


Figures

Fig. 1
Fig. 1
Overview of data processing procedures. (a) The original structural images acquired by SS-OCT. Scans are repeated four times at each position and a total of 800 positions were collected. (b) OCT angiogram. (c) Binary angiogram. (d) VPD image. (e) Vascular skeleton image. (f) Vascular skeleton image with vessel branch terminals labeled (orange dots: branch nodes, blue dots: endpoints). (g) Enlarged view of the red box in (f). (h) OAC image.
Fig. 2
Fig. 2
Cerebral vasculature images of mouse brain obtained using SS-OCT. The first row shows the original OCT angiograms, the second row presents the corresponding binarized angiograms at different time points. Dotted circles indicate the “vascular clusters” or “vascular bundles.”
Fig. 3
Fig. 3
Aβ peptide induces VPD reduction in mouse brain. VPD maps derived from OCT data before and 1, 7, and 14 days after amyloid infusion in CFS (a). Data were expressed as percentage values relative to before treatment. The percentage of (b) total VPD and (d) local VPD selected in the anterior (red squares in c) and posterior (blue squares in c) parts of the brain, were also plotted over monitoring time, respectively.
Fig. 4
Fig. 4
The progression of VL as a function of time after amyloid peptide perfusion in CSF. (a) The vascular skeleton diagrams with each pixel value in the figure represent the radius of the blood vessel (unit: μm). (b) The total VL% changes over time and (c) comparison of VL% between the anterior (red hollow square) and posterior (blue solid square) regions of mouse vasculature. Data (mean ± S.E.M.) were presented as percentage over the value obtained before peptide treatment and were plotted with monitoring time.
Fig. 5
Fig. 5
VAD changes after peptide injection. (a) Total VAD presented as a percentage of the value obtained before peptide treatment (before) and plotted over time. Each bar represents the group mean ± S.E.M, significant differences between certain group and before denoted *p<0.05. (b) Locations (Loc) where vascular diameters were visibly greater compared to untreated brain, indicated by red arrows. Each column represents the same location.
Fig. 6
Fig. 6
Cerebrovascular tortuosity before and after Aβ peptide exposure. (a) Regional OCT images showing that vessels became more tortuous at 14 days (second row, red arrows) compared to before treatment (first row). Pictures within the same columns are from the same location. (b) Average VT of the entire mouse brain. Each bar represents the group mean ± S.E.M, and significant differences between certain group and before peptide injection is denoted *p<0.05.
Fig. 7
Fig. 7
The effect of Aβ on vascular branching and fragmentation. (a) The branch node numbers based on calculating orange dots illustrated in (f) in the entire brain at different time points. (b) Branch density is defined as the branch node numbers divided by VL. (c) Endpoint numbers based on counting blue dots shown in (f) in the whole brain image. (d) Endpoint density is the ratio of endpoint numbers to the VL. (e) The ratio of branch node numbers/endpoint numbers is plotted over time. (f) A representative local area of the vascular skeleton image with branch nodes (orange dots) and endpoints (blue dots) labeled.
Fig. 8
Fig. 8
Aβ-induced changes in the average OAC of the brain over time. (a) The OAC images of the mouse brain at varies time points and (b) a quantification of the mean OAC value, expressed as a percentage at 0 day, presented as mean ± S.E.M.

Similar articles

Cited by

References

    1. Hur J.-Y., “γ-Secretase in Alzheimer’s disease,” Exp. Mol. Med. 54(4), 433–446 (2022).10.1038/s12276-022-00754-8 - DOI - PMC - PubMed
    1. Jack C. R., Jr., et al. , “NIA‐AA research framework: toward a biological definition of Alzheimer’s disease,” Alzheimer’s Dement. 14(4), 535–562 (2018).10.1016/j.jalz.2018.02.018 - DOI - PMC - PubMed
    1. Cummings J., et al. , “Alzheimer’s disease drug development pipeline: 2021,” Alzheimer’s Dement. Transl. Res. Clin. Interventions 7(1), e12179 (2021).10.1002/trc2.12179 - DOI - PMC - PubMed
    1. Alexander G. C., et al. , “Revisiting FDA approval of aducanumab,” N. Engl. J. Med. 385(9), 769–771 (2021).NEJMAG10.1056/NEJMp2110468 - DOI - PMC - PubMed
    1. Walsh S., et al. , “Aducanumab for Alzheimer’s disease?” Br. Med. J. 374, n1682 (2021).BMJOAE10.1136/bmj.n1682 - DOI - PMC - PubMed