. 2023 Feb 2:25:160-175.
doi: 10.1016/j.bioactmat.2023.01.023. eCollection 2023 Jul.

3D bio-printed living nerve-like fibers refine the ecological niche for long-distance spinal cord injury regeneration

Affiliations

3D bio-printed living nerve-like fibers refine the ecological niche for long-distance spinal cord injury regeneration

Jia Yang et al. Bioact Mater. .

Abstract

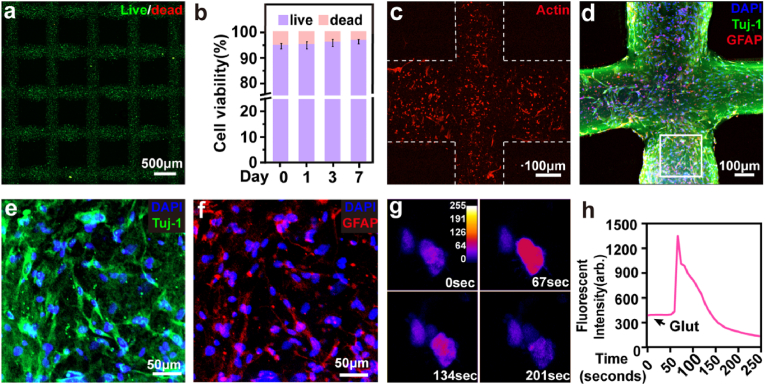
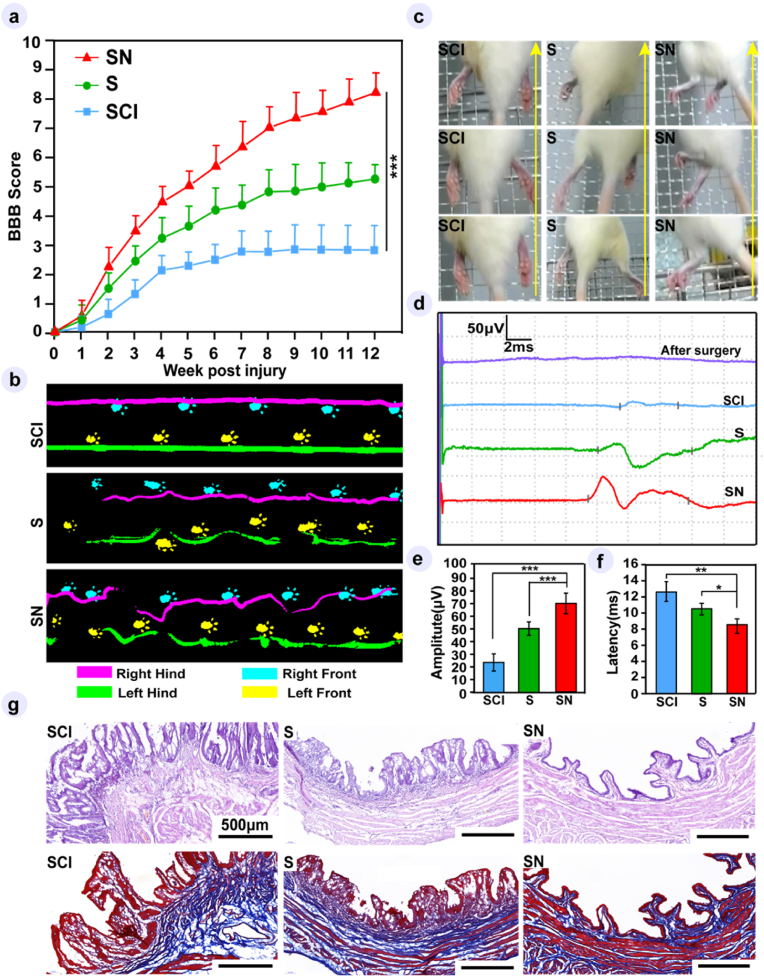
3D bioprinting holds great promise toward fabricating biomimetic living constructs in a bottom-up assembly manner. To date, various emergences of living constructs have been bioprinted for in vitro applications, while the conspicuous potential serving for in vivo implantable therapies in spinal cord injury (SCI) has been relatively overlooked. Herein, living nerve-like fibers are prepared via extrusion-based 3D bioprinting for SCI therapy. The living nerve-like fibers are comprised of neural stem cells (NSCs) embedded within a designed hydrogel that mimics the extracellular matrix (ECM), assembled into a highly spatial ordered architecture, similar to densely arranged bundles of the nerve fibers. The pro-neurogenesis ability of these living nerve-like fibers is tested in a 4 mm-long complete transected SCI rat model. Evidence shows that living nerve-like fibers refine the ecological niche of the defect site by immune modulation, angiogenesis, neurogenesis, neural relay formations, and neural circuit remodeling, leading to outstanding functional reconstruction, revealing an evolution process of this living construct after implantation. This effective strategy, based on biomimetic living constructs, opens a new perspective on SCI therapies.

Keywords: 3D bioprinting; Hydrogels; Living constructs; Neural stem cells; Spinal cord injury.


Figures

Image 1
Graphical abstract
Fig. 1
Fig. 1
Scheme showing the fabrication of the 3D bioprinted living nerve-like fibers and the remodeling of the new-born functional network in vivo.
Fig. 2
Fig. 2
Fabrication and evaluation of printed scaffolds. a-c) Images of various 3D printed scaffolds. d) Images of 3D printed grid. e-f) SEM images of 3D printed scaffolds. g-h) Photographs of the printed scaffolds assembled with parallel linear arrays.
Fig. 3
Fig. 3
3D bioprinting and characterization of NSC-laden scaffolds in vitro. a) Live (green)/Dead (red) staining images of 3D bioprinted NSC-laden scaffolds cultured for 0 day. b) Cell viability (%) of 3D bioprinted NSC-laden scaffolds cultured at Day 0 (2 h), Day 1, Day 3, and Day 7. c) Cytoskeleton staining images of 3D bioprinted NSC-laden scaffolds cultured for 3 days. d) Representative images of 3D bioprinted NSC-laden scaffolds cultured for 7 days co-stained DAPI (blue), Tuj-1(green), and GFAP (red). e-f) the enlarged images from the white rectangle of (d). g) Calcium imaging of neurons within 3D bioprinted NSC-laden scaffolds cultured for 14 days. Relative neural activity is shown as color-coded, with signal intensity ranging from black (inactive) to white (high active). Measured and recorded after the addition of the glutamate. h) Time-dependent fluorescent intensity of positive cells shown in (g).
Fig. 4
Fig. 4
The living nerve-like fibers regulate the inflammatory response. a-b) Representative CD68 (green), CD206 (red), and DAPI (blue) immunofluorescence staining images of the rostral, lesion, and caudal in the injured spinal cord of three groups, 1 week post-injury. c-d) Quantification of the density of CD68-positive, the polarization ratio of M2 macrophage, respectively. e) Representative images of immunohistochemical staining of the DAPI (blue), GFAP (white), Iba1 (red) in the injured sites of the three groups. All data represented the mean ± SD (n = 5). *P < 0.05, **P < 0.01, ***P < 0.001. Dotted lines mark the boundaries between the lesion site and the host spinal cord. the yellow pentagrams indicate the lesion site.
Fig. 5
Fig. 5
The living nerve-like fibers create a suitable niche for newborn neurons. a) Representative low and higher magnification immunofluorescence images of DAPI (blue), GAP43 (red), and CS-56 (green), in three groups, 12 weeks post-injury. a4-a9) are enlarged images from (a1-a3). b) Representative DAPI (blue), Tuj-1 (red), and RECA-1(green) immunofluorescence images of the rostral, lesion, and caudal in the injured spinal cord, in three groups, 12 weeks post-injury, the yellow pentagrams indicate the lesion site. Dotted lines mark the boundaries between the lesion site and the host spinal cord. c-d) High-magnification Z-stack images of lesion site in SN group; Arrows, classical blood vessel structure.
Fig. 6
Fig. 6
The living nerve-like fibers enhance nerve regeneration. a1-a3) Representative immunofluorescence images of a longitudinal section in three groups spinal cord co-staining for DAPI (blue) with Tuj-1 (red), 12 weeks post-injury. b1-b3) enlarged images from a1, a2, a3, respectively. a4-a6) Representative immunofluorescence images of a longitudinal section in three groups spinal cord co-staining for DAPI (blue) with GAP43 (red), 12 weeks post-injury. b5-b7) enlarged images from a4, a5, a6, respectively, 12 weeks post-injury. a7-a9) Representative immunofluorescence images of a longitudinal section in three groups spinal cord co-staining for DAPI (blue) with NF (red), 12 weeks post-injury. b9-a11) enlarged images from a7, a8, a9, respectively. b4) Quantitative analysis of Tuj1-positive axons density, b8) GAP43 -positive axons density, and b12) NF-positive axons density, respectively (positive immunoreactive area/total area); A boxplot shows the minimum, first quartile, medium, third quartile, and maximum of the data; *P < 0.05, **P < 0.01, ***P < 0.001; n = 5.
Fig. 7
Fig. 7
The living nerve-like fibers facilitate myelin regeneration. a-b) Toluidine blue-stained and TEM images of transverse sections at the lesion site of the SCI, S, and SN groups, respectively. c) Quantitative analysis of the density of the myelinated nerve fiber from toluidine blue-stained images (number/total area). d) Quantitative analysis of the area-based G-ratio from TEM images. A boxplot shows the minimum, first quartile, medium, third quartile, and maximum of the data; e) The scatter diagram of G-ratio versus nerve fiber area from TEM images; *P < 0.05, **P < 0.01, ***P < 0.001; n = 3. f) Representative immunofluorescence images of a longitudinal and transverse section in the SN group spinal cord co-staining for NF (green) and MBP (red). g) High-magnification Z-stack images of the lesion site from a longitudinal section in the SN group.
Fig. 8
Fig. 8
The living nerve-like fibers remodel a functional neuronal network. a) Representative immunofluorescence images of a longitudinal section in the SN group spinal cord co-staining for DAPI (blue) with GFP (green), NF (red), SYN (white); a2-a5) Enlarged images from (a1); a6) High-magnification Z-stack images staining GFP (green), NF (red), SYN (white) of the SN group. b) TEM images detect the synapse formation in the SN group; the yellow arrow indicates the classical synaptic structure; the yellow dotted rectangle marks the insert, which shows the enlarged images of the synaptic structure. c) Quantitative analysis of the synapse formation ratio within the NF-positive cells. *P < 0.05, **P < 0.01, ***P < 0.001; n = 5. d1-d3) Representative images of DAPI (blue), GFP (green), NF (red), and ChAT (white) immunolabeling at the lesion site in the SN group. d4-d6) Representative images of DAPI (blue), GFP (green), NF (red), and TH (white) immunolabeling at the lesion site in the SN group, d7) Representative images of DAPI (blue), GFP (green), NF (red), and 5-HT (white) immunolabeling at the lesion site in the SN group. e) BDA-immunostained sagittal section overview in the SN group. e2-e4) Enlarged images of the rostral, lesion, and caudal in (e1), respectively. Dotted lines mark the boundaries between the lesion site and the host spinal cord.
Fig. 9
Fig. 9
The living nerve-like fibers promote functional recovery. a) Locomotion-BBB hindlimb scores each week post-injury. Two-way repeated measures analysis of variance (ANOVA). *P < 0.05, **P < 0.01, ***P < 0.001; n = 8. b) The representative footprints recorded by the Catwalk system. c) Time series images of the rats' hindlimbs while climbing upward from the bottom; Upward-pointing arrows indicate the direction of time sequences. d) Representative recorded cortical motor evoked potentials (MEP). e-f) Quantitative analysis of MEP amplitude and latency; *P < 0.05, **P < 0.01, ***P < 0.001; n = 3. g) H&E staining and mason dyeing images of the bladder tissues.

Similar articles

Cited by

References

    1. Varadarajan S.G., Hunyara J.L., Hamilton N.R., Kolodkin A.L., Huberman A.D. Central nervous system regeneration. Cell. 2022;185(1):77–94. doi: 10.1016/j.cell.2021.10.029. - DOI - PMC - PubMed
    1. Sofroniew M.V. Dissecting spinal cord regeneration. Nature. 2018;557(7705):343–350. doi: 10.1038/s41586-018-0068-4. - DOI - PubMed
    1. Fan B., Wei Z., Yao X., Shi G., Cheng X., Zhou X., Zhou H., Ning G., Kong X., Feng S. Microenvironment imbalance of spinal cord injury. Cell Transplant. 2018;27(6):853–866. doi: 10.1177/0963689718755778. - DOI - PMC - PubMed
    1. Assinck P., Duncan G.J., Hilton B.J., Plemel J.R., Tetzlaff W. Cell transplantation therapy for spinal cord injury. Nat. Neurosci. 2017;20(5):637–647. doi: 10.1038/nn.4541. - DOI - PubMed
    1. Fischer I., Dulin J.N., Lane M.A. Transplanting neural progenitor cells to restore connectivity after spinal cord injury. Nat. Rev. Neurosci. 2020;21(7):366–383. doi: 10.1038/s41583-020-0314-2. - DOI - PMC - PubMed

LinkOut - more resources