. 2022:2022:9891510.
doi: 10.34133/2022/9891510. Epub 2022 Aug 1.

High-Frequency 3D Photoacoustic Computed Tomography Using an Optical Microring Resonator

Affiliations

High-Frequency 3D Photoacoustic Computed Tomography Using an Optical Microring Resonator

Qiangzhou Rong et al. BME Front. 2022.

Abstract

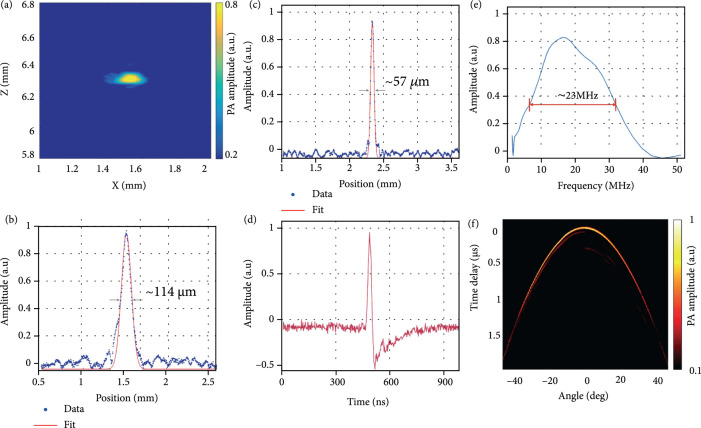
3D photoacoustic computed tomography (3D-PACT) has made great advances in volumetric imaging of biological tissues, with high spatial-temporal resolutions and large penetration depth. The development of 3D-PACT requires high-performance acoustic sensors with a small size, large detection bandwidth, and high sensitivity. In this work, we present a new high-frequency 3D-PACT system that uses a micro-ring resonator (MRR) as the acoustic sensor. The MRR sensor has a size of 80 μm in diameter, and was fabricated using the nanoimprint lithography technology. Using the MRR sensor, we have developed a transmission-mode 3D-PACT system that has achieved a detection bandwidth of ~23 MHz, an imaging depth of ~8 mm, a lateral resolution of 114 μm, and an axial resolution of 57 μm. We have demonstrated the 3D PACT's performance on in vitro phantoms, ex vivo mouse brain, and in vivo mouse ear and tadpole. The MRR-based 3D-PACT system can be a promising tool for structural, functional, and molecular imaging of biological tissues at depths.

Keywords: All-optical system; High frequency detection; Micro-ring resonator; Photoacoustic computed tomography; Three-dimensional imaging; Transmission-mode imaging.


Conflict of interest statement

The authors declare no conflicts of interest.

Figures

Figure 1
Figure 1
Schematic of the MRR-based 3D-PACT system and the MRR sensor. (a) 3D-PACT system with an optically transparent MRR sensor. CW: continuous wave; AT: attenuator; OL: objective lens; PC: polarization controller; FC: fiber coupler; DAQ: data acquisition; APD: avalanche photodetector; US: ultrasound; SP: scanning plane. (b) A top-view scanning electron microscope (SEM) image of the MRR sensor. MRW: microring waveguide; BW: bus waveguide. (c) A top-view SEM image of the coupling region of the MRR sensor. (d) A cross-sectional SEM image of the MRR sensor. (e) A cross-sectional SEM image of the MRR sensor with a protection layer. (f) A photograph of the packaged MRR sensor on 25 mm diameter glass substrate with the SMF input and MMF output. (g) Theoretically simulated resonance spectrum of the MRR sensor and its shift under 1 MPa ultrasound pressure. The inset is the E-field distribution of light transmission inside the waveguide. (h) Resonance spectra around 772.4 nm and Q-factors of the MRR sensors with low RI cladding and PDMS cladding. (i) Resonance spectra of MRR at two orthogonal polarization states: quasi-TE mode and quasi-TM mode.
Figure 2
Figure 2
Characterization of the MRR sensor. (a) An x-z slice of the reconstructed 3D PA image of a carbon fiber. (b, c) The lateral and axial signal profiles along the arrow positions indicated in (a) and the corresponding Gaussian fitting. The FWHMs were measured as the lateral and axial resolutions. (d) Time-resolved PA signal from the carbon fiber at zero-degree angular position, measured by the MRR sensor. (e) Frequency analysis of PA signal in (d). (f) PA signals at different angular positions to the MRR sensor.
Figure 3
Figure 3
MRR-based 3D-PACT on phantoms. (a) Schematic and reconstructed PA image of four human hairs at different depths in water. (b) Photograph and reconstructed PA image of three crossed hairs in scattering medium. (c) Photograph and reconstructed PA image of a leaf skeleton. (d) 3D PA images of four human hairs distributed randomly in scattering medium. (e) 3D PA images of a hair knot in scattering medium.
Figure 4
Figure 4
3D-PACT of ex vivo brain and in vivo mouse ear and tadpole. (a) Photograph of the perfused mouse brain. (b) MAP PA images of the perfused brain. (c) Photograph of the mouse ear. (d) MAP PA images of the mouse ear. (e) Photograph of Xenopus laevis tadpole. Inset is a close-up image of the skin pigments. (f) MAP PA images of the tadpole.

References

    1. Wang L. V., “Multiscale photoacoustic microscopy and computed tomography,” Nature Photonics, vol. 3, no. 9, pp. 503–509, 2009 - PMC - PubMed
    1. Wang L. V., and Hu S., “Photoacoustic tomography: in vivo imaging from organelles to organs,” Science, vol. 335, pp. 1462–1485, 2012 - PMC - PubMed
    1. Lin L., Hu P., Shi J., Appleton C. M., Maslov K., Li L., Zhang R., and Wang L. V., “Single-breath-hold photoacoustic computed tomography of the breast,” Nature Communications, vol. 9, no. 1, p. 2352, 2018 - PMC - PubMed
    1. Lin L., Tong X., Hu P., Invernizzi M., Lai L., and Wang L. V., “Photoacoustic computed tomography of breast cancer in response to neoadjuvant chemotherapy,” Advanced Science, vol. 8, no. 7, p. 2003396, 2021 - PMC - PubMed
    1. Taruttis A., and Ntziachristos V., “Advances in real-time multispectral optoacoustic imaging and its applications,” Nature Photonics, vol. 9, no. 4, pp. 219–227, 2015

LinkOut - more resources