Identification of Pyroptosis-Relevant Signature in Tumor Immune Microenvironment and Prognosis in Skin Cutaneous Melanoma Using Network Analysis
- PMID: 36818162
- PMCID: PMC9931490
- DOI: 10.1155/2023/3827999
Identification of Pyroptosis-Relevant Signature in Tumor Immune Microenvironment and Prognosis in Skin Cutaneous Melanoma Using Network Analysis
Abstract
Background: Pyroptosis is closely related to the programmed death of cancer cells as well as the tumor immune microenvironment (TIME) via the host-tumor crosstalk. However, the role of pyroptosis-related genes as prognosis and TIME-related biomarkers in skin cutaneous melanoma (SKCM) patients remains unknown.
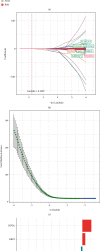
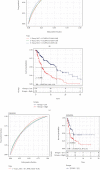
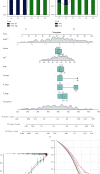
Methods: We evaluated the expression profiles, copy number variations, and somatic mutations (CNVs) of 27 genes obtained from MSigDB database regulating pyroptosis among TCGA-SKCM patients. Thereafter, we conducted single-sample gene set enrichment analysis (ssGSEA) for evaluating pyroptosis-associated expression patterns among cases and for exploring the associations with clinicopathological factors and prognostic outcome. In addition, a prognostic pyroptosis-related signature (PPRS) model was constructed by performing Cox regression, weighted gene coexpression network analysis (WGCNA), and least absolute shrinkage and selection operator (LASSO) analysis to score SKCM patients. On the other hand, we plotted the ROC and survival curves for model evaluation and verified the robustness of the model through external test sets (GSE22153, GSE54467, and GSE65904). Meanwhile, we examined the relations of clinical characteristics, oncogene mutations, biological processes (BPs), tumor stemness, immune infiltration degrees, immune checkpoints (ICs), and treatment response with PPRS via multiple methods, including immunophenoscore (IPS) analysis, gene set variation analysis (GSVA), ESTIMATE, and CIBERSORT. Finally, we constructed a nomogram incorporating PPRS and clinical characteristics to improve risk evaluation of SKCM.
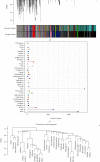
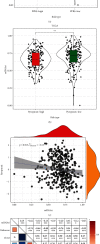
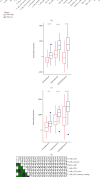
Results: Many pyroptosis-regulated genes showed abnormal expression within SKCM. TP53, TP63, IL1B, IL18, IRF2, CASP5, CHMP4C, CHMP7, CASP1, and GSDME were detected with somatic mutations, among which, a majority displayed CNVs at high frequencies. Pyroptosis-associated profiles established based on pyroptosis-regulated genes showed markedly negative relation to low stage and superior prognostic outcome. Blue module was found to be highly positively correlated with pyroptosis. Later, this study established PPRS based on the expression of 8 PAGs (namely, GBP2, HPDL, FCGR2A, IFITM1, HAPLN3, CCL8, TRIM34, and GRIPAP1), which was highly associated with OS, oncogene mutations, tumor stemness, immune infiltration degrees, IC levels, treatment responses, and multiple biological processes (including cell cycle and immunoinflammatory response) in training and test set samples.
Conclusions: Based on our observations, analyzing modification patterns associated with pyroptosis among diverse cancer samples via PPRS is important, which can provide more insights into TIME infiltration features and facilitate immunotherapeutic development as well as prognosis prediction.
Copyright © 2023 Yun Zhu et al.
Conflict of interest statement
The authors have no conflict of interest.
Figures





Similar articles
-
System analysis based on the pyroptosis-related genes identifes GSDMD as a novel therapy target for skin cutaneous melanoma.J Transl Med. 2023 Nov 10;21(1):801. doi: 10.1186/s12967-023-04513-9. J Transl Med. 2023. PMID: 37950289 Free PMC article.
-
Identification of a pyroptosis-associated long non-coding RNA signature for predicting the immune status and prognosis in skin cutaneous melanoma.Eur Rev Med Pharmacol Sci. 2021 Sep;25(18):5597-5609. doi: 10.26355/eurrev_202109_26779. Eur Rev Med Pharmacol Sci. 2021. PMID: 34604952
-
The Landscape of the Tumor Microenvironment in Skin Cutaneous Melanoma Reveals a Prognostic and Immunotherapeutically Relevant Gene Signature.Front Cell Dev Biol. 2021 Oct 1;9:739594. doi: 10.3389/fcell.2021.739594. eCollection 2021. Front Cell Dev Biol. 2021. PMID: 34660598 Free PMC article.
-
Construction and validation of a novel pyroptosis-related signature to predict prognosis in patients with cutaneous melanoma.Math Biosci Eng. 2022 Jan;19(1):688-706. doi: 10.3934/mbe.2022031. Epub 2021 Nov 19. Math Biosci Eng. 2022. PMID: 34903008
-
Pyroptosis-related prognosis model, immunocyte infiltration characterization, and competing endogenous RNA network of glioblastoma.BMC Cancer. 2022 Jun 3;22(1):611. doi: 10.1186/s12885-022-09706-x. BMC Cancer. 2022. PMID: 35658846 Free PMC article.
Cited by
-
Hyaluronic Acid Interacting Molecules Mediated Crosstalk between Cancer Cells and Microenvironment from Primary Tumour to Distant Metastasis.Cancers (Basel). 2024 May 16;16(10):1907. doi: 10.3390/cancers16101907. Cancers (Basel). 2024. PMID: 38791985 Free PMC article. Review.
-
System analysis based on the pyroptosis-related genes identifes GSDMD as a novel therapy target for skin cutaneous melanoma.J Transl Med. 2023 Nov 10;21(1):801. doi: 10.1186/s12967-023-04513-9. J Transl Med. 2023. PMID: 37950289 Free PMC article.
-
Analysis and assessment of ferroptosis-related gene signatures and prognostic risk models in skin cutaneous melanoma.Transl Cancer Res. 2025 Mar 30;14(3):1857-1873. doi: 10.21037/tcr-24-1506. Epub 2025 Mar 19. Transl Cancer Res. 2025. PMID: 40224981 Free PMC article.
-
A qualitative prognostic biomarker for melanoma based on the relative methylation orderings of CpG loci.Epigenetics. 2025 Dec;20(1):2487316. doi: 10.1080/15592294.2025.2487316. Epub 2025 Apr 3. Epigenetics. 2025. PMID: 40181653 Free PMC article.
-
Exploring the clinical and biological significance of the cell cycle-related gene CHMP4C in prostate cancer.BMC Med Genomics. 2024 Aug 13;17(1):210. doi: 10.1186/s12920-024-01970-z. BMC Med Genomics. 2024. PMID: 39138470 Free PMC article.
References
LinkOut - more resources
Full Text Sources
Research Materials
Miscellaneous

