

Socioeconomic inequalities in cancer mortality between and within countries in Europe: a population-based study
- PMID: 36818237
- PMCID: PMC9929598
- DOI: 10.1016/j.lanepe.2022.100551
Socioeconomic inequalities in cancer mortality between and within countries in Europe: a population-based study
Abstract
Background: Reducing socioeconomic inequalities in cancer is a priority for the public health agenda. A systematic assessment and benchmarking of socioeconomic inequalities in cancer across many countries and over time in Europe is not yet available.
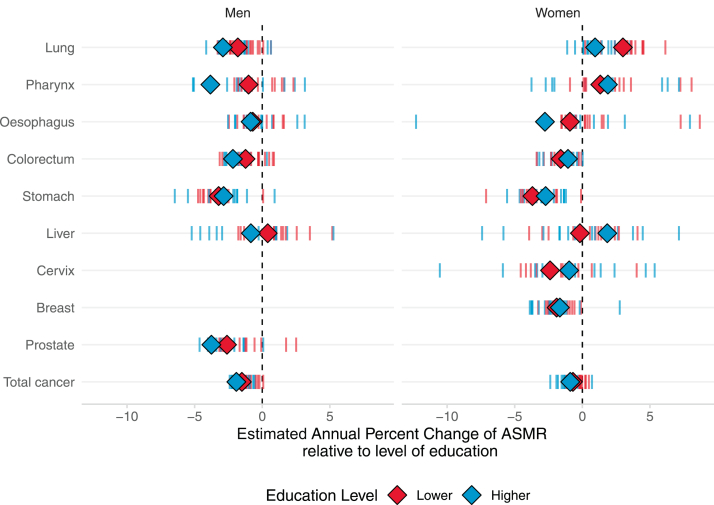
Methods: Census-linked, whole-of-population cancer-specific mortality data by socioeconomic position, as measured by education level, and sex were collected, harmonized, analysed, and compared across 18 countries during 1990-2015, in adults aged 40-79. We computed absolute and relative educational inequalities; temporal trends using estimated-annual-percentage-changes; the share of cancer mortality linked to educational inequalities.
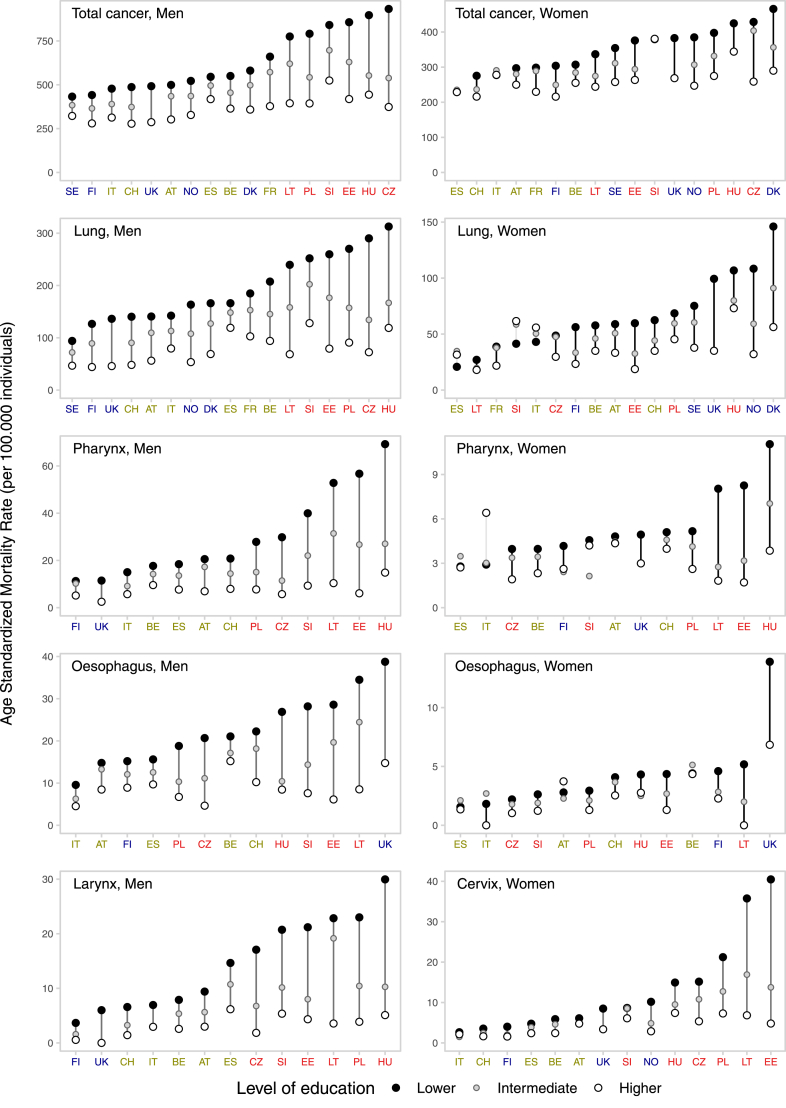
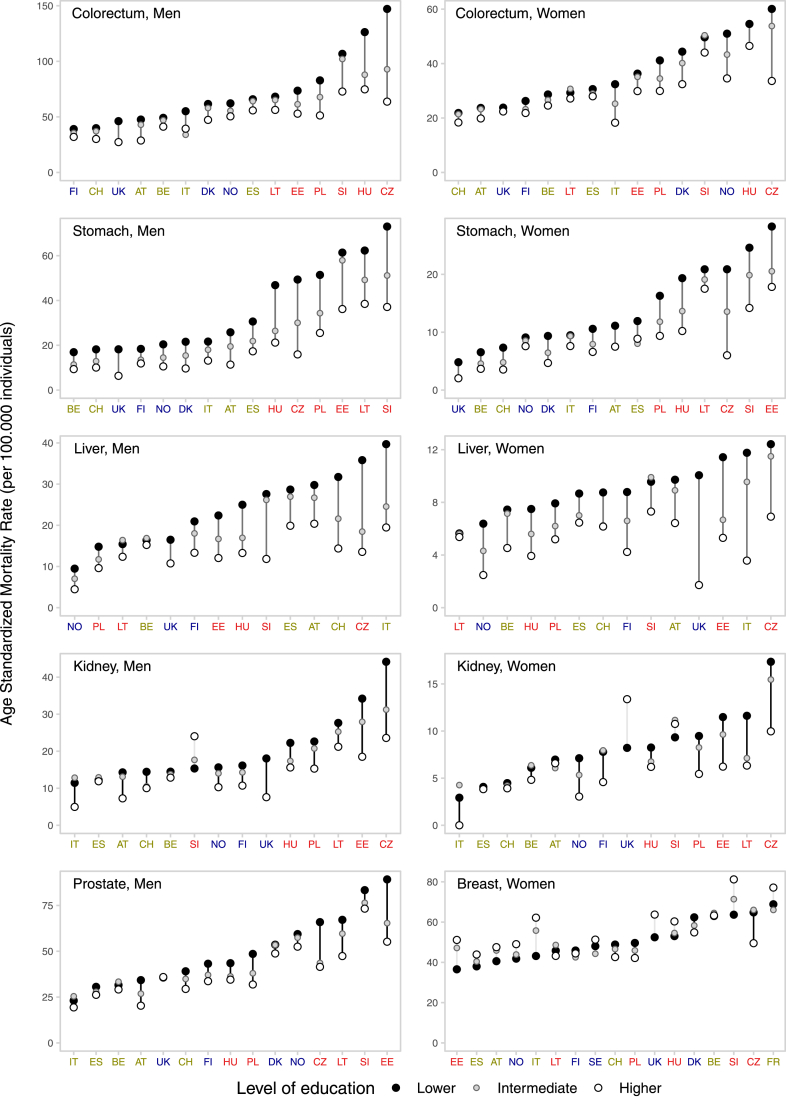
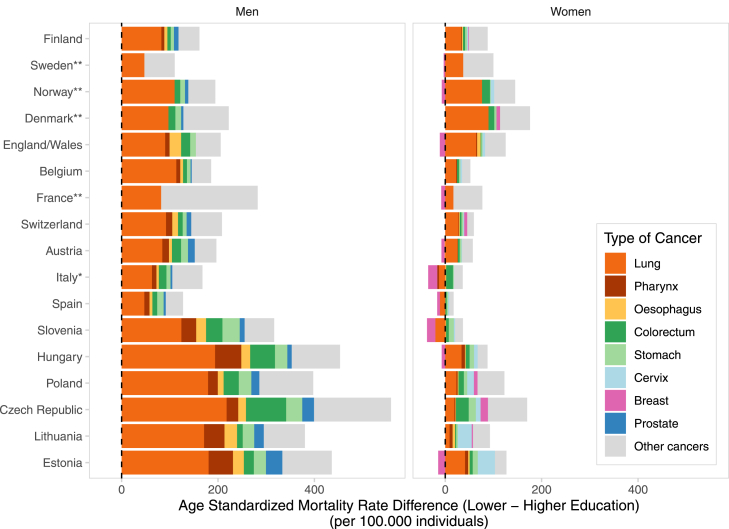
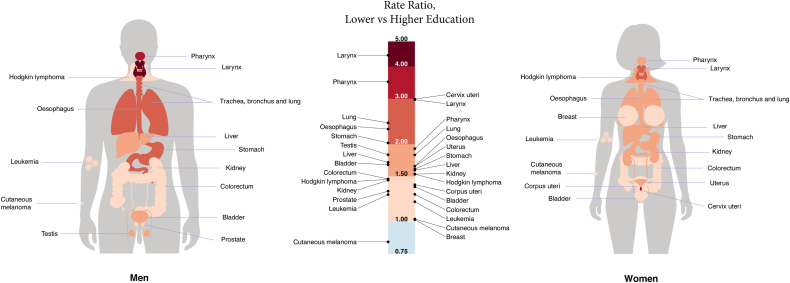
Findings: Everywhere in Europe, lower-educated individuals have higher mortality rates for nearly all cancer-types relative to their more highly-educated counterparts, particularly for tobacco/infection-related cancers [relative risk of lung cancer mortality for lower- versus higher-educated = 2.4 (95% confidence intervals: 2.1-2.8) among men; = 1.8 (95% confidence intervals: 1.5-2.1) among women]. However, the magnitude of inequalities varies greatly by country and over time, predominantly due to differences in cancer mortality among lower-educated groups, as for many cancer-types higher-educated have more similar (and lower) rates, irrespective of the country. Inequalities were generally greater in Baltic/Central/East-Europe and smaller in South-Europe, although among women large and rising inequalities were found in North-Europe (relative risk of all cancer mortality for lower- versus higher-educated ≥1.4 in Denmark, Norway, Sweden, Finland and the England/Wales). Among men, rate differences (per 100,000 person-years) in total-cancer mortality for lower-vs-higher-educated groups ranged from 110 (Sweden) to 559 (Czech Republic); among women from approximately null (Slovenia, Italy, Spain) to 176 (Denmark). Lung cancer was the largest contributor to inequalities in total-cancer mortality (between-country range: men, 29-61%; women, 10-56%). 32% of cancer deaths in men and 16% in women (but up to 46% and 24%, respectively in Baltic/Central/East-Europe) were associated with educational inequalities.
Interpretation: Cancer mortality in Europe is largely driven by levels and trends of cancer mortality rates in lower-education groups. Even Nordic-countries, with a long-established tradition of equitable welfare and social justice policies, witness increases in cancer inequalities among women. These results call for a systematic measurement, monitoring and action upon the remarkable socioeconomic inequalities in cancer existing in Europe.
Funding: This study was done as part of the LIFEPATH project, which has received financial support from the European Commission (Horizon 2020 grant number 633666), and the DEMETRIQ project, which received support from the European Commission (grant numbers FP7-CP-FP and 278511). SV and WN were supported by the French Institut National du Cancer (INCa) (Grant number 2018-116). PM was supported by the Academy of Finland (#308247, # 345219) and the European Research Council under the European Union's Horizon 2020 research and innovation programme (grant agreement No 101019329). The work by Mall Leinsalu was supported by the Estonian Research Council (grant PRG722).
Keywords: Between- and within countries cancer inequalities; Cancer disparities; Cancer mortality; Social gradient; Socioeconomic inequalities.
© 2022 Published by Elsevier Ltd.
Conflict of interest statement
We declare no competing interests.
Figures
References
-
- Bray F., Colombet M., Mery L., et al. International Agency for Research on Cancer; Lyon: 2020. Cancer incidence in five continents, Vol. XI. IARC Scientific Publication No. 166; p. 2021.
-
- Ferlay J.E.M., Lam F., Colombet M., et al. International Agency for Research on Cancer; Lyon, France: 2020. Global cancer observatory: cancer today.
-
- Vaccarella S., Lortet-Tieulent J., Saracci R., Conway D., Straif K., Wild C. Reducing social inequalities in cancer: evidence and priorities for research (IARC Scientific Publication No. 168). International Agency for Research on Cancer, Lyon. 2019. http://publicationsiarcfr/580 Available from: Chapter 6. - PubMed
Grants and funding
LinkOut - more resources
Full Text Sources
Miscellaneous
