. 2023 Feb 1:13:1047661.
doi: 10.3389/fimmu.2022.1047661. eCollection 2022.

After virus exposure, early bystander naïve CD8 T cell activation relies on NAD+ salvage metabolism

Affiliations

After virus exposure, early bystander naïve CD8 T cell activation relies on NAD+ salvage metabolism

Namit Holay et al. Front Immunol. .

Abstract

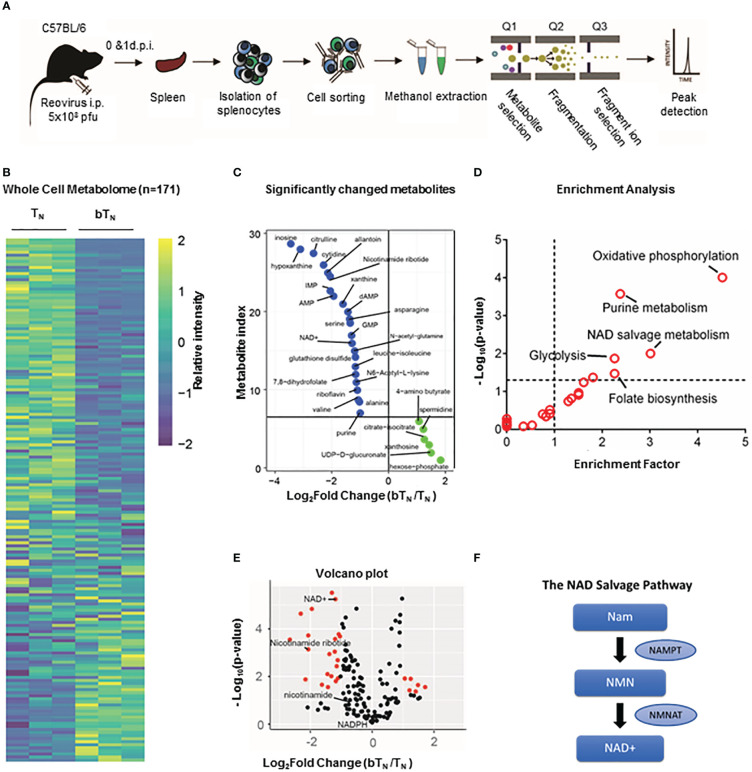
CD8 T cells play a central role in antiviral immunity. Type I interferons are among the earliest responders after virus exposure and can cause extensive reprogramming and antigen-independent bystander activation of CD8 T cells. Although bystander activation of pre-existing memory CD8 T cells is known to play an important role in host defense and immunopathology, its impact on naïve CD8 T cells remains underappreciated. Here we report that exposure to reovirus, both in vitro or in vivo, promotes bystander activation of naïve CD8 T cells within 24 hours and that this distinct subtype of CD8 T cell displays an innate, antiviral, type I interferon sensitized signature. The induction of bystander naïve CD8 T cells is STAT1 dependent and regulated through nicotinamide phosphoribosyl transferase (NAMPT)-mediated enzymatic actions within NAD+ salvage metabolic biosynthesis. These findings identify a novel aspect of CD8 T cell activation following virus infection with implications for human health and physiology.

Keywords: CD8 T cells; NAD+ salvage metabolism; antiviral immunity; bystander activation; immunometabolism; metabolic reprogramming; naïve CD8 T cells; type I interferons.


Conflict of interest statement

Authors BK and ME were employed by company IMV Inc,. The remaining authors declare that the research was conducted in the absence of any commercial or financial relationships that could be construed as a potential conflict of interest.

Figures

Figure 1
Figure 1
Reovirus induces early bystander activated naïve CD8 T cells in vivo (A) Representative dot plots demonstrating the gating strategy for the identification of CD8 T cell subsets- TN, TCM, TEM and CD44lowCD62Llow (n=3 mice per non-treated group). (B) UMAP showing CD8 TN cells in non-treated (NT) and reovirus treated (Reo 1 d.p.i.) C57BL/6 splenocytes. (C) UMAP depicting bystander activation markers in CD8 TN cells. (D) UMAP representing TCR activation markers in CD8 TN cells. (n=9 mice; NT-3 mice, Reo 1 d.p.i.-6 mice in all UMAP plots). (E) Bar graphs for the induction of CD8 bTN cells upon treatment of splenocytes from C57BL/6 mice with varying MOIs of reovirus (n=3 independent experiments). (F) Bar graphs for % of CD8+IFN-γ+ T cells in OT-1 splenocytes (n=3 independent experiments). Two-way ANOVA with 95% confidence interval was used for statistical analysis in bar graphs. Significance has been indicated only for CD8 bTN cell populations induced within 24 hours in comparison with untreated control population levels. Not significant (ns) = p > 0.05; *p < 0.05; **p < 0.01; ***p < 0.001; **** p <0.0001.
Figure 2
Figure 2
Quantitative in vivo proteomic analysis of CD8 bTN cells. (A) Schematic for the workflow of quantitative in vivo proteomics with T cells isolated from spleens of C57BL/6 mice (n=5 mice pooled for isolation of each cell type in an independent experiment). (B) Bar graph for protein expression from quantitative proteomics of granzyme K expression in CD8 bTN cells (1 d.p.i. and 7 d.p.i.). (C) Bar graphs for protein expression from quantitative proteomics of memory markers TCF7 and FOXO1 expression in TEM cells (7 d.p.i.) and CD8 bTN cells (7 d.p.i.). (D) Histogram overlay for memory marker CD127 in TEM cells (7 d.p.i.) and CD8 bTN cells (7 d.p.i.). Representative histogram shown from spleen of one mouse (n=3 mice) (E) Volcano plot compares all identified proteins across CD8 TN and CD8 bTN cells (1 d.p.i.). (F) Cluster 3 of GO TERM analysis of proteomics depicting differentially regulated pathways in CD8 bTN cells compared to TN cells. (G) Heatmap for the relative levels of interferon-stimulated proteins and interferon signalling proteins identified in TN and CD8 bTN cells (1 d.p.i.). Corresponding bar graphs show the levels of several type I interferon-associated proteins in TN and CD8 bTN cells. Two-tailed Student’s t-test with 95% confidence interval was used for statistical analysis. Not significant (ns) = p > 0.05; *p < 0.05; **p < 0.01; ***p < 0.001.
Figure 3
Figure 3
Induction of CD8 bTN cells occurs in a STAT1-dependent manner. Bar graphs showing induction of CD8 bTN cells upon ex vivo treatment of splenocytes from C57BL/6 mice with (A) varying concentrations of IFN-α1 from 10 U/mL- 200 U/mL (n=3 independent experiments), (B) varying concentrations of IFN-β1 from 10 U/mL- 200 U/mL (n=3 independent experiments) and (C) reovirus (MOI = 10) + IFNAR1 antibody (10µg/mL, n=3 independent experiments; Significance shown as indicated in figure) or isotype control. (D) IRF9 protein intensity (Two-tailed Student’s t-test). (E, F) Bar graphs for induction of CD8 bTN cells upon ex vivo treatment of splenocytes from STAT1 KO mice with reovirus MoI = 10 (n=3 independent experiments) (E) and, IFN-α1 and IFNβ1 (200 units (U)/ml each) (n=2 independent experiements) (F). Two-way ANOVA with Tukey’s multiple comparisons test and 95% confidence interval was used for statistical analysis unless otherwise indicated. Significance has been indicated for CD8 bTN cells in treatment conditions versus non-treated conditions unless otherwise indicated. Not significant (ns) = p > 0.05; **p < 0.01; **** p <0.0001.
Figure 4
Figure 4
Induction of CD8 bTN cells ex vivo upon exposure to different viruses. Bar graphs showing the induction of CD8 bTN cells upon ex vivo exposure of C57BL/6 splenocytes to (A) two different strains of herpes simplex virus (ICP0 and 1716, n=3 independent experiments each) at MoI = 0.1, (B) vesicular stomatitis virus (Indiana strain, n=3 independent experiments) at MoI = 10, (C) interferon activating strain of measles (Edmonston, n=2 independent experiments) at MoI = 0.1 and (D) wild type strain of measles (IC323, n=2 independent experiments) at MoI = 0.1. Two-way ANOVA with Sidak’s multiple comparisons test and 95% confidence interval was used for statistical analysis in bar graphs. Significance has been indicated only for CD8 bTN cell populations induced within 24 hours in comparison with untreated control population levels. Not significant (ns) = p > 0.05; **p < 0.01; ***p < 0.001; **** p <0.0001.
Figure 5
Figure 5
Semi-targeted metabolome analysis of CD8 bTN cells. (A) Schematic for the workflow of metabolome analysis of T cells. (B) Whole cell metabolome heatmap. (C) List of significant top upregulated and downregulated metabolites in CD8 bTN cells. (D) Significant metabolite Enrichment analysis of significantly changed metabolites. (E) Volcano plot depiciting metabolites that are significantly changed in CD8 bTN cells versus CD8 TN cells. NAD+ salvage metabolites are highlighted in red. (F) NAD+ salvage pathway. NAM- Nicotinamide, NMN- Nicotinamide mononucleotide and NAD+- Nicotinamide adenosine dinucleotide.
Figure 6
Figure 6
NAD+ salvage metabolism regulates induction of CD8 bTN cells. (A) Bar graphs depicting the relative peak heights of NAD+ salvage metabolites - NAM, NMN and NAD+ - using targeted metabolomics (n=4 mice per group). (B) Bar graphs for NAMPT levels- proteomics (n=5 mice pooled per condition) and quantitative PCR analysis (n = 3 independent experiments). (C–E) Bar graphs show the induction of CD8 bTN cells upon ex vivo treatment of splenocytes from C57BL/6 mice with reovirus (MoI = 10) (C) IFN-α1 (20 U/mL) (D), and IFN-β1 (20 U/mL) (E) in the presence of FK866 (5nM) and NMN (200µM) (n=3 independent experiments for each treatment, ethanol vehicle control for FK866). Two-tailed student t-test used for statistical analysis for (A, B) Two-way ANOVA with Tukey’s multiple comaprisons and 95% confidence interval was used for statistical analysis of (C–E) Not significant (ns) = p > 0.05; *p < 0.05; **p < 0.01; ***p < 0.001; **** p <0.0001.

References

    1. Hwang J-R, Byeon Y, Kim D, Park S-G. Recent insights of T cell receptor-mediated signaling pathways for T cell activation and development. Exp Mol Med (2020) 52:750–61. doi: 10.1038/s12276-020-0435-8 - DOI - PMC - PubMed
    1. Kim T-S, Shin E-C. The activation of bystander CD8+ T cells and their roles in viral infection. Exp Mol Med (2019) 51:1–9. doi: 10.1038/s12276-019-0316-1l - DOI - PMC - PubMed
    1. Lee H, Jeong S, Shin E-C. Significance of bystander T cell activation in microbial infection. Nat Immunol (2022) 23:13–22. doi: 10.1038/s41590-021-00985-3 - DOI - PubMed
    1. Alanio C, Nicoli F, Sultanik P, Flecken T, Perot B, Duffy D, et al. . Bystander hyperactivation of preimmune CD8+ T cells in chronic HCV patients. eLife (2015) 4:e07916. doi: 10.7554/eLife.07916 - DOI - PMC - PubMed
    1. Snell LM, MacLeod BL, Law JC, Osokine I, Elsaesser HJ, Hezaveh K, et al. . CD8+ T cell priming in established chronic viral infection preferentially directs differentiation of memory-like cells for sustained immunity. Immunity (2018) 49:678–694.e5. doi: 10.1016/j.immuni.2018.08.002 - DOI - PMC - PubMed

Publication types