. 2023 Feb 2:13:1077178.
doi: 10.3389/fneur.2022.1077178. eCollection 2022.

Comprehensive analysis of cuproptosis-related genes in immune infiltration in ischemic stroke

Affiliations

Comprehensive analysis of cuproptosis-related genes in immune infiltration in ischemic stroke

Xuehui Fan et al. Front Neurol. .

Abstract

Background: Immune infiltration plays an important role in the course of ischemic stroke (IS) progression. Cuproptosis is a newly discovered form of programmed cell death. To date, no studies on the mechanisms by which cuproptosis-related genes regulate immune infiltration in IS have been reported.

Methods: IS-related microarray datasets were retrieved from the Gene Expression Omnibus (GEO) database and standardized. Immune infiltration was extracted and quantified based on the processed gene expression matrix. The differences between the IS group and the normal group as well as the correlation between the infiltrating immune cells and their functions were analyzed. The cuproptosis-related DEGs most related to immunity were screened out, and the risk model was constructed. Finally, Gene Ontology (GO) function, Kyoto Encyclopedia of Genes and Genomes (KEGG) pathway enrichment analyses and drug target were performed using the Enrichr website database. miRNAs were predicted using FunRich software. Finally, cuproptosis-related differentially expressed genes (DEGs) in IS samples were typed, and Gene Set Variation Analysis (GSVA) was used to analyze the differences in biological functions among the different types.

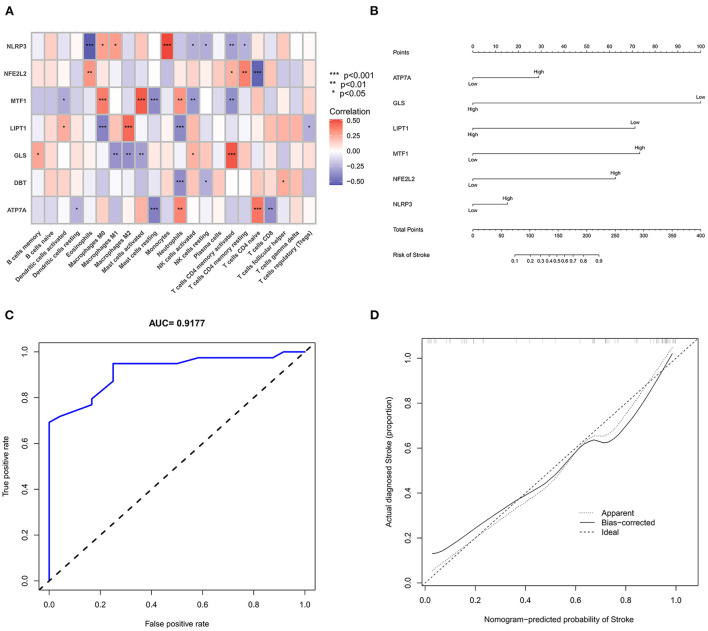
Results: Seven Cuproptosis-related DEGs were obtained by merging the GSE16561 and GSE37587 datasets. Correlation analysis of the immune cells showed that NLRP3, NFE2L2, ATP7A, LIPT1, GLS, and MTF1 were significantly correlated with immune cells. Subsequently, these six genes were included in the risk study, and the risk prediction model was constructed to calculate the total score to analyze the risk probability of the IS group. KEGG analysis showed that the genes were mainly enriched in the following two pathways: D-glutamine and D-glutamate metabolism; and lipids and atherosclerosis. Drug target prediction found that DMBA CTD 00007046 and Lithocholate TTD 00009000 were predicted to have potential therapeutic effects of candidate molecules. GSVA showed that the TGF-β signaling pathway and autophagy regulation pathways were upregulated in the subgroup with high expression of cuproptosis-related DEGs.

Conclusions: NLRP3, NFE2L2, ATP7A, LIPT1, GLS and MTF1 may serve as predictors of cuproptosis and play an important role in the pathogenesis of immune infiltration in IS.

Keywords: cuproptosis; immune infiltration; ischemic stroke; predictors; risk model construction.


Conflict of interest statement

The authors declare that the research was conducted in the absence of any commercial or financial relationships that could be construed as a potential conflict of interest.

Figures

Figure 1
Figure 1
Study flow chart.
Figure 2
Figure 2
Boxplot and heatmap for differential analysis of cuproptosis-related genes after combined datasets. (A) For the boxplot, the abscissa is the gene associated with cuproptosis, and the ordinate is the expression of the gene. (B) For the heatmap, the abscissa is the sample, and the ordinate is the gene. Red represents genes with high expression, and blue represents genes with low expression. *P < 0.05, **P < 0.01 and ***P < 0.001.
Figure 3
Figure 3
Correlation analysis of cuproptosis-related DEGs. (A) For the circle plot, the outermost layer represents the cuproptosis-related DEGs, and the line indicates the correlation between genes. A positive correlation is shown in red, and a negative correlation is shown in green. Darker colors represent more significant correlations. (B) For the matrix plot, the abscissions and diagonals are cuproptosis-related DEGs. A positive correlation is shown in red, and a negative correlation is shown in green. Larger sector areas indicate more significant correlations.
Figure 4
Figure 4
Analysis of immune infiltration in the IS group and the normal group. (A) Relative percentages of 22 immune cells in the IS and normal groups. (B) Comparison of 22 immune cell subtypes between IS and normal subjects. *P < 0.05, **P < 0.01 and ***P < 0.001.
Figure 5
Figure 5
Correlation analysis and gene prediction model of cuproptosis-related DEGs and immune cells. (A) Correlation analysis of cuproptosis-related DEGs and immune cells. The abscissa represents the name of immune cells, and the ordinate represents the genes related to death. Red represents positive correlation, and blue represents negative correlation. Darker colors indicate stronger correlations (*P < 0.05, **P < 0.01 and ***P < 0.001). (B) Nomograms, which were based on the correlation analysis of immune cells, screened out the most immune-related genes to construct a risk prediction model. The IS risk index of patients was predicted through nomograms. (C) ROC curve. (D) Calibration curve.
Figure 6
Figure 6
GO and KEGG pathway enrichment analysis of cuproptosis-related genes and drug target prediction. (A) KEGG analysis. (B) Drug target prediction. (C) GO analysis of the following components: BP, biological process; CC, cellular component; and MF, molecular function. (D) miRNA–mRNA network diagram of cuproptosis-related genes.
Figure 7
Figure 7
Typing and GSVA of the IS group samples. (A) Heatmap of the expression of cuproptosis-related DEGs in the two IS groups. The abscissa is C1 and C2, and the ordinate is cuproptosis-related DEGs. Blue represents low expression, and red represents high expression. (B) Relative percentages of 22 immune cells between the two subtypes. (C) Comparison of 22 immune cell subtypes between the two subtypes. (D) GSVA between the two subtypes. The vertical axis is the name of the function or pathway, and the horizontal axis is the test value. Red indicates that the biological function is upregulated in C2, and blue indicates that the biological function is upregulated in C1. *P < 0.05, **P < 0.01 and ***P < 0.001.

References

    1. Li Y, Xu QQ, Shan CS, Shi YH, Wang Y, Zheng GQ. Combined use of emodin and ginsenoside Rb1 exerts synergistic neuroprotection in cerebral ischemia/reperfusion rats. Front Pharmacol. (2018) 9:943. 10.3389/fphar.2018.00943 - DOI - PMC - PubMed
    1. Li M, Zhou J, Jin W, Li X, Zhang Y. Danhong injection combined with t-PA improves thrombolytic therapy in focal embolic stroke. Front Pharmacol. (2018) 9:308. 10.3389/fphar.2018.00308 - DOI - PMC - PubMed
    1. Kamtchum-Tatuene J, Jickling GC. Blood biomarkers for stroke diagnosis and management. Neuromolecular Med. (2019) 21:344–68. 10.1007/s12017-019-08530-0 - DOI - PMC - PubMed
    1. Ma Y, Yang S, He Q, Zhang D, Chang J. The role of immune cells in post-stroke angiogenesis and neuronal remodeling: the known and the unknown. Front Immunol. (2021) 12:784098. 10.3389/fimmu.2021.784098 - DOI - PMC - PubMed
    1. Kim BE, Nevitt T, Thiele DJ. Mechanisms for copper acquisition, distribution and regulation. Nat Chem Biol. (2008) 4:176–85. 10.1038/nchembio.72 - DOI - PubMed