Review
. 2022 Dec 12;14(7):1641-1665.
doi: 10.1039/d2sc04397a. eCollection 2023 Feb 15.

Synchrotron radiation based operando characterization of battery materials

Affiliations
Review

Synchrotron radiation based operando characterization of battery materials

Ashley P Black et al. Chem Sci. .

Abstract

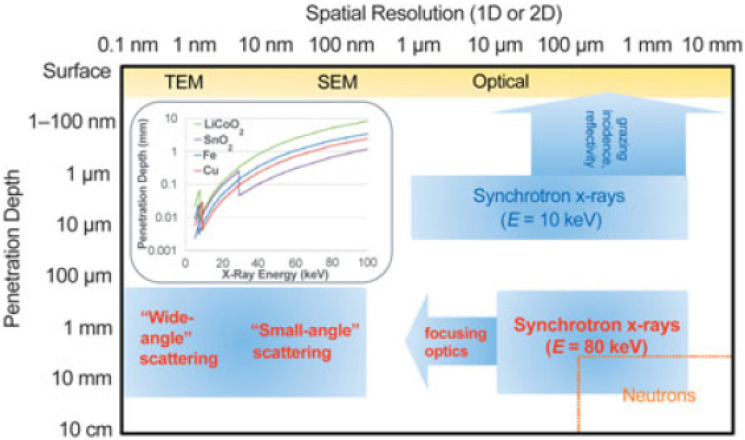
Synchrotron radiation based techniques are powerful tools for battery research and allow probing a wide range of length scales, with different depth sensitivities and spatial/temporal resolutions. Operando experiments enable characterization during functioning of the cell and are thus a precious tool to elucidate the reaction mechanisms taking place. In this perspective, the current state of the art for the most relevant techniques (scattering, spectroscopy, and imaging) is discussed together with the bottlenecks to address, either specific for application in the battery field or more generic. The former includes the improvement of cell designs, multi-modal characterization and development of protocols for automated or at least semi-automated data analysis to quickly process the huge amount of data resulting from operando experiments. Given the recent evolution in these areas, accelerated progress is expected in the years to come, which should in turn foster battery performance improvements.


Conflict of interest statement

There are no conflicts to declare.

Figures

Fig. 1
Fig. 1. Typical penetration depth and spatial resolution (1D and 2D measurements) for selected analytical techniques. The inset depicts 1/e penetration depths for various battery relevant materials as a function of energy (E), where e is Euler's number. TEM and SEM stand for Transmission Electron Microscope and Scanning Electron Microscope, respectively. Reproduced from ref. with permission, © Materials Research Society.
Fig. 2
Fig. 2. Image of a thermalized cell designed taking the one reported in ref. as the basis, modified to enable fluid circulation through the main cell body (top). Diffraction patterns achieved using a similar setup for Na3V2(PO4)2F3 in sodium cells at C/10 and 0 °C, which enabled the phase diagram to be followed upon Na+ deintercalation in 2D (a) and 3D (b) plots. Reproduced from ref. with permission, © WILEY-VCH Verlag GmbH & Co.
Fig. 3
Fig. 3. (a) Experimental setup for in situ grid mapping (white dots) and operando position tracking (red diamonds: P1, P2, and P3) for graphite/LiNi0.5Mn0.3Co0.2O2 (NMC532) single layer pouch cells. (b) Contour plot for NMC532 and LixC6 reflections of interest collected at P3 during charge and discharge. (c) Diffraction line scan across the pressure interface (black dotted line in (a)). (d) The evolution of voltage during the 10th cycle together with selected NMC peaks and cell volumes, with marker sizes indicating phase fractions. Reproduced from ref. with permission, © Elsevier.
Fig. 4
Fig. 4. Two examples of operando quick-scanning XAS: (a) XANES results of LiNi0.33Mn0.33Co0.33O2 at Ni, Co, and Mn K-edges throughout oxidation at a 30C rate. Ni K-edge energy shifts as a function of nominal lithium content x in NMC during oxidation at different rates (1C, 10C, and 30C). Reproduced from ref. with permission ©John Wiley&Sons. (b) Voltage vs. capacity profile for the (CrMnFeNiCu)3O4 HEO electrode, and corresponding XAS spectra which enable changes in the oxidation state/coordination for the involved metal ions to be inferred as a function of the electrode state of charge.
Fig. 5
Fig. 5. (a) Illustration of a novel approach to investigate the SEI on silicon thin-film electrodes in situ through transmission sXAS and (b) extraction of the SEI spectrum from the overshadowing electrolyte spectrum and subtraction of the bubble and beam damage.
Fig. 6
Fig. 6. (a) Scheme of coin cells allowing measuring S K-edge operando in fluorescence mode. (b) Sulfur K-edge XANES evolution as a function of the state of charge followed operando in Na/S batteries and (c) selected spectra at various states during the first cycle with positions for reference compounds highlighted by vertical dotted lines. Reproduced from ref. , © John Wiley&Sons.
Fig. 7
Fig. 7. Schematic representation of the original dip-and-pull method (a) and two variants (b and c) for XPS analysis of solid–liquid interfaces. Some of the electrons generated at the interface cross the liquid meniscus and are collected by the analyzer. Reproduced from ref. .
Fig. 8
Fig. 8. Schematic representation of the ATR-IR pouch cell on a Ge ATR crystal. Reproduced from ref. .
Fig. 9
Fig. 9. Schematic representation of the four discussed techniques. (a) TXM, (b) STXM, (c) projection microscopy and (d) ptychography. In (a), (b) and (d) the numerical aperture (NA), i.e. the maximum angle at which the imaging system is able to collect photons from the sample is reported as a light red angle. The bigger is the NA, the larger will be the maximum collectable spatial frequency, and the smaller will be the spatial resolution in the image. In (c) the different imaging regimes in projection microscopy are given as a function of the ‘defocusing distance’ D = z1 × z2/(z1 + z2). Distances are not to scale.
Fig. 10
Fig. 10. (a) 3D reconstruction of a pristine sulfur electrode showing non-woven carbon paper (NWC, dark grey) and Carbon-Binder Domains (CBD, light grey) coating the sulfur particles (yellow), with CBD partially removed to show sulfur; (b) comparison of absorption and phase contrast slices from the 3D segmentation; (c) combination of absorption and phase contrast segmentation (colours as in (a), except for sulfur, here in white). The star marks the same particle in the three images; (d) absorption X-ray image of the electrode after 2 cycles showing empty CBD shells (1) and white sulfur particles. In contact with the pore space (2) or with the conducting network (3). Reproduced from ref. .
Fig. 11
Fig. 11. Illustration of a 5D Fe K-edge XANES tomography. (a) Schematic of the experimental setup. A tomography data set is collected at different energies across the near Fe K-edge absorption to access chemical information for each voxel. By fitting the resulting spectra as a linear combination of spectra of end-phases, phase composition can be assigned to each voxel (right side). (b) Chemical phase distribution as a function of capacity (proportional to time). Reproduced from ref. .
Fig. 12
Fig. 12. Schematics of an electrochemical cell for operando TEM. The electrodes (WE: working; RE: reference; CE: counter) are connected to an external potentiostat.
Fig. 13
Fig. 13. Comparison between conventional STXM (A and B) and ptychographic (C and D) spectromicroscopy images of LixFePO4 microplatelets. The average optical density (A and C) and the chemical composition map (B and D) where the two chemical components (LiFePO4 and FePO4) are presented in green and red, respectively (scale bar is 1 μm; reconstructed pixel size 5 nm). (E) Point spectra from the dots marked in (B) by conventional STXM (dashed lines) and ptychographic modes (dotted lines with circles). Reference spectra from pure materials (LiFePO4, green solid line; FePO4, red solid line) are also shown for comparison. The conventional STXM spectra show distortions that flatten the sharpest peaks, corresponding to energies where the difference in absorption between phases is maximum. The different attenuation overweighs the more abundant phase and instead the ptychographic spectra more closely match the pure references. Reproduced from ref. .

References

    1. Palacin M. R. Battery Materials Design Essentials. Acc. Mater. Res. 2021;2(5):319–326. doi: 10.1021/accountsmr.1c00026. doi: 10.1021/accountsmr.1c00026. - DOI - DOI
    1. Atkins D. Ayerbe E. Benayad A. et al., Understanding Battery Interfaces by Combined Characterization and Simulation Approaches: Challenges and Perspectives. Adv. Energy Mater. 2022;12(17):2102687. doi: 10.1002/aenm.202102687. doi: 10.1002/aenm.202102687. - DOI - DOI
    1. Atkins D. Capria E. Edström K. et al., Accelerating Battery Characterization Using Neutron and Synchrotron Techniques: Toward a Multi-Modal and Multi-Scale Standardized Experimental Workflow. Adv. Energy Mater. 2022;12(17):2102694. doi: 10.1002/AENM.202102694. doi: 10.1002/aenm.202102694. - DOI - DOI
    1. Lin F. Liu Y. Yu X. et al., Synchrotron X-ray Analytical Techniques for Studying Materials Electrochemistry in Rechargeable Batteries. Chem. Rev. 2017;117(21):13123–13186. doi: 10.1021/acs.chemrev.7b00007. doi: 10.1021/acs.chemrev.7b00007. - DOI - DOI - PubMed
    1. Borkiewicz O. J. Wiaderek K. M. Chupas P. J. Chapman K. W. Best Practices for Operando Battery Experiments: Influences of X-ray Experiment Design on Observed Electrochemical Reactivity. J. Phys. Chem. Lett. 2015;6(11):2081–2085. doi: 10.1021/acs.jpclett.5b00891. doi: 10.1021/acs.jpclett.5b00891. - DOI - DOI - PubMed

LinkOut - more resources