

Global spatiotemporal transmission patterns of human enterovirus 71 from 1963 to 2019
- PMID: 36819972
- PMCID: PMC9927877
- DOI: 10.1093/ve/veab071
Global spatiotemporal transmission patterns of human enterovirus 71 from 1963 to 2019
Abstract
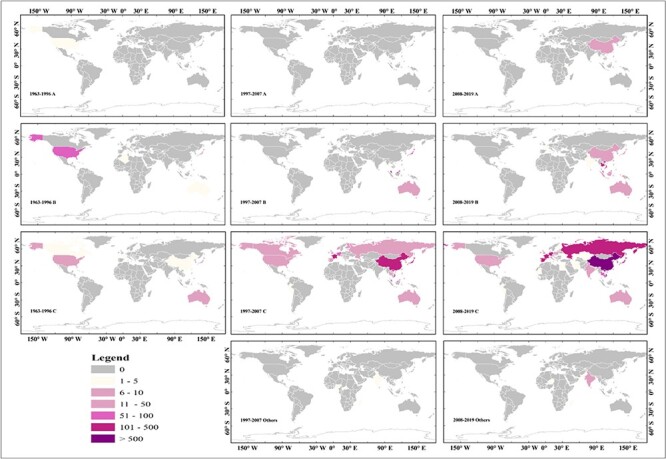
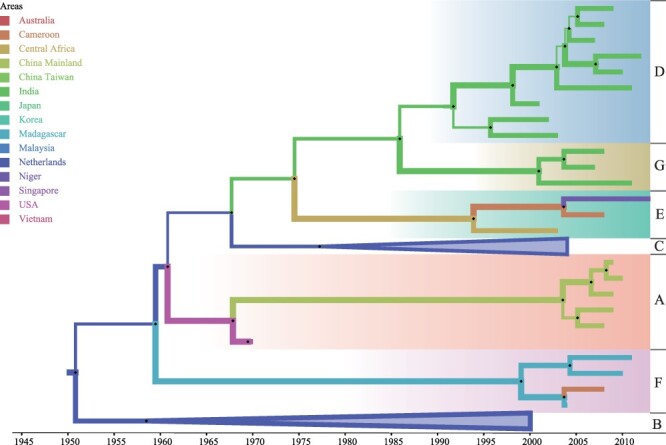
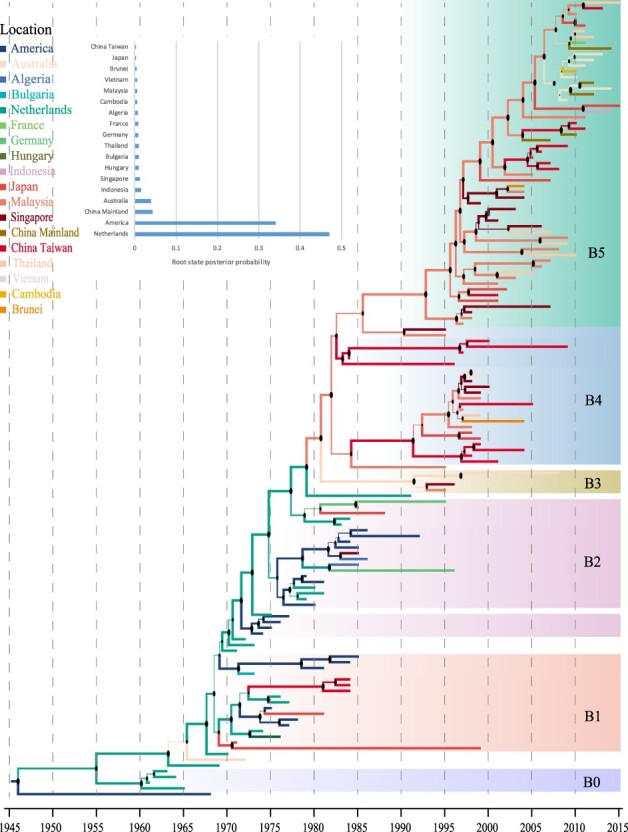
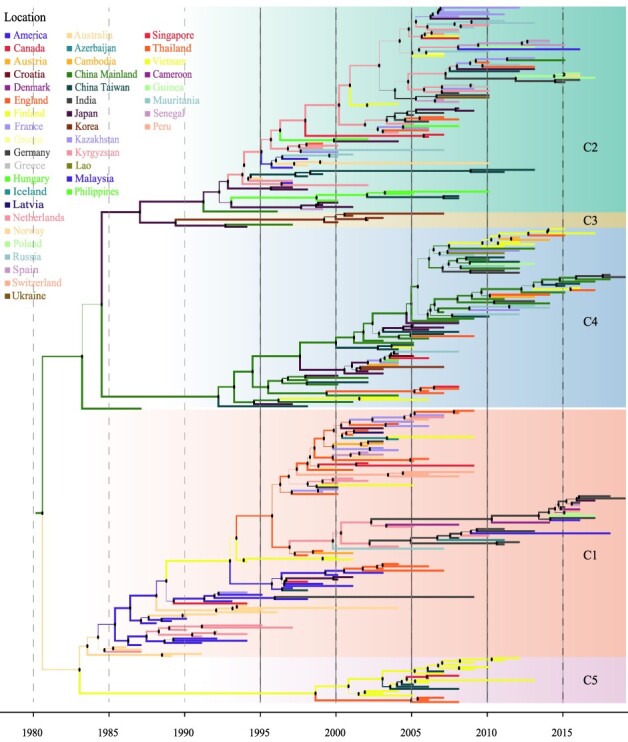
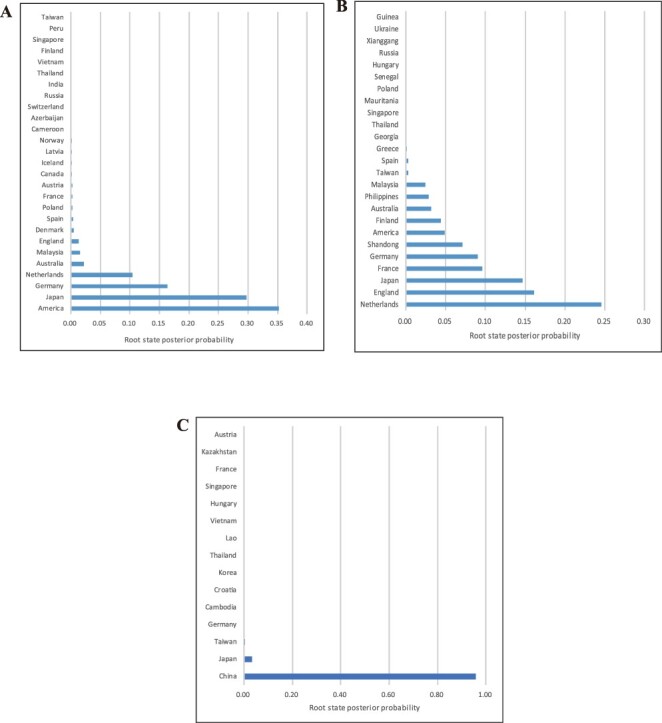
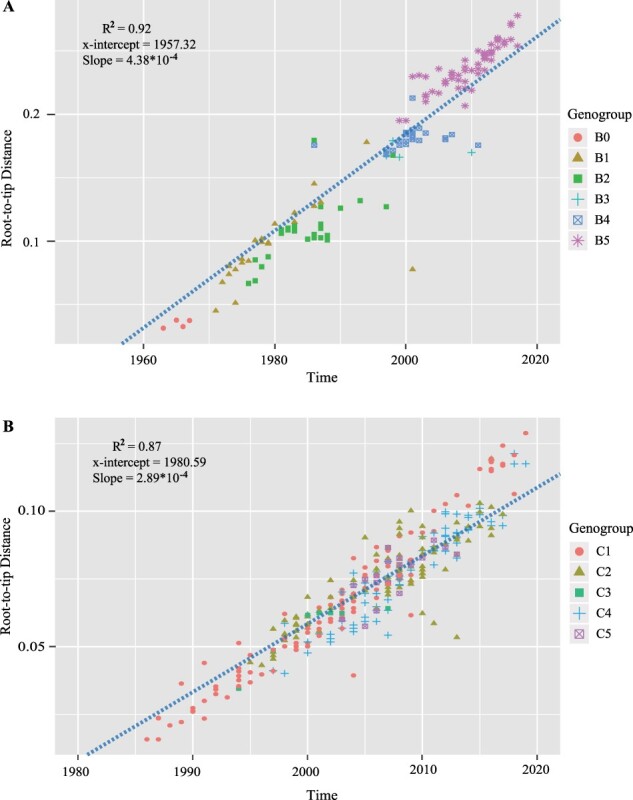
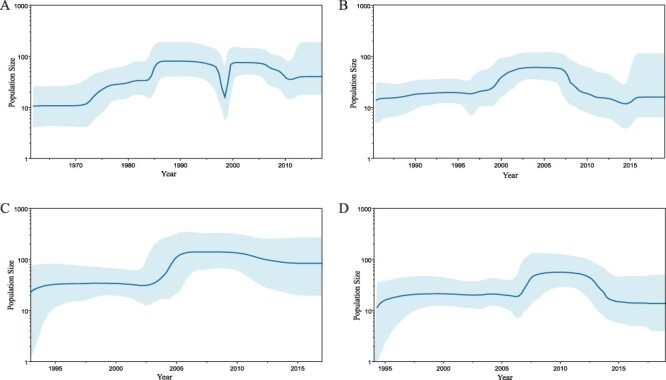
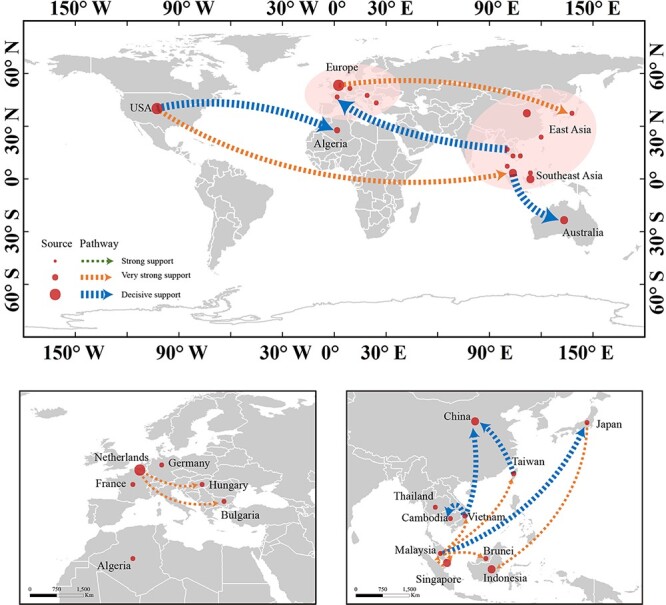
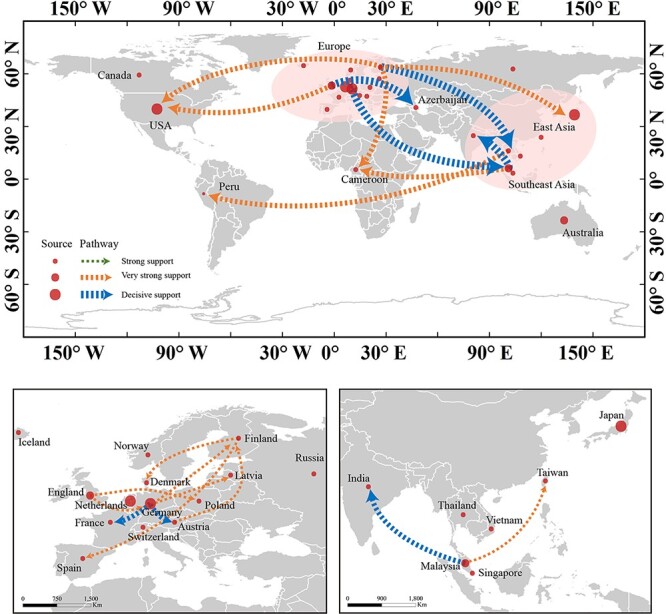
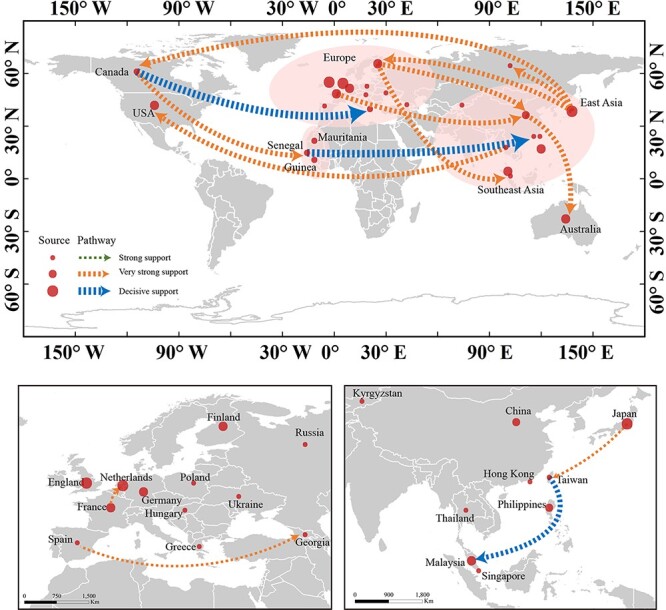
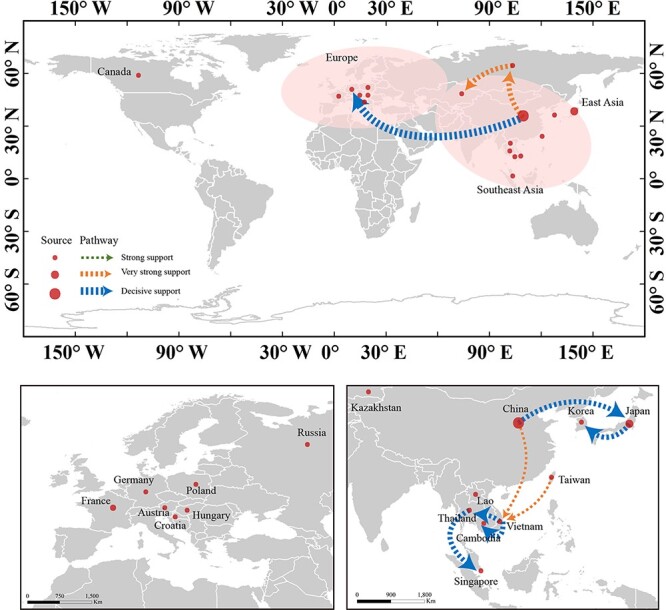
Enterovirus 71 (EV71) can cause large outbreaks of hand, foot, and mouth disease (HFMD) and severe neurological diseases, which is regarded as a major threat to public health, especially in Asia-Pacific regions. However, the global spatiotemporal spread of this virus has not been identified. In this study, we used large sequence datasets and a Bayesian phylogenetic approach to compare the molecular epidemiology and geographical spread patterns of different EV71 subgroups globally. The study found that subgroups of HFMD presented global spatiotemporal variation, subgroups B0, B1, and B2 have caused early infections in Europe and America, and then subgroups C1, C2, C3, and C4 replaced B0-B2 as the predominant genotypes, especially in Asia-Pacific countries. The dispersal patterns of genotype B and subgroup C4 showed the complicated routes in Asia and the source might in some Asian countries, while subgroups C1 and C2 displayed more strongly supported pathways globally, especially in Europe. This study found the predominant subgroup of EV71 and its global spatiotemporal transmission patterns, which may be beneficial to reveal the long-term global spatiotemporal transmission patterns of human EV71 and carry out the HFMD vaccine development.
Keywords: enterovirus 71; foot; hand; mouth disease; phylogeographic analysis; spatial transmission.
© The Author(s) 2021. Published by Oxford University Press.
Conflict of interest statement
The authors declare no conflict of interest. The founding sponsors had no role in the design of the study; in the collection, analyses, or interpretation of data; in the writing of the manuscript, and in the decision to publish the results.
Figures
Similar articles
-
Molecular epidemiology of enterovirus 71 infection in the Western Pacific Region.Pediatr Int. 2004 Apr;46(2):231-5. doi: 10.1046/j.1442-200x.2004.01868.x. Pediatr Int. 2004. PMID: 15056257
-
Transmission patterns of human enterovirus 71 to, from and among European countries, 2003 to 2013.Euro Surveill. 2015;20(34):30005. doi: 10.2807/1560-7917.ES.2015.20.34.30005. Euro Surveill. 2015. PMID: 26530407
-
Hand foot and mouth disease due to enterovirus 71 in Malaysia.Virol Sin. 2011 Aug;26(4):221-8. doi: 10.1007/s12250-011-3195-8. Epub 2011 Aug 17. Virol Sin. 2011. PMID: 21847753 Free PMC article.
-
Coxsackievirus A6: a new emerging pathogen causing hand, foot and mouth disease outbreaks worldwide.Expert Rev Anti Infect Ther. 2015;13(9):1061-71. doi: 10.1586/14787210.2015.1058156. Epub 2015 Jun 25. Expert Rev Anti Infect Ther. 2015. PMID: 26112307 Review.
-
Molecular epidemiology and evolution of human enterovirus 71 and hand, foot and mouth disease.Yi Chuan. 2015 May;37(5):426-35. doi: 10.16288/j.yczz.14-255. Yi Chuan. 2015. PMID: 25998430 Review.
Cited by
-
Deep mutation, insertion and deletion scanning across the Enterovirus A proteome reveals constraints shaping viral evolution.Nat Microbiol. 2025 Jan;10(1):158-168. doi: 10.1038/s41564-024-01871-y. Epub 2024 Nov 28. Nat Microbiol. 2025. PMID: 39609576 Free PMC article.
References
-
- AbuBakar S. et al. (1999) ‘Identification of Enterovirus 71 Isolates from an Outbreak of Hand, Foot and Mouth Disease (HFMD) with Fatal Cases of Encephalomyelitis in Malaysia’, Virus Research, 61: 1–9. - PubMed
-
- Alexander J. P. et al. (1997) ‘Enterovirus 71 Infections and Neurologic Disease—United States, 1977–1991’, The Journal of Infectious Diseases, 169: 905–8. - PubMed
LinkOut - more resources
Full Text Sources
Miscellaneous
