. 2023 Feb 6:4:uqad006.
doi: 10.1093/femsml/uqad006. eCollection 2023.

Mycobacterium tuberculosis infection triggers epigenetic changes that are enriched in a type I IFN signature

Affiliations

Mycobacterium tuberculosis infection triggers epigenetic changes that are enriched in a type I IFN signature

Katrina Madden et al. Microlife. .

Abstract

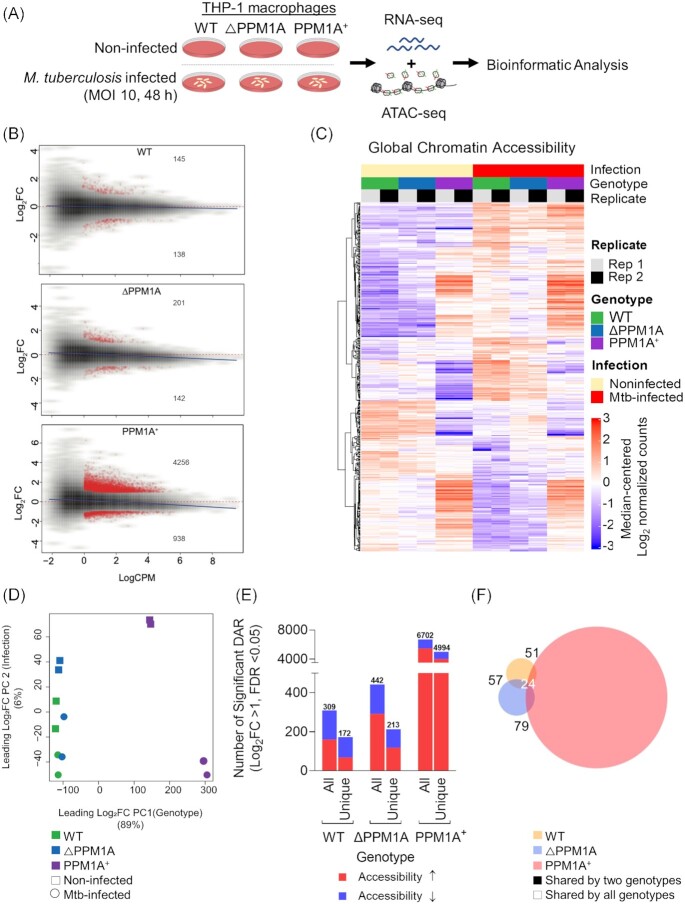
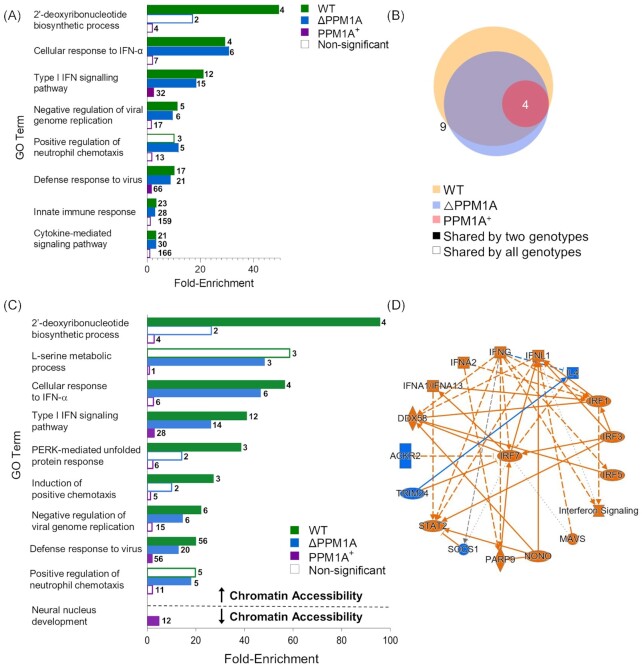
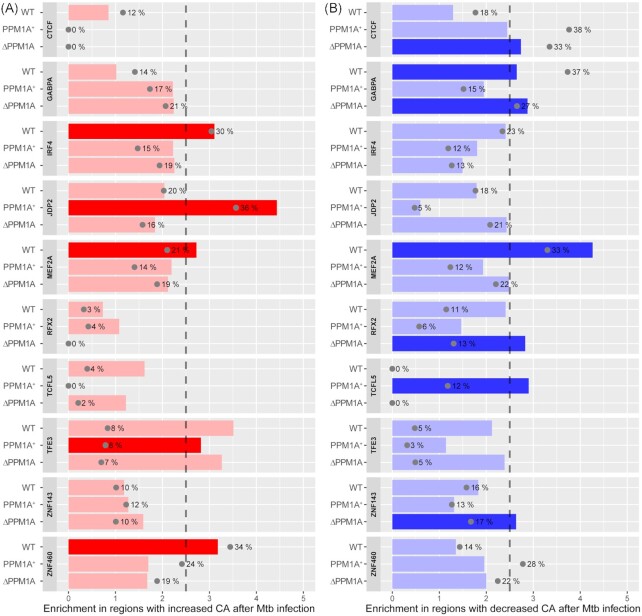
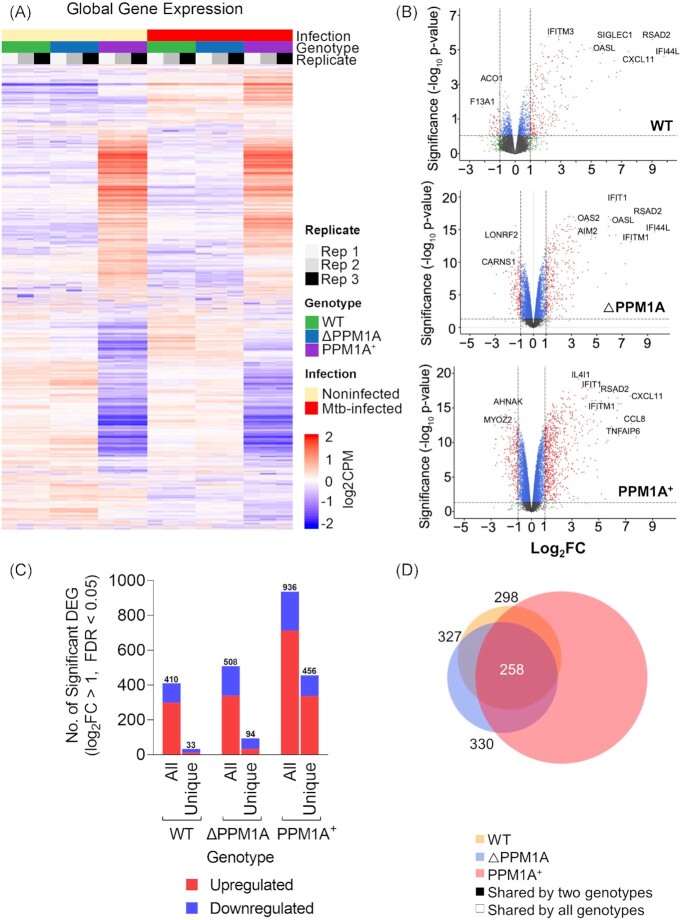
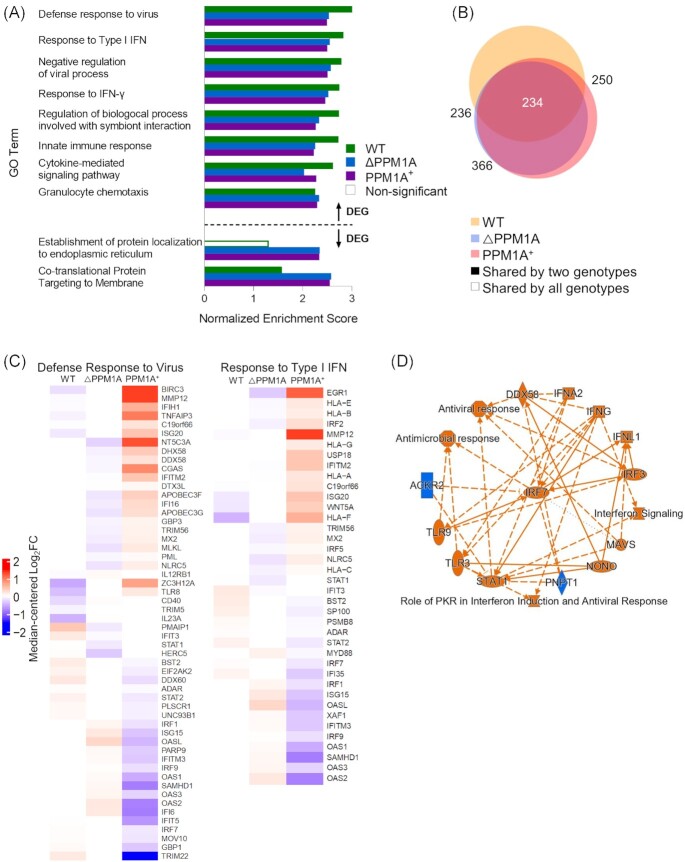
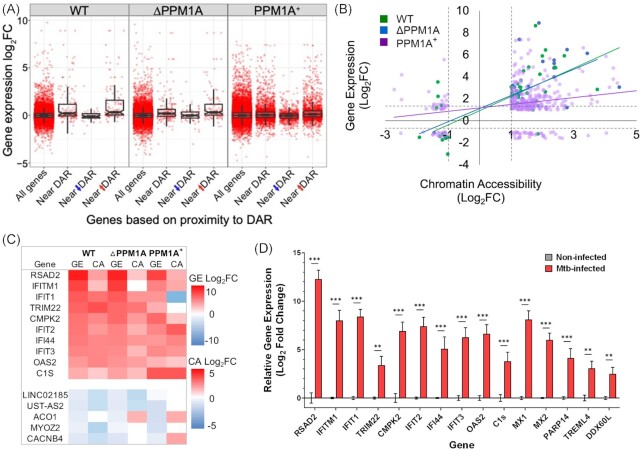
Tuberculosis, a deadly infectious lung disease caused by Mycobacterium tuberculosis (Mtb), remains the leading cause of bacterial disease-related deaths worldwide. Mtb reprograms and disables key antibacterial response pathways, many of which are regulated by epigenetic mechanisms that control the accessibility of chromatin to the transcriptional machinery. Recent reports suggest that host phosphatases, such as PPM1A, contribute to regulating chromatin accessibility during bacterial infections. However, changes in genome-wide chromatin accessibility during Mtb infection and whether PPM1A plays a role in this process remains unknown. Herein, we use combinatorial chromatin accessibility (ATAC-seq) and transcriptomic (RNA-seq) profiling of wild-type, PPM1A knockout and PPM1A overexpressing macrophages to demonstrate that Mtb infection induces global chromatin remodelling consistent with changes in gene expression. The strongest concordant changes to chromatin accessibility and gene expression triggered by Mtb infection were enriched for genes involved in type I interferon (IFN) signalling pathways. A panel of 15 genes with the strongest concordant changes in chromatin accessibility and gene expression were validated to be significantly upregulated in Mtb-infected human monocyte-derived macrophages. PPM1A expression affects chromatin accessibility profiles during Mtb infection that are reflected in the total number, chromosome location, and directionality of change. Transcription factor binding motif analysis revealed enrichment for transcription factors involved in the type I IFN pathway during Mtb infection, including members of the IRF, MEF2, and AP-1 families. Our study shows that altered type I IFN responses in Mtb-infected macrophages occur due to genome-wide changes in chromatin accessibility, and that PPM1A could influence a subset of these signatures.

Keywords: ATAC-seq; Mycobacterium tuberculosis; RNA-seq; chromatin accessibility; epigenome; host-directed therapy; transcriptome; tuberculosis; type I IFN.


Conflict of interest statement

None declared.

Figures

Figure 1.
Figure 1.
Mtb infection induces global chromatin remodelling in macrophages. (A) Experimental schematic. WT, △PPM1A, and PPM1A+ THP-1 macrophages were infected with Mtb mc26206 at an MOI of 10 for 48 h. Then, Mtb-infected and noninfected control macrophages were harvested for ATAC-seq (two independent replicates) and RNA-seq (three independent replicates) in parallel from the same wells. (B) MA plots showing log2 fold-change versus average signal (log of counts per million, logCPM) in Mtb-infected samples compared to controls, in each of three genotypes studied. Peaks with significant chromatin accessibility changes are marked in red. Blue lines represent the general signal trend by loess fit. Red-dotted lines mark the location of identical signal. (C) Heatmap of chromatin accessibility in regions that were significantly differentially accessible in WT cells upon Mtb infection. Chromatin accessibility in WT, △PPM1A, and PPM1A+ macrophages before and after Mtb infection is shown. All ATAC-seq peaks were retained if they had >24 counts in at least two samples. Differential peaks between Mtb-infected WT macrophages and noninfected controls with absolute value of log2FC > 1 and FDR < 0.05 were considered significant. (D) PCA showing significant differential ATAC-peaks separate and cluster together based on the first and second principal components, which are genotype and Mtb infection status, respectively. Genotype accounts for 89% of the variance observed in all significant DAR, and Mtb infection accounts for 6%. (E) Total and unique DAR. The first bar displays the total number of all significant differential peaks in each genotype after Mtb infection, separated by whether chromatin accessibility increased or decreased. The second bar displays the total number of peaks that are unique to each genotype, separated by whether chromatin accessibility increased or decreased. (F) Venn diagram showing the overlap of significant differential peaks between Mtb-infected WT, △PPM1A, and PPM1A+ macrophages and noninfected macrophages.
Figure 2.
Figure 2.
Mtb infection induces changes to chromatin accessibility that are enriched in type I IFN regulatory pathways. (A) GO term enrichment analysis was conducted using GREAT with significant differential peaks in WT, △PPM1A, and PPM1A+ macrophages following Mtb infection. GO terms with FDR < 0.05 were considered significant. GO terms were ranked by enrichment and the top 5 nonredundant terms from each genotype were included. Numbers in bold beside each bar indicate the number of genes that contribute to the enrichment of each pathway. Many of the top 5 nonredundant terms overlapped between genotypes. (B) Venn diagram displaying common significant GO terms between WT, △PPM1A, and PPM1A+ macrophages after Mtb infection. (C) Separate GO enrichment analysis was conducted for chromatin regions where accessibility increased or decreased. Significant DAR in each genotype were split into two groups based on whether chromatin accessibility increased (log2FC > 1) or decreased (log2FC < 1). GO terms were ranked and plotted as in (A). The top 5 nonredundant pathways, where possible, are shown for each genotype. (D) Ingenuity pathway analysis was conducted on all significant DAR for Mtb-infected WT, △PPM1A, and PPM1A+ macrophages. The radial summary graph of DAR in WT macrophages is shown. The nodes and edges are colour coded by predicted activation or inhibition: orange represents ‘predicted activation’ (node) or ‘leads to predicted activation’ (edge), and blue represents ‘predicted inhibition’ (node) or ‘leads to inhibition’ (edge). Arrows represent activation, causation, or modification, and perpendicular lines represent inhibition. Solid lines represent direct interactions, dashed lines represent indirect interactions, and dotted lines represent inferred correlation from machine-based learning. The shapes of the nodes are represented as follows: ovals represent transcription regulators, squares represent cytokines, rectangles represent g-protein-coupled receptors, diamonds represent enzymes, hexagons represent canonical pathways, spheres represent ‘other’. Additional radial summary graphs for △PPM1A and PPM1A+ macrophages are shown in Fig. S5.
Figure 3.
Figure 3.
Transcription factor binding motif enrichment in Mtb-infected macrophages. TF binding motifs across all genotypes that were significantly enriched in ATAC-seq peaks with increased or decreased chromatin accessibility were identified; those with enrichment score >2.5 and FDR < 0.001 were considered significant. (A) Enrichment and significance of the selected motifs in DAR with increased chromatin accessibility. Grey dots indicate the percentage of regions that have at least one hit to the motif. Bright red indicates motifs that are statistically significant. (B) Enrichment for the same motifs as shown in panel A, but within DAR with decreased chromatin accessibility following Mtb infection. Bright blue indicates motifs that are statistically significant.
Figure 4.
Figure 4.
Mtb infection alters gene expression in WT, △PPM1A, and PPM1A+ macrophages. (A) Global gene expression. Heatmap of global gene expression in WT, △PPM1A, and PPM1A+ cells before and after Mtb infection are shown. Genes with log2CPM > 0 counts were considered significantly expressed. (B) Volcano plots displaying DEG in WT, △PPM1A, and PPM1A+ macrophages upon Mtb infection. DEG with absolute value of log2FC > 1 and FDR < 0.05 were considered significant. Gene names of the most striking up and downregulated genes are shown. (C) Graph showing the numbers of total and unique DEG in each genotype. Red or blue bars show the number of DEG that increased or decreased in expression, respectively. (D) Venn diagram showing the overlap of significant DEG between Mtb-infected WT, △PPM1A, and PPM1A+ macrophages and noninfected controls.
Figure 5.
Figure 5.
GSEA identifies a prominent type I IFN signatures in Mtb-infected macrophages. (A) GSEA was conducted to determine gene sets that were enriched in WT, △PPM1A, and PPM1A+ macrophages upon Mtb infection. Results that were GO biological process terms were selected for analysis. GO terms with FDR < 0.05 and a set size of at least 10 genes were considered significant. GO terms were ranked by the absolute value of the normalized enrichment score (NES) and the top 5 nonredundant terms from each genotype were plotted by NES. (B) Venn diagram displaying common significant GO terms between WT, △PPM1A, and PPM1A+ macrophages after Mtb infection. (C) Differentially expressed leading-edge genes. Two highly enriched GO biological process gene sets (‘Response to Type I IFN’ and ‘Defense Response to Virus’) are shown. The corresponding heatmaps display normalized log2FC differential expression values that were median-centred across all samples of the dataset. (D) Ingenuity pathway analysis was conducted on all significant DEG for Mtb-infected WT, △PPM1A, and PPM1A+ macrophages. The radial summary graph of DEG in WT macrophages is shown. The nodes and edges are colour coded by predicted activation or inhibition: orange represents ‘predicted activation’ (node) or ‘leads to predicted activation’ (edge), and blue represents ‘predicted inhibition’ (node) or ‘leads to inhibition’ (edge). Arrows represent activation, causation, or modification, and perpendicular lines represent inhibition. Solid lines represent direct interactions, dashed lines represent indirect interactions, and dotted lines represent inferred correlation from machine-based learning. The shapes of the nodes are represented as follows: ovals represent transcription regulators, squares represent cytokines, rectangles represent g-protein-coupled receptors, diamonds represent enzymes, hexagons represent canonical pathways, spheres represent ‘other’. Radial summary graphs for △PPM1A and PPM1A+ macrophages are shown in Fig. S9.
Figure 6.
Figure 6.
Differential chromatin accessibility is concordant with differential gene expression. (A) Boxplot of DEG that are concordant with DAR in WT, △PPM1A, and PPM1A+ macrophages upon Mtb infection. All DAR were split by whether chromatin accessibility increased or decreased upon Mtb infection and then matched to the gene that they were closest to. Each data point represents one DAR–DEG pair, such that genes with multiple associated peaks have multiple points in the plot. (B) Correlation of DAR and DEG. The log2FC of all DEG in each genotype was plotted against the log2FC of matching DAR. In cases where multiple peaks annotated to the same gene, the peak with the greatest absolute logFC was used. (C) Highest concordant DEG and DAR. The top 10 highest DEG that are concordant with DAR in WT cells upon Mtb infection were ranked by log2FC of gene expression. Log2FC values are displayed for each genotype, even if they were not significant. Heatmap colour scales represent the magnitude of change (log2FC) in either DEG or DAR.(D) Primary hMDMs were infected with Mtb at an MOI of 10 and quantitative real-time PCR was used to measure the relative expression levels of RSAD2, IFITM, IFIT1, 2, 3, TRIM22, CMPK2, IFI44, OAS, MX1, 2, PARP14, TREML4, and DDX60L mRNA 48 h post-infection. The ΔΔCT method was used for data analysis by normalizing the Cq values of each gene with the reference gene ACTB. Relative fold expression was normalized to noninfected hMDM. Error bars represent the mean ± SD of six technical replicates from two independent experiments (three replicates/experiment).

Similar articles

Cited by

References

    1. Arumugam P, Singla M, Lodha R, et al. . Identification and characterization of novel infection associated transcripts in macrophages. RNA Biol. 2021;18:604–11. - PMC - PubMed
    1. Berry MPR, Graham CM, McNab FW, et al. . An interferon-inducible neutrophil-driven blood transcriptional signature in human tuberculosis. Nature. 2010;466:973–7. - PMC - PubMed
    1. Berton S, Chen L, Liang YC, et al. . A selective PPM1A inhibitor activates autophagy to restrict the survival of Mycobacterium tuberculosis. Cell Chem Biol. 2022;29:1126–39.e12. - PubMed
    1. Bhaskar A, Kumar S, Khan MZ, et al. . Host sirtuin 2 as an immunotherapeutic target against tuberculosis. Elife. 2020;9:e55415. - PMC - PubMed
    1. Bosshart H, Heinzelmann M. THP-1 cells as a model for human monocytes. Ann Transl Med. 2016;4:438. - PMC - PubMed