

Identification of iron metabolism-related genes as diagnostic signatures in sepsis by blood transcriptomic analysis
- PMID: 36820206
- PMCID: PMC9938542
- DOI: 10.1515/biol-2022-0549
Identification of iron metabolism-related genes as diagnostic signatures in sepsis by blood transcriptomic analysis
Abstract
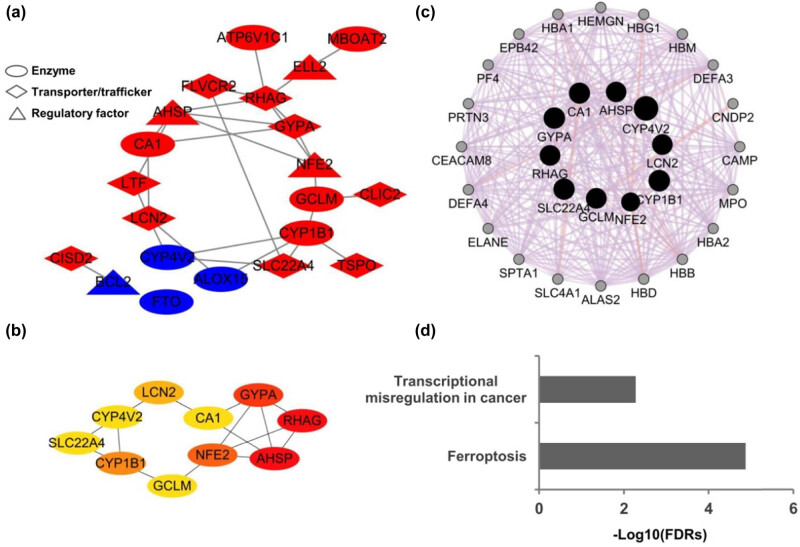
Iron metabolism is considered to play the principal role in sepsis, but the key iron metabolism-related genetic signatures are unclear. In this study, we analyzed and identified the genetic signatures related to the iron-metabolism in sepsis by using a bioinformatics analysis of four transcriptomic datasets from the GEO database. A total of 21 differentially expressed iron metabolism-related signatures were identified including 9 transporters, 8 enzymes, and 4 regulatory factors. Among them, lipocalin 2 was found to have the highest diagnostic value as its expression showed significant differences in all the comparisons including sepsis vs healthy controls, sepsis vs non-sepsis diseases, and mild forms vs severe forms of sepsis. Besides, the cytochrome P450 gene CYP1B1 also showed diagnostic values for sepsis from the non-sepsis diseases. The CYP4V2, LTF, and GCLM showed diagnostic values for distinguishing the severe forms from mild forms of sepsis. Our analysis identified 21 sepsis-associated iron metabolism-related genetic signatures, which may represent diagnostic and therapeutic biomarkers of sepsis, and will improve our understanding of the molecular mechanism underlying the occurrence of sepsis.
Keywords: diagnostic signatures; iron metabolism; lipocalin 2; sepsis; transcriptomic analysis.
© 2023 the author(s), published by De Gruyter.
Conflict of interest statement
Conflict of interest: Authors state no conflict of interest.
Figures


Similar articles
-
Identification of iron metabolism-related genes in the circulation and myocardium of patients with sepsis via applied bioinformatics analysis.Front Cardiovasc Med. 2023 Mar 2;10:1018422. doi: 10.3389/fcvm.2023.1018422. eCollection 2023. Front Cardiovasc Med. 2023. PMID: 36937929 Free PMC article.
-
Identification of key genes related to immune cells in patients with gram-negative sepsis based on weighted gene co-expression network analysis.Ann Transl Med. 2022 Jul;10(14):787. doi: 10.21037/atm-22-3307. Ann Transl Med. 2022. PMID: 35965814 Free PMC article.
-
Identification of immune-related endoplasmic reticulum stress genes in sepsis using bioinformatics and machine learning.Front Immunol. 2022 Sep 20;13:995974. doi: 10.3389/fimmu.2022.995974. eCollection 2022. Front Immunol. 2022. PMID: 36203606 Free PMC article.
-
Retrospective analysis: reproducibility of interblastomere differences of mRNA expression in 2-cell stage mouse embryos is remarkably poor due to combinatorial mechanisms of blastomere diversification.Mol Hum Reprod. 2018 Jul 1;24(7):388-400. doi: 10.1093/molehr/gay021. Mol Hum Reprod. 2018. PMID: 29746690
-
Precision Medicine for Neonatal Sepsis.Front Mol Biosci. 2018 Jul 26;5:70. doi: 10.3389/fmolb.2018.00070. eCollection 2018. Front Mol Biosci. 2018. PMID: 30094238 Free PMC article. Review.
Cited by
-
The Diagnostic Utility of Host RNA Biosignatures in Adult Patients With Sepsis: A Systematic Review and Meta-Analysis.Crit Care Explor. 2025 Jan 31;7(2):e1212. doi: 10.1097/CCE.0000000000001212. eCollection 2025 Feb 1. Crit Care Explor. 2025. PMID: 39888601 Free PMC article.
-
Cytochrome P450 (CYP) 1 enzymes in acute lung injury: from molecular insights to therapeutic implications.Redox Rep. 2025 Dec;30(1):2550807. doi: 10.1080/13510002.2025.2550807. Epub 2025 Sep 2. Redox Rep. 2025. PMID: 40897326 Free PMC article. Review.
-
Uropathogenic Escherichia coli Associated with Risk of Urosepsis-Genetic, Proteomic, and Metabolomic Studies.Int J Mol Sci. 2025 Jun 13;26(12):5681. doi: 10.3390/ijms26125681. Int J Mol Sci. 2025. PMID: 40565144 Free PMC article.
References
LinkOut - more resources
Full Text Sources
Research Materials
Miscellaneous