

The Biological Processes of Ferroptosis Involved in Pathogenesis of COVID-19 and Core Ferroptoic Genes Related With the Occurrence and Severity of This Disease
- PMID: 36820229
- PMCID: PMC9929189
- DOI: 10.1177/11769343231153293
The Biological Processes of Ferroptosis Involved in Pathogenesis of COVID-19 and Core Ferroptoic Genes Related With the Occurrence and Severity of This Disease
Abstract
Background: A worldwide outbreak of coronavirus disease 2019 (COVID-19) has resulted in millions of deaths. Ferroptosis is a form of iron-dependent cell death which is characterized by accumulation of lipid peroxides on cellular membranes, and is related with many physiological and pathophysiological processes of diseases such as cancer, inflammation and infection. However, the role of ferroptosis in COVID-19 has few been studied.
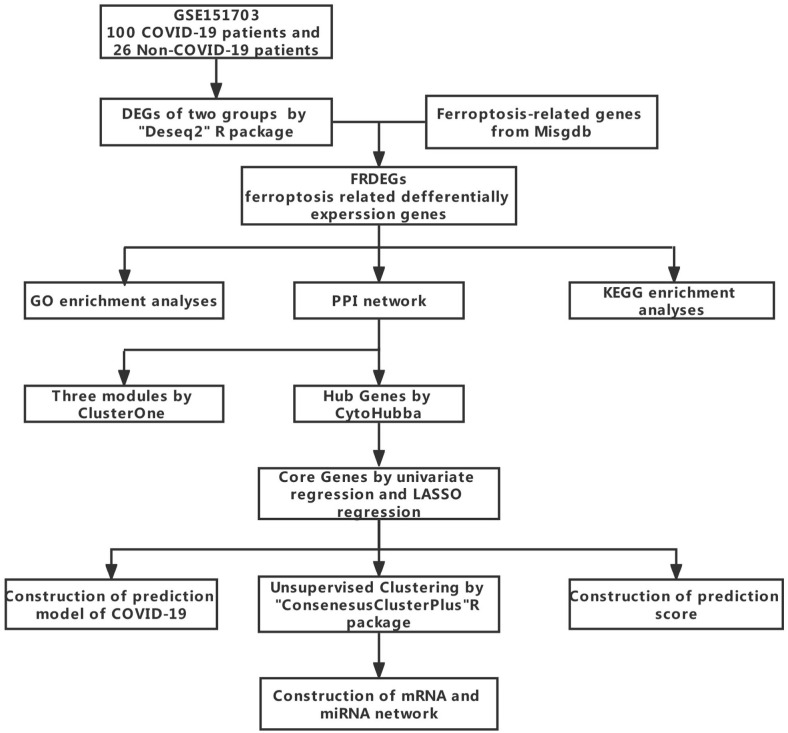
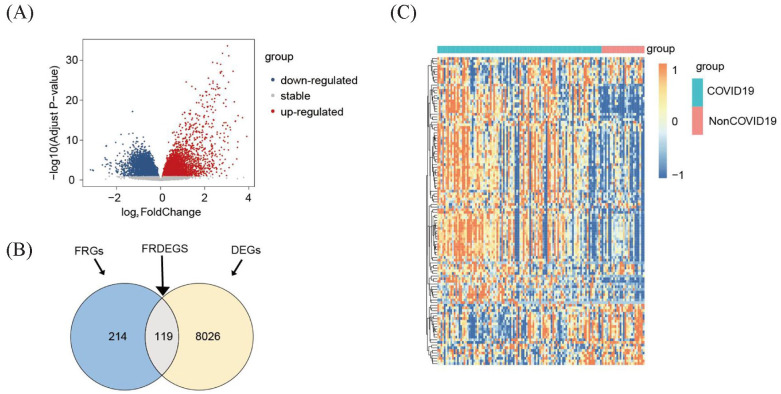
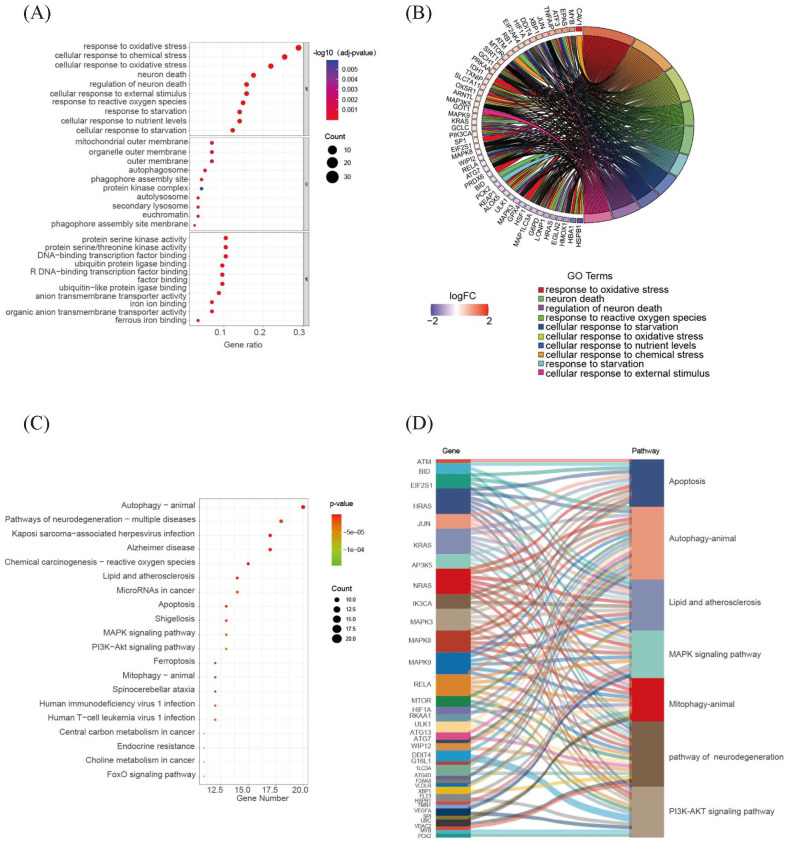
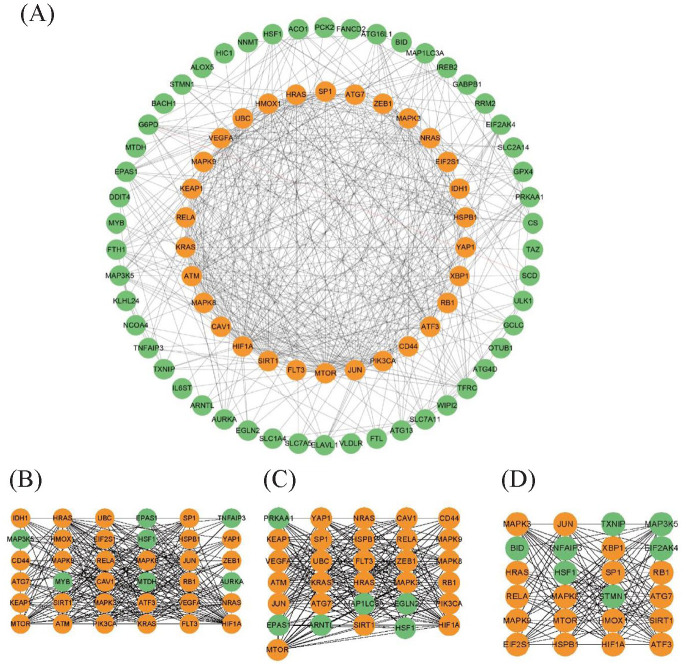
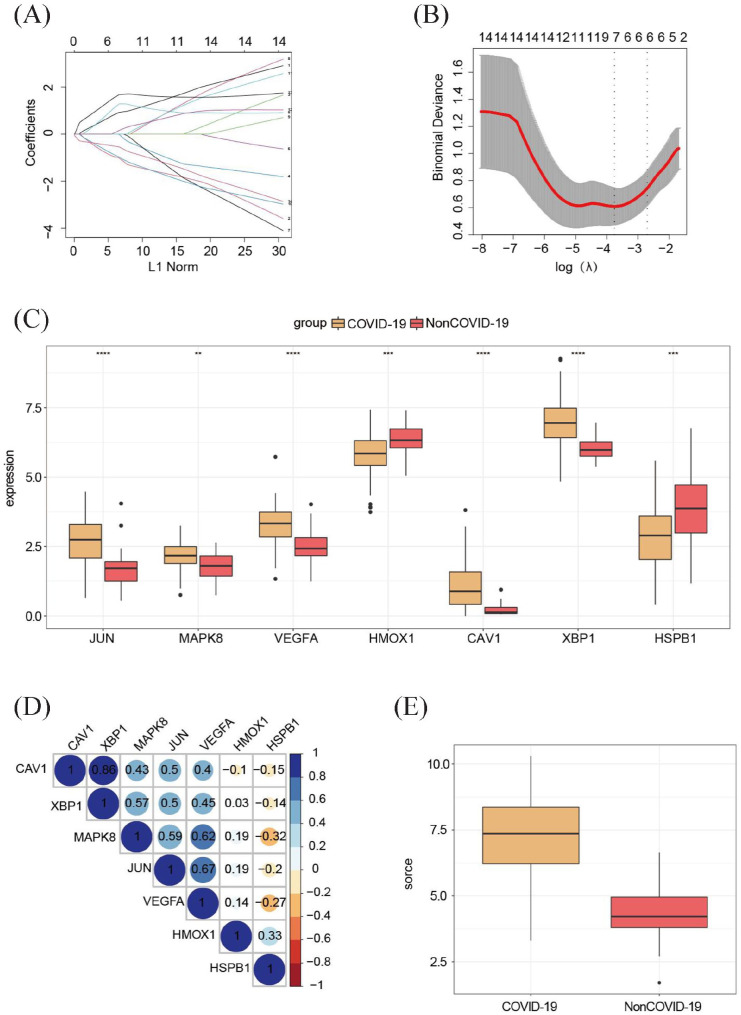
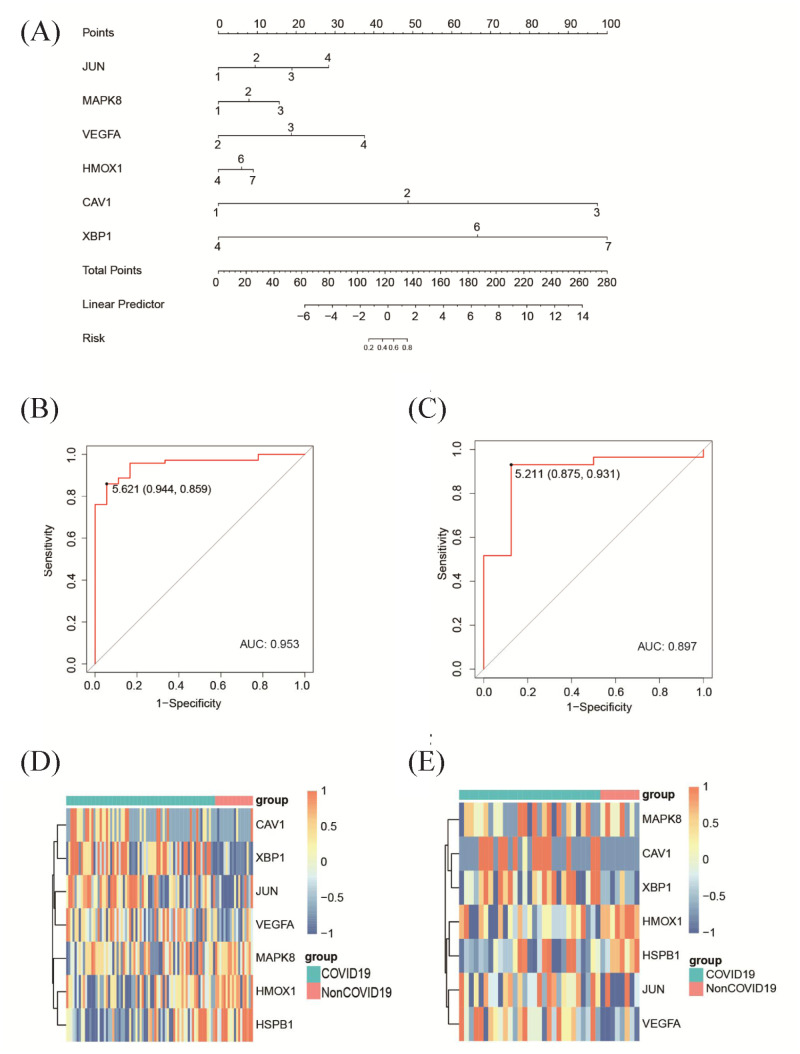
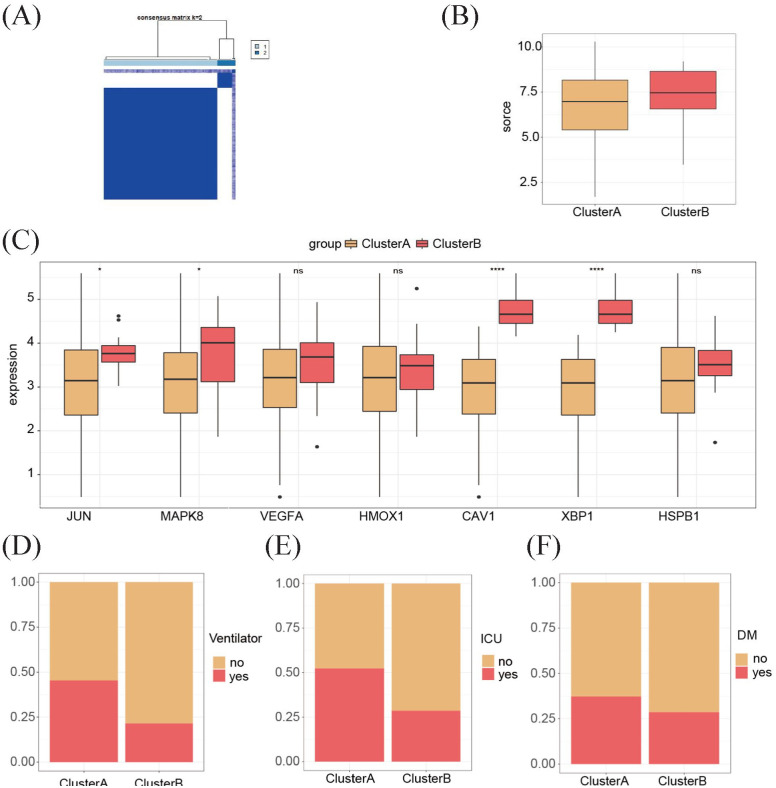
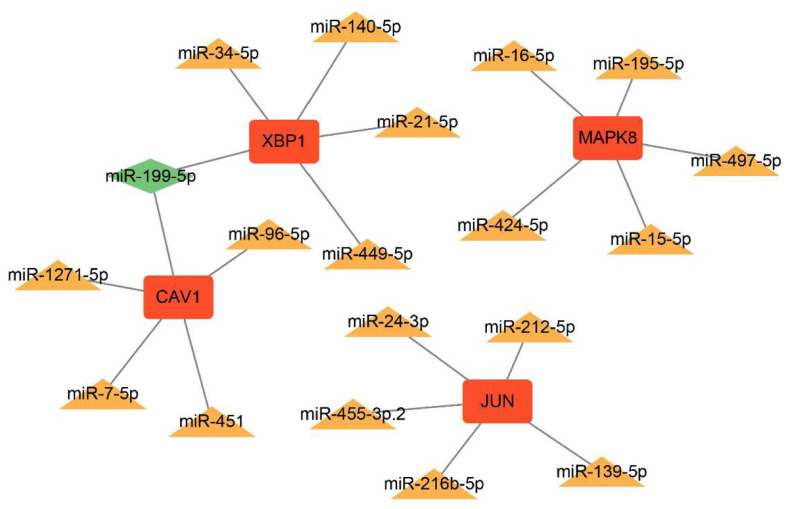
Material and method: Based on the RNA-seq data of 100 COVID-19 cases and 26 Non-COVID-19 cases from GSE157103, we identified ferroptosis related differentially expressed genes (FRDEGs, adj.P-value < .05) using the "Deseq2" R package. By using the "clusterProfiler" R package, we performed Gene Ontology (GO) and Kyoto Encyclopedia of Genes and Genomes (KEGG) pathway enrichment. Next, a protein-protein interaction (PPI) network of FRDEGs was constructed and top 30 hub genes were selected by cytoHubba in Cytoscape. Subsequently, we established a prediction model for COVID-19 by utilizing univariate logistic regression and the least absolute shrinkage and selection operator (LASSO) regression. Based on core FRDEGs, COVID-19 patients were identified as two clusters using the "ConsenesusClusterPlus" R package. Finally, the miRNA-mRNA network was built by Targetscan online database and visualized by Cytoscape software.
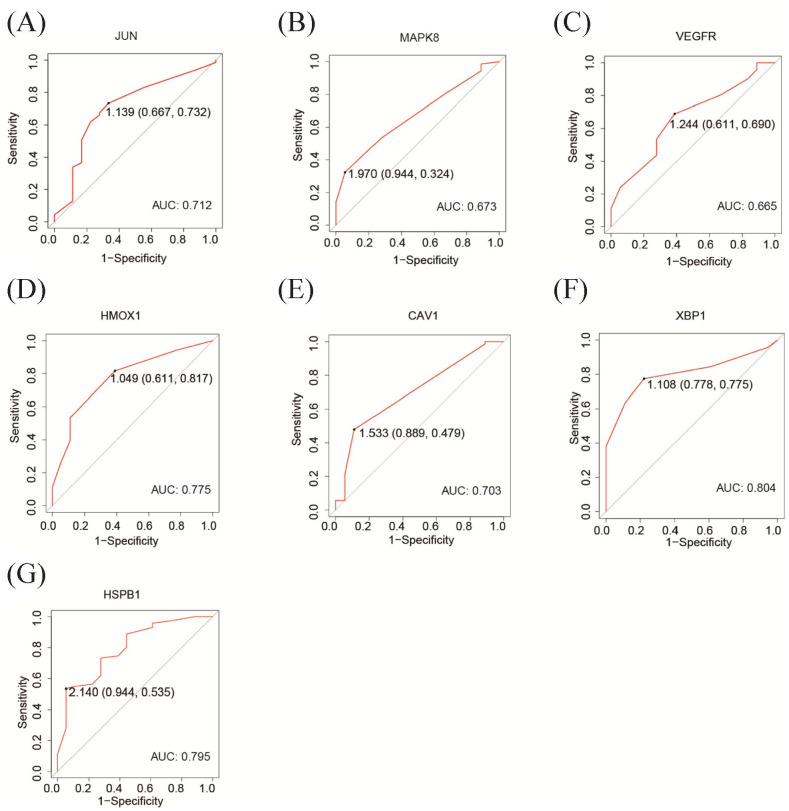
Results: A total of 119 FRDEGs were identified and the GO and KEGG enrichment analyses showed the most important biologic processes are oxidative stress response, MAPK and PI3K-AKT signaling pathway. The top 30 hub genes were selected, and finally, 7 core FRDEGs (JUN, MAPK8, VEGFA, CAV1, XBP1, HMOX1, and HSPB1) were found to be associated with the occurrence of COVID-19. Next, the two patterns of COVID-19 patients had constructed and the cluster A patients were likely to be more severe.
Conclusion: Our study suggested that ferroptosis was involved in the pathogenesis of COVID-19 disease and the functions of core FRDEGs may become a new research aspect of this disease.
Keywords: Coronavirus disease (COVID-19); RNA network; biological process; ferroptosis; prediction model.
© The Author(s) 2023.
Conflict of interest statement
The author(s) declared no potential conflicts of interest with respect to the research, authorship, and/or publication of this article.
Figures
Similar articles
-
Identification and validation of ferroptosis-related gene signature in intervertebral disc degeneration.Front Endocrinol (Lausanne). 2023 Feb 6;14:1089796. doi: 10.3389/fendo.2023.1089796. eCollection 2023. Front Endocrinol (Lausanne). 2023. PMID: 36814575 Free PMC article.
-
Identification of Ferroptosis-Inflammation Related Hub Genes and the Disease Subtypes in Idiopathic Pulmonary Fibrosis via System Biology Approaches.Mol Biotechnol. 2025 Apr;67(4):1720-1733. doi: 10.1007/s12033-024-01158-x. Epub 2024 May 11. Mol Biotechnol. 2025. PMID: 38734841
-
Identification of Ferroptosis-Related Genes in Heart Failure Induced by Transverse Aortic Constriction.J Inflamm Res. 2023 Oct 31;16:4899-4912. doi: 10.2147/JIR.S433387. eCollection 2023. J Inflamm Res. 2023. PMID: 37927963 Free PMC article.
-
An in-Depth Exploration of the Genetic Interaction Network Between Ferroptosis and Acute Pancreatitis.J Inflamm Res. 2023 Oct 6;16:4425-4439. doi: 10.2147/JIR.S431601. eCollection 2023. J Inflamm Res. 2023. PMID: 37822529 Free PMC article.
-
Integrated miRNA-mRNA network revealing the key molecular characteristics of ossification of the posterior longitudinal ligament.Medicine (Baltimore). 2020 May 22;99(21):e20268. doi: 10.1097/MD.0000000000020268. Medicine (Baltimore). 2020. PMID: 32481304 Free PMC article.
Cited by
-
Identification of cuproptosis-related molecular subtypes and a novel predictive model of COVID-19 based on machine learning.Front Immunol. 2023 Jul 17;14:1152223. doi: 10.3389/fimmu.2023.1152223. eCollection 2023. Front Immunol. 2023. PMID: 37533853 Free PMC article.
-
Fatal COVID-19 pulmonary disease involves ferroptosis.Nat Commun. 2024 May 20;15(1):3816. doi: 10.1038/s41467-024-48055-0. Nat Commun. 2024. PMID: 38769293 Free PMC article.
References
-
- Ochani R, Asad A, Yasmin F, et al.. COVID-19 pandemic: from origins to outcomes. A comprehensive review of viral pathogenesis, clinical manifestations, diagnostic evaluation, and management. Infez Med. 2021;29:20-36. - PubMed
LinkOut - more resources
Full Text Sources
Research Materials
Miscellaneous
