Confronting the vector leptoquark hypothesis with new low- and high-energy data
- PMID: 36820274
- PMCID: PMC9935689
- DOI: 10.1140/epjc/s10052-023-11304-5
Confronting the vector leptoquark hypothesis with new low- and high-energy data
Abstract
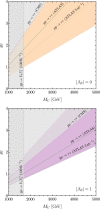
In light of new data we present an updated phenomenological analysis of the simplified -leptoquark model addressing charged-current B-meson anomalies. The analysis shows a good compatibility of low-energy data (dominated by the lepton flavor universality ratios and ) with the high-energy constraints posed by Drell-Yan data. We also show that present data are well compatible with a framework where the leptoquark couples with similar strength to both left- and right-handed third-generation fermions, a scenario that is well-motivated from a model building perspective. We find that the high-energy implications of this setup will be probed at the 95% confidence level in the high-luminosity phase of the LHC.
© The Author(s) 2023.
Figures


Similar articles
-
Mono-τ Signatures at the LHC Constrain Explanations of B-decay Anomalies.Phys Rev Lett. 2019 Apr 5;122(13):131803. doi: 10.1103/PhysRevLett.122.131803. Phys Rev Lett. 2019. PMID: 31012623
-
B Meson Anomalies in a Pati-Salam Model within the Randall-Sundrum Background.Phys Rev Lett. 2018 Jul 6;121(1):011801. doi: 10.1103/PhysRevLett.121.011801. Phys Rev Lett. 2018. PMID: 30028146
-
Lepton flavor violation and dilepton tails at the LHC.Eur Phys J C Part Fields. 2020;80(7):641. doi: 10.1140/epjc/s10052-020-8210-5. Epub 2020 Jul 19. Eur Phys J C Part Fields. 2020. PMID: 32831630 Free PMC article.
-
The minimal seesaw and leptogenesis models.Rep Prog Phys. 2021 Apr 30;84(6). doi: 10.1088/1361-6633/abf086. Rep Prog Phys. 2021. PMID: 33740777 Review.
-
The scientific potential and technological challenges of the High-Luminosity Large Hadron Collider program.Rep Prog Phys. 2022 Mar 29;85(4). doi: 10.1088/1361-6633/ac5106. Rep Prog Phys. 2022. PMID: 35105832 Review.
Cited by
-
Flavored circular collider: cornering New Physics at FCC-ee via flavor-changing processes.Eur Phys J C Part Fields. 2025;85(6):631. doi: 10.1140/epjc/s10052-025-14359-8. Epub 2025 Jun 9. Eur Phys J C Part Fields. 2025. PMID: 40502984 Free PMC article.
References
-
- R. Alonso, B. Grinstein, J. Martin Camalich, JHEP 10, 184 (2015). 10.1007/JHEP10(2015)184. arXiv:1505.05164 [hep-ph]
-
- Barbieri R, Isidori G, Pattori A, Senia F. Eur. Phys. J. C. 2016;76:67. doi: 10.1140/epjc/s10052-016-3905-3. - DOI
-
- Bhattacharya B, Datta A, Guévin J-P, London D, Watanabe R. JHEP. 2017;01:015. doi: 10.1007/JHEP01(2017)015. - DOI
-
- Buttazzo D, Greljo A, Isidori G, Marzocca D. JHEP. 2017;11:044. doi: 10.1007/JHEP11(2017)044. - DOI
LinkOut - more resources
Full Text Sources
Miscellaneous
