. 2023 Jan 26;10(2):544-551.
doi: 10.1021/acsphotonics.2c01971. eCollection 2023 Feb 15.

Metasurface-Enabled 3-in-1 Microscopy

Affiliations

Metasurface-Enabled 3-in-1 Microscopy

Yuttana Intaravanne et al. ACS Photonics. .

Abstract

Edge enhancement and polarization detection are critical to image transparent or low-contrast samples. However, currently available systems are limited to performing only a single functionality. To meet the requirement of system integration, there is a pressing need for a microscope with multiple functionalities. Here, we propose and develop a microscope with three different functionalities based on spatial multiplexing and polarization splitting. A novel geometric metasurface (MS) is used to realize a spiral phase profile and two phase gradient profiles along two vertical directions, which can perform such an extremely challenging optical task. This is the first demonstration of a 3-in-1 microscope that can simultaneously obtain five images with different optical properties in an imaging plane for the same sample. Imaging experiments with different samples verify its capability to simultaneously perform edge imaging, polarimetric imaging, and conventional microscope imaging. Benefiting from the compactness and multifunctionality of the optical MS device, the integration does not increase the volume of the microscope. This approach can enable users to visualize the multiple facets of samples in real-time.


Conflict of interest statement

The authors declare no competing financial interest.

Figures

Figure 1
Figure 1
Schematic of the MS device for multifunctional microscopy. The imaging system is a Fourier transform setup, where the multifunctional MS is located in the Fourier plane. When a light beam shines on an object, five images with different optical properties are generated in the imaging plane. Along the horizontal direction, two intensity images with different circular polarizations are symmetrically distributed with respect to the normal microscope image in the middle, which arises from the non-converted part of light passing through the MS. The two intensity images with opposite circular polarizations are used to construct a polarization image, which contains spatially variant polarization information. Two edge-enhanced images with a dark background and different circular polarizations are symmetrically distributed along the vertical direction.
Figure 2
Figure 2
Design principle, fabricated MS, and experimental setup. (a) Geometric parameters of the phase gradient along the horizontal direction and the off-axis spiral phase profile (topological charge formula image) along the vertical direction. Under the illumination of LP light at 600 nm, the half off-axis angles Θh and Θv are 9.5 and 8.2°, respectively. (b) Calculated phase profile of the designed MS. (c) SEM image of the fabricated device. (d) Experimental diagram to perform a Fourier transform. P1 and P2: linear polarizers, Obj.1, Obj.2, and Obj.3: 20× objective lenses (working distance 19 mm), L1 and L2: convex lenses (f = 75 mm), aperture: rectangular aperture (2.5 × 2.0 mm2), MS: metasurface, and CCD: charge-coupled device.
Figure 3
Figure 3
Experimental results with different polarization states of the incident light beam. (a) Captured images without a sample. Captured images of the number “5” on the negative USAF 1951 test target at different polarization states, including (b) LCP, (c) LEP, (d) LP, (e) REP, and (f) RCP. The transmission axis of the analyzer is along the horizontal direction. (g) The angle between the transmission axis of the analyzer and the x axis is 85°. The purple arrows and white double arrows represent the polarization states of the incident light beam and the transmission axes of the analyzer, respectively. The image intensities rise and fall according to the polarization state of the incident light since a completely polarized light beam can be decomposed into LCP and RCP components. (h) Captured images on the left and right sides are selected and converted to grayscale format for calculating the ellipticity η. A black scale bar is 300 μm. A color bar is used to represent the calculated ellipticity η shown in the inset of figure (b–g). (i) Experimentally measured ellipticities η of the number “5” vs γ (the angle between the transmission axis of a polarizer and the fast axis of a QWP). The solid curve and discreet triangles represent the simulation and experimental results, respectively. (j) A Poincaré sphere is used to show the experimentally measured polarization states (red triangles) of the incident light and theoretical data (blue solid curve).
Figure 4
Figure 4
Resolution analysis, broadband performance, and imaging performance of the multifunctional microscope. Images obtained at the wavelengths of (a) 500, (b) 550, (c) 585, and (d) 700 nm. The angle between the transmission axis of the analyzer and the x-axis is 90°. (e) Polarization and edge images of cheek cells at the wavelength of 600 nm from the five positions of the captured image. Experimental results for the beef tendon at 600 nm are shown in (f), including the images from the five positions of the captured image, and the calculated ellipticity η. Scale bars are 150 μm.
Figure 5
Figure 5
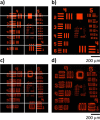
Large field size imaging with a scanning system-aided multifunctional microscope. (a) Original LCP image on the left of the imaging plane and (b) large LCP image of the resolution target based on the stitching of multiple images. (c) Original LCP edge image and (d) large LCP edge image of the resolution target. Scale bars are 200 μm.

References

    1. Zernike F. How I Discovered Phase Contrast. Science 1955, 121, 345–349. 10.1126/science.121.3141.345. - DOI - PubMed
    1. Popescu G.Quantitative Phase Imaging of Cells and Tissues, 1st ed.; McGraw-Hill Education: New York, 2011.
    1. Park Y.; Depeursinge C.; Popescu G. Quantitative phase imaging in biomedicine. Nat. Photonics 2018, 12, 578–589. 10.1038/s41566-018-0253-x. - DOI
    1. Huo P.; Zhang C.; Zhu W.; Liu M.; Zhang S.; Zhang S.; Chen L.; Lezec H. J.; Agrawal A.; Lu Y.; Xu T. Photonic Spin-Multiplexing Metasurface for Switchable Spiral Phase Contrast Imaging. Nano Lett. 2020, 20, 2791–2798. 10.1021/acs.nanolett.0c00471. - DOI - PMC - PubMed
    1. Zernike F.; Stratton F. J. M. Diffraction Theory of the Knife-Edge Test and its Improved Form, The Phase-Contrast Method. Mon. Not. R. Astron. Soc. 1934, 94, 377–384. 10.1093/mnras/94.5.377. - DOI