Ferroptosis in Rat Lung Tissue during Severe Acute Pancreatitis-Associated Acute Lung Injury: Protection of Qingyi Decoction
- PMID: 36820405
- PMCID: PMC9938780
- DOI: 10.1155/2023/5827613
Ferroptosis in Rat Lung Tissue during Severe Acute Pancreatitis-Associated Acute Lung Injury: Protection of Qingyi Decoction
Abstract
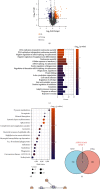
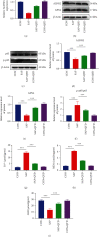
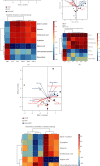
Qingyi decoction (QYD) has anti-inflammatory pharmacological properties and substantial therapeutic benefits on severe acute pancreatitis (SAP) in clinical practice. However, its protective mechanism against SAP-associated acute lung injury (ALI) remains unclear. In this study, we screened the active ingredients of QYD from the perspective of network pharmacology to identify its core targets and signaling pathways against SAP-associated ALI. Rescue experiments were used to determine the relationship between QYD and ferroptosis. Then, metabolomics and 16s rDNA sequencing were used to identify differential metabolites and microbes in lung tissue. Correlation analysis was utilized to explore the relationship between core targets, signaling pathways, metabolic phenotypes, and microbial flora, sorting out the potential molecular network of QYD against SAP-associated lung ALI. Inflammatory damage was caused by SAP in the rat lung. QYD could effectively alleviate lung injury, improve respiratory function, and significantly reduce serum inflammatory factor levels in SAP rats. Network pharmacology and molecular docking identified three key targets: ALDH2, AnxA1, and ICAM-1. Mechanistically, QYD may inhibit ferroptosis by promoting the ALDH2 expression and suppress neutrophil infiltration by blocking the cleavage of intact AnxA1 and downregulating ICAM-1 expression. Ferroptosis activator counteracts the pulmonary protective effect of QYD in SAP rats. In addition, seven significant differential metabolites were identified in lung tissues. QYD relatively improved the lung microbiome's abundance in SAP rats. Further correlation analysis determined the correlation between ferroptosis, differential metabolites, and differential microbes. In this work, the network pharmacology, metabolomics, and 16s rDNA sequencing were integrated to uncover the mechanism of QYD against SAP-associated ALI. This novel integrated method may play an important role in future research on traditional Chinese medicine.
Copyright © 2023 Peng Ge et al.
Conflict of interest statement
The authors declare no conflict of interest.
Figures


Similar articles
-
Regulation of Microtubule Stability in Pulmonary Microvascular Endothelial Cells in Rats with Severe Acute Pancreatitis: Qingyi Decoction is a Potential CDK5 Inhibitor.J Inflamm Res. 2024 Apr 24;17:2513-2530. doi: 10.2147/JIR.S451755. eCollection 2024. J Inflamm Res. 2024. PMID: 38699595 Free PMC article.
-
Mechanisms of Qingyi Decoction in Severe Acute Pancreatitis-Associated Acute Lung Injury via Gut Microbiota: Targeting the Short-Chain Fatty Acids-Mediated AMPK/NF-κB/NLRP3 Pathway.Microbiol Spectr. 2023 Aug 17;11(4):e0366422. doi: 10.1128/spectrum.03664-22. Epub 2023 Jun 20. Microbiol Spectr. 2023. PMID: 37338348 Free PMC article.
-
Network Pharmacology Analysis and Retrospective Cohort Study Revealing the Effect of Qingyi Decoction on Intestinal Paralysis in Patients with Severe Acute Pancreatitis.Curr Pharm Des. 2024;30(42):3322-3338. doi: 10.2174/0113816128319149240812103715. Curr Pharm Des. 2024. PMID: 39225216
-
Intestinal barrier damage, systemic inflammatory response syndrome, and acute lung injury: A troublesome trio for acute pancreatitis.Biomed Pharmacother. 2020 Dec;132:110770. doi: 10.1016/j.biopha.2020.110770. Epub 2020 Oct 2. Biomed Pharmacother. 2020. PMID: 33011613 Review.
-
From pancreas to lungs: The role of immune cells in severe acute pancreatitis and acute lung injury.Immun Inflamm Dis. 2024 Jul;12(7):e1351. doi: 10.1002/iid3.1351. Immun Inflamm Dis. 2024. PMID: 39023414 Free PMC article. Review.
Cited by
-
Research progress on the use of traditional Chinese medicine to treat diseases by regulating ferroptosis.Genes Dis. 2024 Nov 6;12(3):101451. doi: 10.1016/j.gendis.2024.101451. eCollection 2025 May. Genes Dis. 2024. PMID: 40070365 Free PMC article. Review.
-
Decoding TMAO in the Gut-Organ Axis: From Biomarkers and Cell Death Mechanisms to Therapeutic Horizons.Drug Des Devel Ther. 2025 Apr 29;19:3363-3393. doi: 10.2147/DDDT.S512207. eCollection 2025. Drug Des Devel Ther. 2025. PMID: 40322030 Free PMC article. Review.
-
TCM targets ferroptosis: potential treatments for cancer.Front Pharmacol. 2024 Apr 22;15:1360030. doi: 10.3389/fphar.2024.1360030. eCollection 2024. Front Pharmacol. 2024. PMID: 38738174 Free PMC article. Review.
-
Recent advances in the potential effects of natural products from traditional Chinese medicine against respiratory diseases targeting ferroptosis.Chin Med. 2024 Mar 22;19(1):49. doi: 10.1186/s13020-024-00918-w. Chin Med. 2024. PMID: 38519984 Free PMC article. Review.
-
Chaihuang Qingfu Pills Protect Against Acute Pancreatitis-Associated Acute Lung Injury Through MMP9-NLRP3-Pyroptosis Pathway.J Inflamm Res. 2025 Feb 18;18:2317-2338. doi: 10.2147/JIR.S501531. eCollection 2025. J Inflamm Res. 2025. PMID: 39991664 Free PMC article.
References
MeSH terms
Substances
LinkOut - more resources
Full Text Sources
Medical
Research Materials
Miscellaneous

