. 2023 Apr 3;155(4):e202213203.
doi: 10.1085/jgp.202213203. Epub 2023 Feb 23.

Probenecid affects muscle Ca2+ homeostasis and contraction independently from pannexin channel block

Affiliations

Probenecid affects muscle Ca2+ homeostasis and contraction independently from pannexin channel block

Francisco Jaque-Fernandez et al. J Gen Physiol. .

Abstract

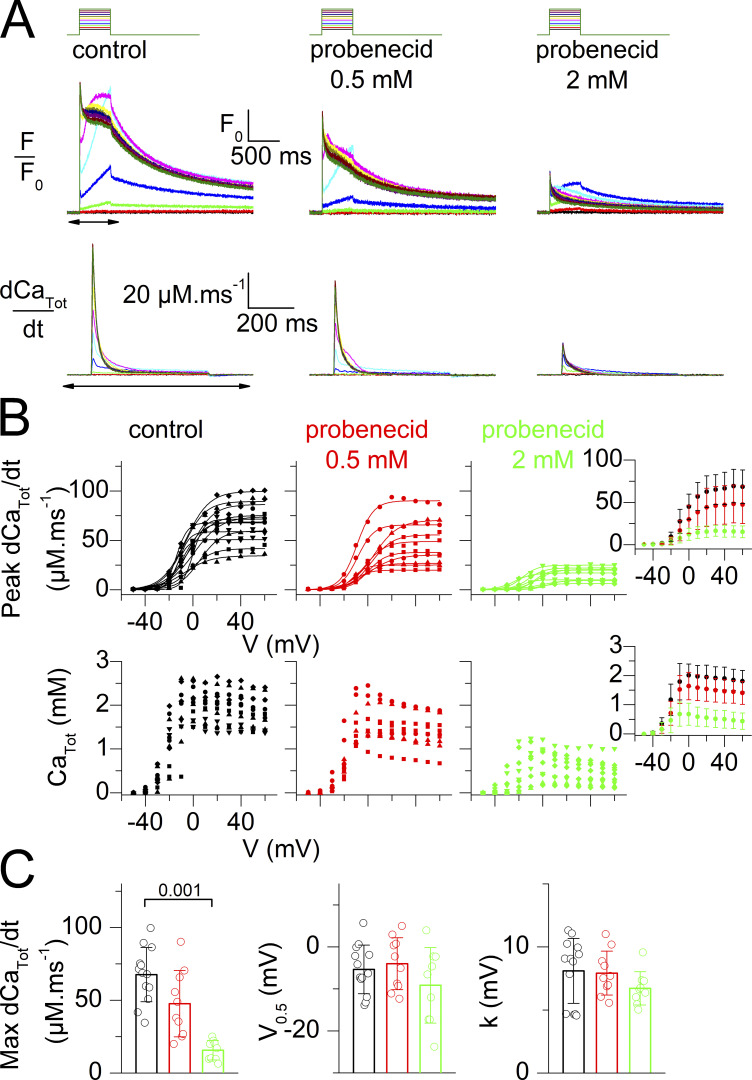
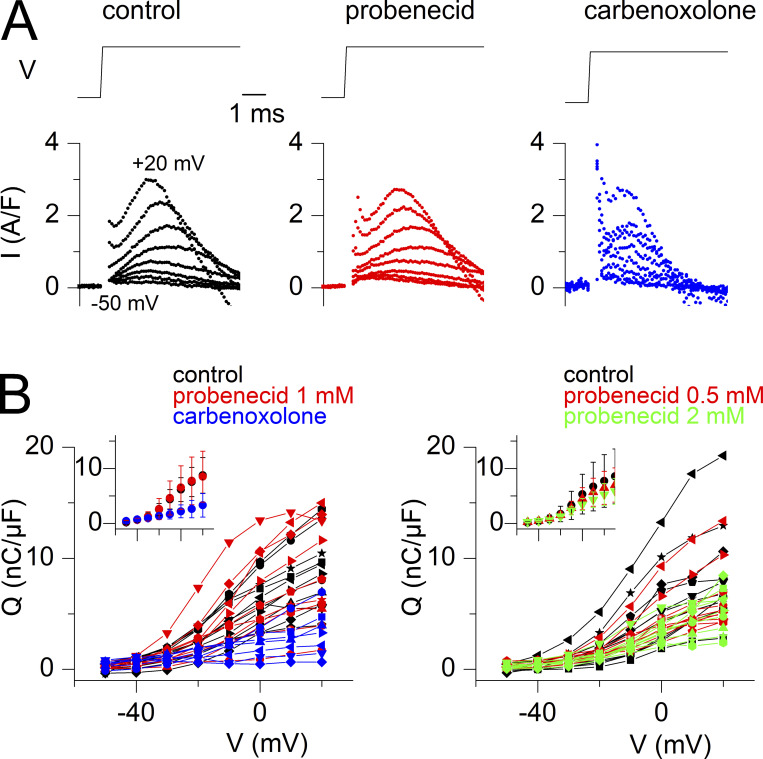
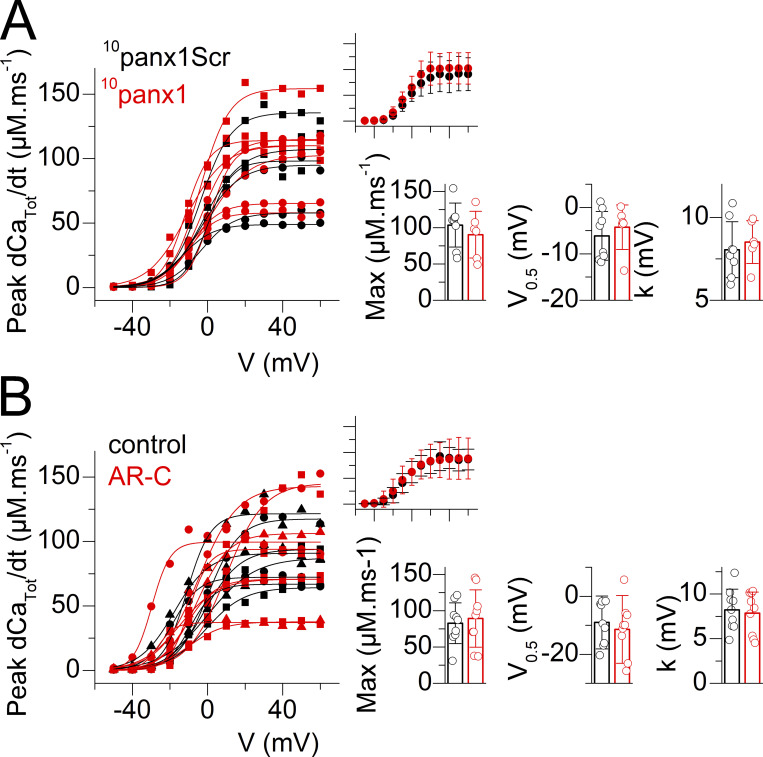
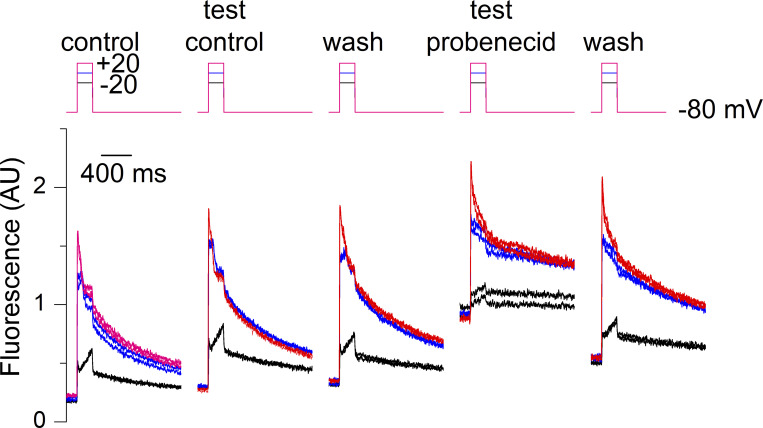
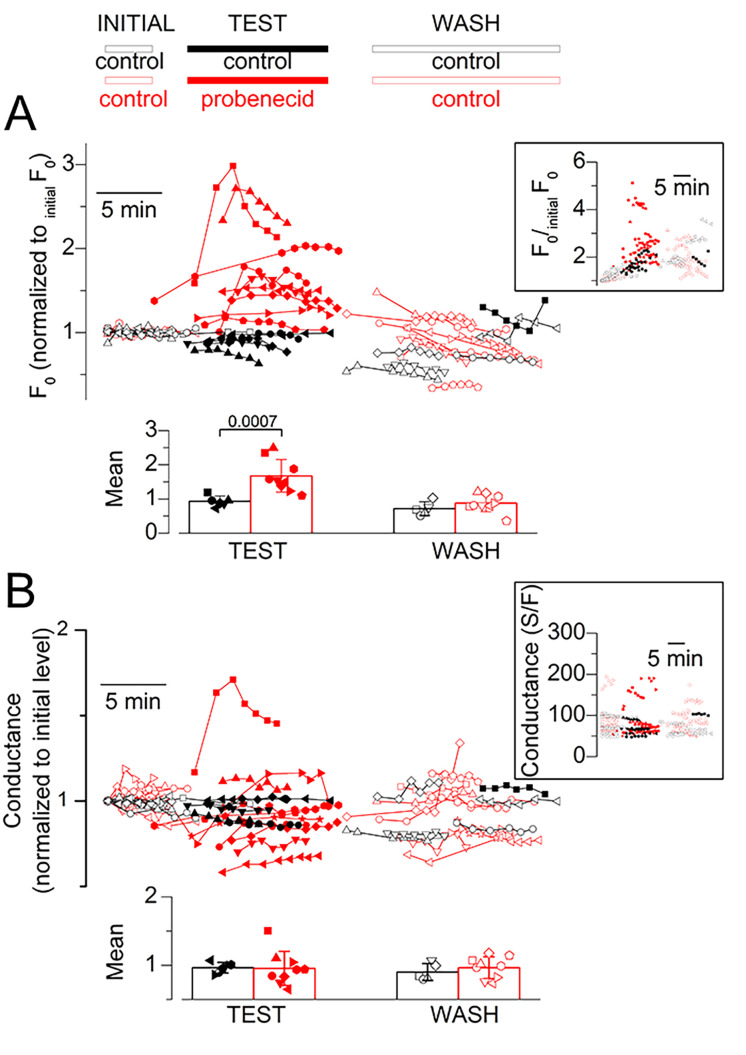
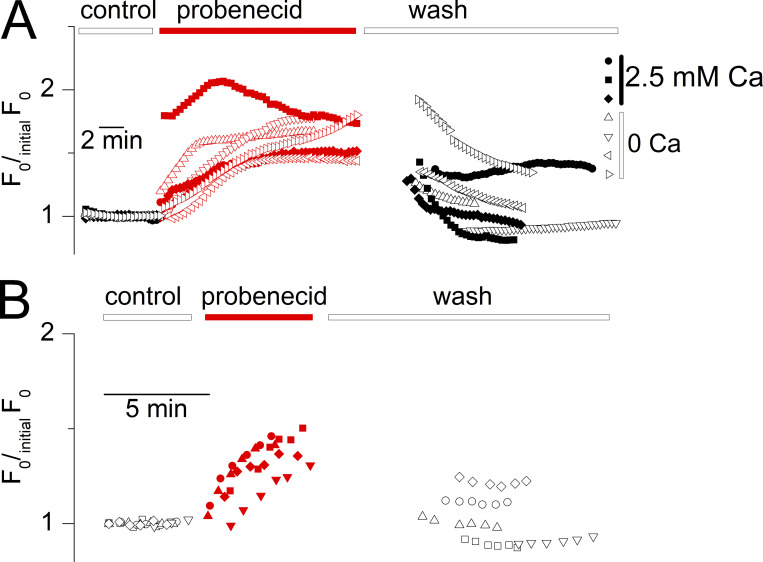
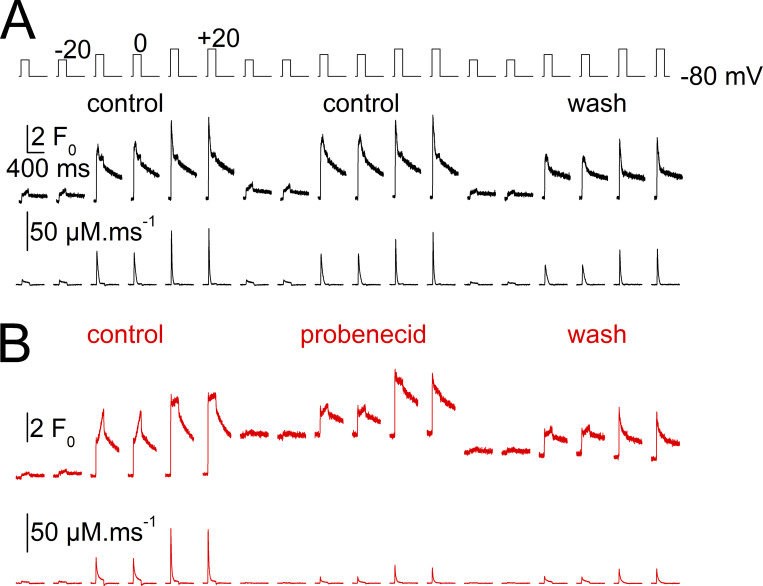
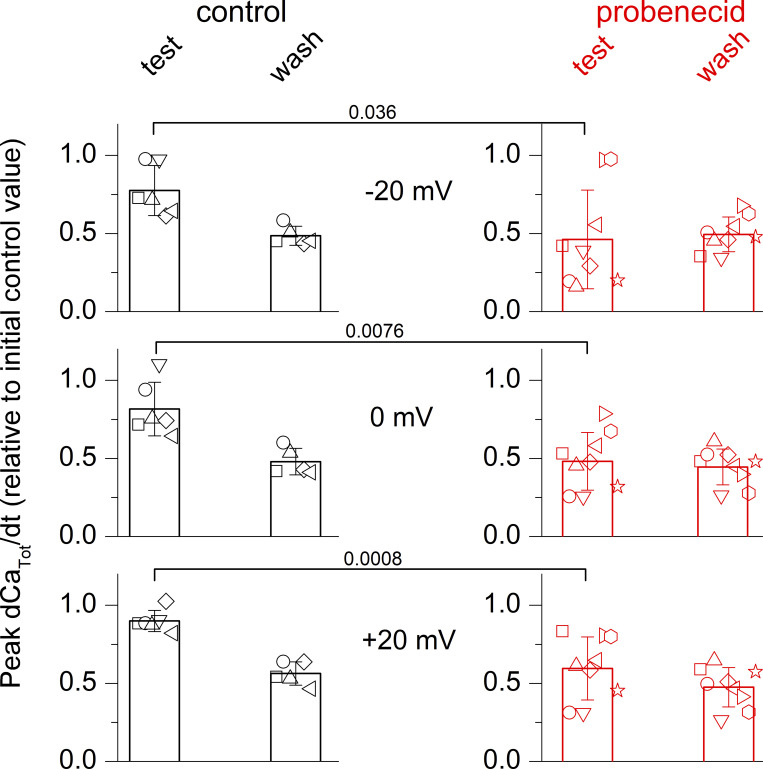
Tight control of skeletal muscle contractile activation is secured by the excitation-contraction (EC) coupling protein complex, a molecular machinery allowing the plasma membrane voltage to control the activity of the ryanodine receptor Ca2+ release channel in the sarcoplasmic reticulum (SR) membrane. This machinery has been shown to be intimately linked to the plasma membrane protein pannexin-1 (Panx1). We investigated whether the prescription drug probenecid, a widely used Panx1 blocker, affects Ca2+ signaling, EC coupling, and muscle force. The effect of probenecid was tested on membrane current, resting Ca2+, and SR Ca2+ release in isolated mouse muscle fibers, using a combination of whole-cell voltage-clamp and Ca2+ imaging, and on electrically triggered contraction of isolated muscles. Probenecid (1 mM) induces SR Ca2+ leak at rest and reduces peak voltage-activated SR Ca2+ release and contractile force by 40%. Carbenoxolone, another Panx1 blocker, also reduces Ca2+ release, but neither a Panx1 channel inhibitory peptide nor a purinergic antagonist affected Ca2+ release, suggesting that probenecid and carbenoxolone do not act through inhibition of Panx1-mediated ATP release and consequently altered purinergic signaling. Probenecid may act by altering Panx1 interaction with the EC coupling machinery, yet the implication of another molecular target cannot be excluded. Since probenecid has been used both in the clinic and as a masking agent for doping in sports, these results should encourage evaluation of possible effects on muscle function in treated individuals. In addition, they also raise the question of whether probenecid-induced altered Ca2+ homeostasis may be shared by other tissues.


Figures

Figure 1.
Figure 1.
Probenecid and carbenoxolone depress voltage-activated SR Ca2+ release. (A) Representative examples of rhod-2 fluorescence transients (F/F0 traces) and corresponding calculated SR Ca2+ release flux (dCaTot/dt) elicited by the voltage-clamp pulse protocol shown on top, in a control fiber, in a fiber equilibrated in the presence of probenecid, and in a fiber equilibrated in the presence of carbenoxolone. (B) Voltage-dependence of the peak amplitude of SR Ca2+ release (left) and of the corresponding total amount of released Ca2+ (right) in the control group of fibers (black) and in the groups of fibers treated with probenecid (red) and carbenoxolone (blue), all tested as shown in A. Individual datapoints from each muscle fiber are shown, with the corresponding Boltzmann fit superimposed (continuous line). An identical symbol is used for fibers from the same mouse. The control, probenecid, and carbenoxolone datasets are from 11 fibers from six mice, 10 fibers from four mice, and 8 fibers from three mice, respectively. Data from muscle fibers issued from the same mouse are shown with the same symbol. The inset in each panel shows the corresponding mean (±SD) values in each group with the x and y scale covering the same ranges as in the main panel. (C) Individual and mean (±SD) values for the Boltzmann parameters in the three groups of muscle fibers. Statistical difference between the parameters in the control and either the probenecid or the carbenoxolone groups was assessed using the nested analysis described by Eisner (2021).
Figure 2.
Figure 2.
Effect of probenecid at 0.5 and at 2 mM on voltage-activated SR Ca2+ release. (A) Representative examples of rhod-2 fluorescence transients (F/F0 traces) and corresponding calculated SR Ca2+ release flux (dCaTot/dt) elicited by the voltage-clamp pulse protocol shown on top, in a control fiber, in a fiber equilibrated in the presence of 0.5 mM probenecid, and a fiber equilibrated in the presence of 2 mM probenecid. (B) Voltage-dependence of the peak amplitude of SR Ca2+ release (dCaTot/dt, top panels) and of the corresponding total amount of released Ca2+ (CaTot, bottom panels) in the control group of fibers (black) and the groups of fibers treated with probenecid (red and green), all tested as shown in A. Individual datapoints from each muscle fiber are shown, with the corresponding Boltzmann fit superimposed (continuous line). The control, probenecid 0.5 mM, and probenecid 2 mM datasets are from 13 fibers from five mice, 10 fibers from three mice, and 9 fibers from three mice, respectively. Data from muscle fibers issued from the same mouse are shown with the same symbol. The inset on the right in each panel shows corresponding mean (±SD) values in each group with the x and y scale covering the same ranges as in the main panel. (C) Individual and mean (± SD) values for the Boltzmann parameters in the three groups of muscle fibers. Statistical difference between the parameters in the control and either the probenecid or the carbenoxolone groups was assessed using a nested analysis (Eisner, 2021).
Figure 3.
Figure 3.
Estimation of charge movement in probenecid- and carbenoxolone-treated fibers. (A) Examples of charge movement current traces elicited at the onset of depolarizing pulses to values ranging between −50 and +20 mV in a control fiber, in a fiber treated with 1 mM probenecid and in a fiber treated with 100 µM carbenoxolone. (B) Voltage dependence of the charge density in all fibers tested under the indicated conditions. Insets show corresponding mean (±SD) values. Data are from the same fibers as in Fig. 1 (left) and Fig. 2 (right).
Figure 4.
Figure 4.
The Panx1 inhibitory peptide 10panx1 and the P2Y2 antagonist AR-C118925 do not affect voltage-activated SR Ca2+ release. (A) Voltage dependence of the peak amplitude of SR Ca2+ release in fibers treated with 200 µM of either the 10panx1 peptide (red) or with the scrambled control peptide (10panx1SCr, black). Individual datapoints from each muscle fiber are shown, with the corresponding Boltzmann fit superimposed (continuous line). The 10panx1SCr and 10panx1 datasets are from six fibers and four fibers from two mice, respectively. Data from muscle fibers issued from the same mouse are shown with the same symbol. The inset on the right shows the corresponding mean (±SD) values in each group with the x and y scale covering the same ranges as in the main panel. Individual and mean (±SD) values for the Boltzmann parameters in the two groups of muscle fibers are shown in the bar graphs. The absence of statistical difference between the parameters in the two groups was assessed using a nested analysis (Eisner, 2021). (B) Voltage dependence of the peak amplitude of SR Ca2+ release in control fibers (black) and in fibers treated with 10 µM of AR-C118925 (red). Individual datapoints from each muscle fiber are shown, with the corresponding Boltzmann fit superimposed (continuous line). The control and AR-C118925 datasets are from nine fibers and nine fibers from three mice. Data presentation and analysis are as described in A.
Figure 5.
Figure 5.
Effect of a transient application of probenecid on voltage-activated Ca2+ transients in a muscle fiber. Rhod-2 Ca2+ transients elicited by the pulse protocol shown on top upon successive changes in the extracellular solution. Each depolarizing pulse was repeated twice to check for the stability of the response. From left to right, rhod-2 transients elicited by 200 ms-long pulses to −20, 0, and +20 mV (1) in the initial control condition, (2) during the test-control condition, (3) after wash out (wash), (4) after application of the probenecid-containing solution, and finally after probenecid wash-out. Throughout the control measurements, the resting rhod-2 fluorescence level tended to slightly increase with time because of the not-entirely-complete (1) equilibration of the pipette solution with the cell interior and (2) recovery of the resting fluorescence following a voltage-activated transient.
Figure 6.
Figure 6.
Effect of probenecid on resting Ca2+ and resting membrane conductance. (A) Resting rhod-2 fluorescence level (normalized to the initial value; initialF0) along the course of experiments designed to test the effect of acute application of probenecid. As the exact timing of pulses delivery and of probenecid (or control solution) application and wash-out were not identical for all experiments, data points from each and every fiber tested are shown, with each symbol type corresponding to a distinct fiber. Red symbols are from fibers challenged with probenecid. Black symbols are from fibers challenged with the control protocol. Open symbols correspond to data collected before application and after wash-out of the test solution (probenecid or control), whereas corresponding filled symbols show data collected in the presence of the test solution. The inset shows the raw data while the main panel shows the same data after normalization by a linear function fitted to the data points before the application of probenecid (see the text describing Fig. 6 for details). In one control fiber (squares), depolarizing pulses in the presence of the test-control (DMSO containing) solution were applied much later than in all other fibers and wash-out was not implemented. The bar graphs at the bottom show the mean (±SD) values for F0/initialF0 calculated from the above datasets, during probenecid (or DMSO for the control experiments) application and after wash. For this, for each fiber, all F0/initialF0 values obtained (1) during the test period and (2) after wash were averaged. Data are from six fibers from three mice (control) and nine fibers from four mice (probenecid). (B) Resting membrane conductance along the course of the same experiments as in A, assessed from the change in membrane current elicited by a 20-mV hyperpolarization from the holding voltage. The inset shows the raw values while the main graph shows the values normalized to the initial conductance level. The bar graphs at the bottom show the mean (±SD) values for normalized conductance calculated from the above datasets during probenecid (or DMSO) application and after wash.
Figure 7.
Figure 7.
The probenecid-induced cytosolic Ca2+ elevation persists in the absence of extracellular calcium and under voltage-inactivated conditions. (A) Time course of probenecid-induced increase in fluo-4 fluorescence in three fibers bathed in the presence of calcium-containing Tyrode solution (circles) and in four fibers bathed in calcium-deprived Tyrode (triangles). (B) Probenecid-induced rise in rhod-2 fluorescence in five muscle fibers voltage-clamped at a holding voltage of −10 mV. Datasets were corrected, as in Fig. 6, by normalization with a linear function fitted to the data points before the application of the drug.
Figure 8.
Figure 8.
Changes in voltage-activated SR Ca2+ release flux during probenecid application. Data are from the same experiments as in Fig. 6. (A) Control experiment: rhod-2 Ca2+ transients (top, initialF0 unit) and corresponding SR Ca2+ release flux (bottom, µM.ms−1) recorded in response to the voltage pulses shown at the top in a muscle fiber challenged by the test-control protocol (DMSO application) and after wash. (B) Test experiment, same measurements as in A from a muscle fiber challenged with probenecid and after wash.
Figure 9.
Figure 9.
Relative change in the amplitude of peak SR Ca2+ release flux following probenecid (or control solution) application and wash-out. Data are from the same experiments as in Fig. 6. Individual values from each fiber, and corresponding mean (±SD) values, for the relative change in peak SR Ca2+ release flux following application of the control solution (control-test, left) or of the probenecid-containing solution (probenecid-test, right) and after wash-out. Values in each fiber were normalized to the corresponding peak SR Ca2+ release flux in the initial control condition. Graphs from top to bottom report the changes at the three tested voltages.
Figure 10.
Figure 10.
Effect of probenecid on whole muscle resting and tetanic tension. (A) Representative records of the tension response of an isolated EDL muscle to a 60-Hz train of field stimulation applied every 15 min. Following the first train, the extracellular Ringer solution was replaced by the same solution containing either only DMSO (top) or probenecid (bottom). (B) Resting tension from five isolated EDL muscles electrically stimulated as in Fig. 10 A, and challenged either with the control protocol (black) or with probenecid (red). In both groups, the first measurement was taken in the presence of the control Ringer solution. The right-most graph shows the mean (±SD) values from the two groups. (C) Corresponding results for the peak amplitude of the tetanic tension. Note that in these whole muscle experiments, the course of probenecid equilibration within the entire section of the muscle is likely to take much longer than in the single muscle fibers experiments. In addition, contraction of the muscle may favor intramuscle equilibration of the drug and promote its effect, making it look like a use-dependent effect.
Figure 11.
Figure 11.
Evidence for reduced SR Ca2+ content in probenecid-treated fibers. (A) Individual traces of Ca2+ release flux from control fibers (left, seven fibers from three mice) and from fibers treated with 2 mM probenecid (middle, five fibers from two mice). The right panel shows the corresponding mean (±SD, grey shading) time course of Ca2+ release. Data are from the same group of fibers as in Fig. 2. Traces in the two groups were selected on the basis of their similar value for initial peak Ca2+ release flux of ∼20 µM.ms-1, irrespective of the activation voltage. Notice that, following the initial peak, the Ca2+ release flux decreases to zero in the probenecid-treated fibers whereas a slowly decaying phase persists in the control fibers. (B) Time course of the total released Ca2+ calculated from the above traces in A. Total released Ca2+ rapidly reaches a steady level in the probenecid-treated fibers, whereas it keeps rising in the control fibers.

References

    1. Aguilar-Perez, A., Pacheco-Costa R., Atkinson E.G., Deosthale P., Davis H.M., Essex A.L., Dilley J.E., Gomez L., Rupert J.E., Zimmers T.A., et al. . 2019. Age- and sex-dependent role of osteocytic pannexin1 on bone and muscle mass and strength. Sci. Rep. 9:13903. 10.1038/s41598-019-50444-1 - DOI - PMC - PubMed
    1. Ahmed, M.U., Bennett D.J., Hsieh T.C., Doonan B.B., Ahmed S., and Wu J.M.. 2016. Repositioning of drugs using open-access data portal DTome: A test case with probenecid (review). Int. J. Mol. Med. 37:3–10. 10.3892/ijmm.2015.2411 - DOI - PubMed
    1. Arias-Calderón, M., Almarza G., Díaz-Vegas A., Contreras-Ferrat A., Valladares D., Casas M., Toledo H., Jaimovich E., and Buvinic S.. 2016. Characterization of a multiprotein complex involved in excitation-transcription coupling of skeletal muscle. Skelet. Muscle. 6:15. 10.1186/s13395-016-0087-5 - DOI - PMC - PubMed
    1. Banas, K., Clow C., Jasmin B.J., and Renaud J.M.. 2011. The KATP channel Kir6.2 subunit content is higher in glycolytic than oxidative skeletal muscle fibers. Am. J. Physiol. Regul. Integr. Comp. Physiol. 301:R916–R925. 10.1152/ajpregu.00663.2010 - DOI - PubMed
    1. Bang, S., Kim K.Y., Yoo S., Lee S.H., and Hwang S.W.. 2007. Transient receptor potential V2 expressed in sensory neurons is activated by probenecid. Neurosci. Lett. 425:120–125. 10.1016/j.neulet.2007.08.035 - DOI - PubMed

Publication types

MeSH terms