. 2023 Feb;9(2):mgen000957.
doi: 10.1099/mgen.0.000957.

Upper respiratory tract microbiota dynamics following COVID-19 in adults

Affiliations

Upper respiratory tract microbiota dynamics following COVID-19 in adults

Christian Rosas-Salazar et al. Microb Genom. 2023 Feb.

Abstract

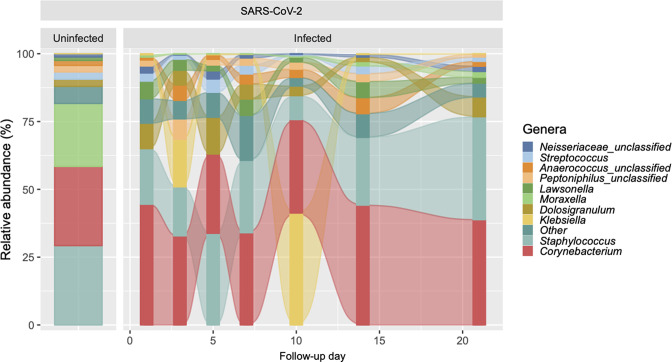
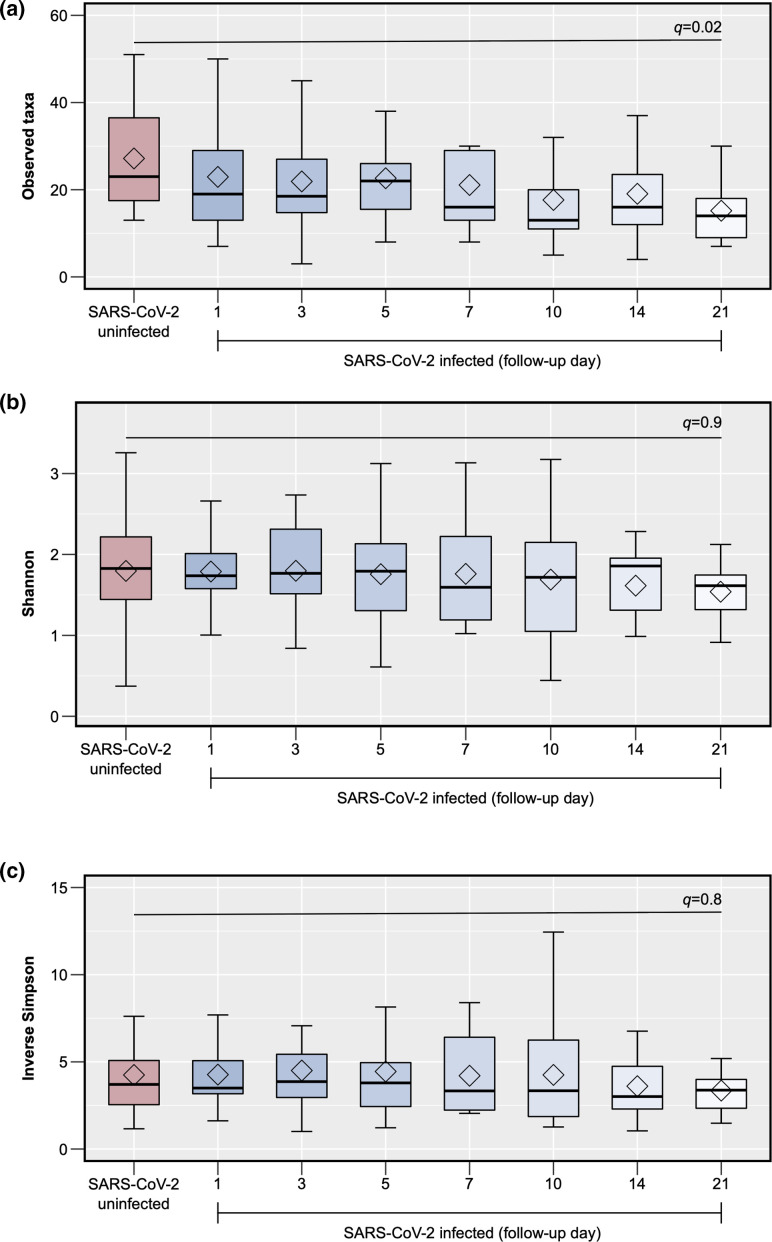
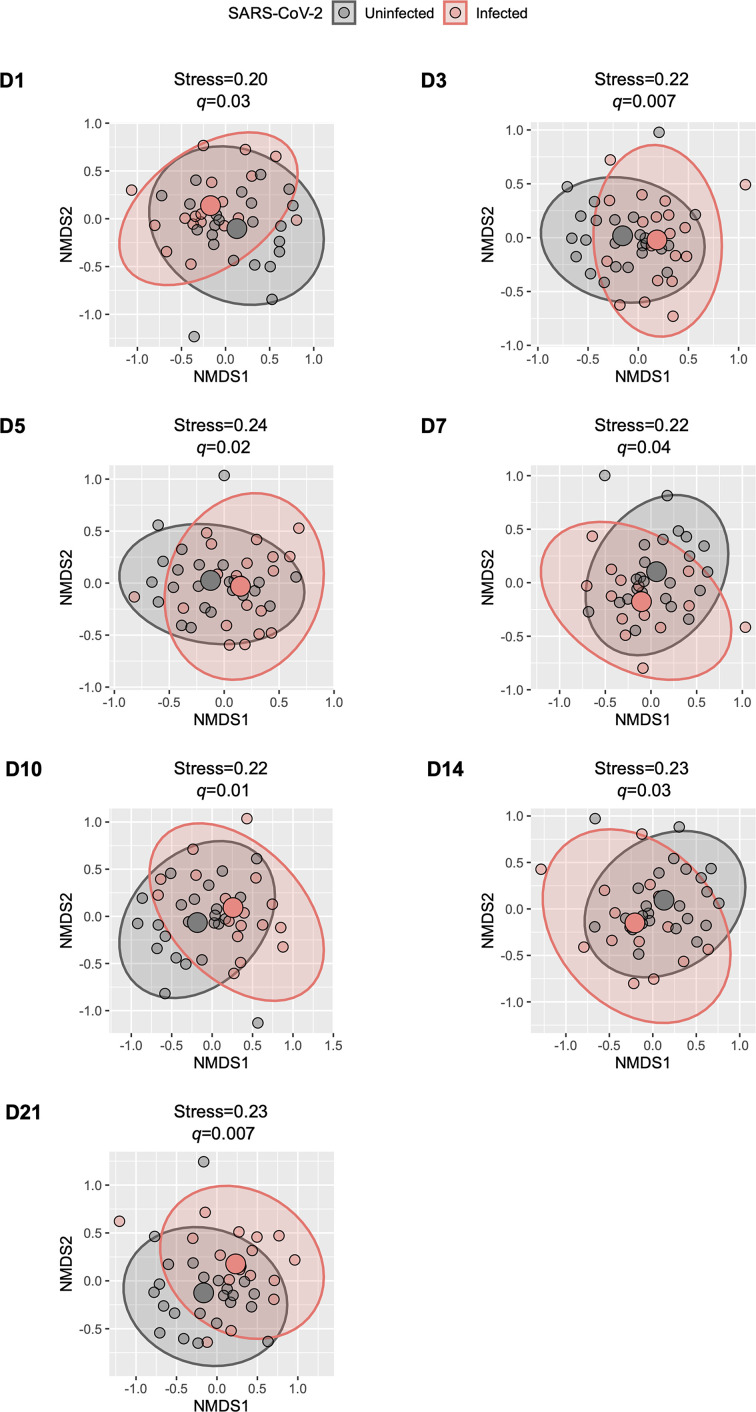
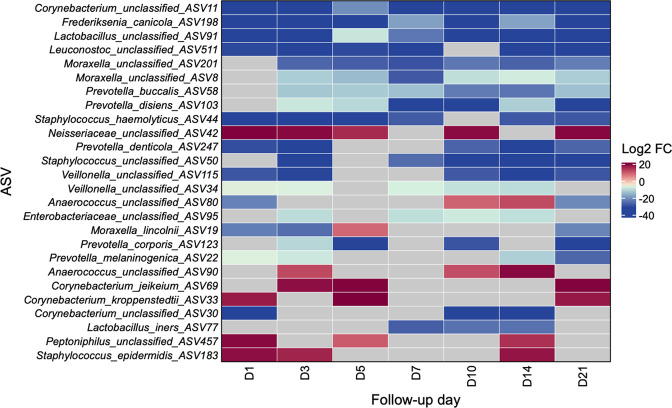
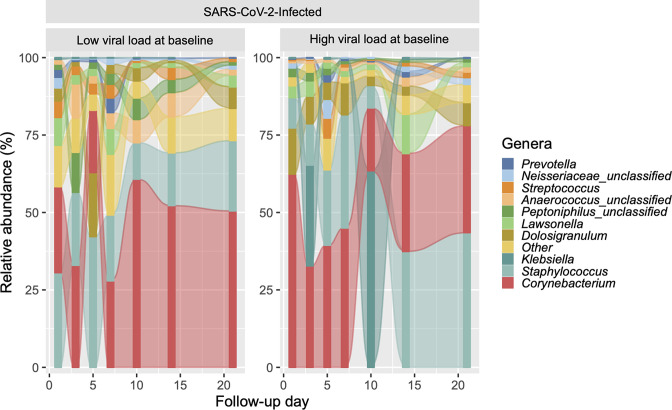
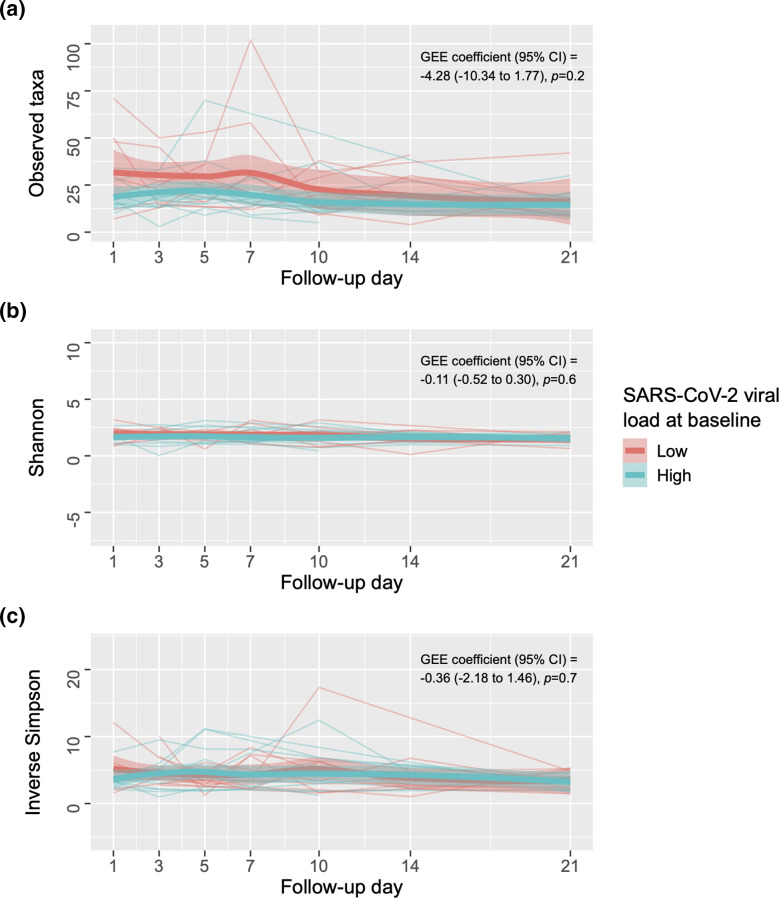
To date, little is known about the effect of severe acute respiratory syndrome coronavirus 2 (SARS-CoV-2), the virus responsible for the coronavirus disease 2019 (COVID-19) pandemic, on the upper respiratory tract (URT) microbiota over time. To fill this knowledge gap, we used 16S ribosomal RNA gene sequencing to characterize the URT microbiota in 48 adults, including (1) 24 participants with mild-to-moderate COVID-19 who had serial mid-turbinate swabs collected up to 21 days after enrolment and (2) 24 asymptomatic, uninfected controls who had mid-turbinate swabs collected at enrolment only. To compare the URT microbiota between groups in a comprehensive manner, different types of statistical analyses that are frequently employed in microbial ecology were used, including ⍺-diversity, β-diversity and differential abundance analyses. Final statistical models included age, sex and the presence of at least one comorbidity as covariates. The median age of all participants was 34.00 (interquartile range=28.75-46.50) years. In comparison to samples from controls, those from participants with COVID-19 had a lower observed species index at day 21 (linear regression coefficient=-13.30; 95 % CI=-21.72 to -4.88; q=0.02). In addition, the Jaccard index was significantly different between samples from participants with COVID-19 and those from controls at all study time points (PERMANOVA q<0.05 for all comparisons). The abundance of three amplicon sequence variants (ASVs) (one Corynebacterium ASV, Frederiksenia canicola, and one Lactobacillus ASV) were decreased in samples from participants with COVID-19 at all seven study time points, whereas the abundance of one ASV (from the family Neisseriaceae) was increased in samples from participants with COVID-19 at five (71.43 %) of the seven study time points. Our results suggest that mild-to-moderate COVID-19 can lead to alterations of the URT microbiota that persist for several weeks after the initial infection.

Keywords: COVID-19; SARS-CoV-2; airway; coronavirus; microbiota; nasal; respiratory.


Conflict of interest statement

The authors declare that there are no conflicts of interest.

Figures

Fig. 1.
Fig. 1.
Predominant genera of the upper respiratory tract microbiota in SARS-CoV-2-uninfected and -infected participants. The figure shows alluvial plots of the relative abundance (%) of the top 10 most abundant genera (y-axis) per group and, for SARS-CoV-2-infected participants, by follow-up day (x-axis). The relative abundances of other genera were collapsed into the ‘other’ category.
Fig. 2.
Fig. 2.
Comparison of the ⍺-diversity of the upper respiratory tract microbiota between SARS-CoV-2-uninfected and -infected participants. The figure shows box plots of the observed species (1A), Shannon (1B) and inverse Simpson indices (1C) (y-axes) per group and, for SARS-CoV-2-infected participants, by follow-up day (x-axes). The P-values for the comparisons of follow-up day 21 for SARS-CoV-2-infected participants vs day 1 (enrolment) for uninfected participants using linear regression models adjusting for potential confounders (see text) and controlling for multiple testing (q-values) are shown. The sample sizes for each group ( n ) are also shown.
Fig. 3.
Fig. 3.
Comparison of the β-diversity of the upper respiratory tract microbiota between SARS-CoV-2-uninfected and -infected participants. The figure shows scatter plots representing the overall composition (small circles) of each participant’s upper respiratory tract microbiota per group. Each scatter plot depicts the comparisons of a particular follow-up day (d) for SARS-CoV-2-infected participants vs day 1 (enrolment) for uninfected participants. The scatter plots were generated using NMDS based on the Jaccard index and using two dimensions (x- and y-axes). The group’s centroid (large circles) and corresponding 95% CI (ellipses), as well as the NMDS stress values, are shown. The P-values for the comparisons between groups using permutational multivariate analysis of variance models adjusting for potential confounders (see text) and controlling for multiple testing (q-values) are also shown. NMDS, non-metric multidimensional scaling; SARS-CoV-2, severe acute respiratory syndrome coronavirus 2.
Fig. 4.
Fig. 4.
Differential abundance of taxa of the upper respiratory tract microbiota between SARS-CoV-2-uninfected and -infected participants. The figure shows a heatmap of ASVs (rows) that were differentially abundant between groups when comparing a particular follow-up day (columns) for SARS-CoV-2-infected participants vs day 1 (enrolment) for uninfected participants. Each cell indicates the log2 FC in the normalized counts of an ASV between groups as shown by the colour scale (red, increased in SARS-CoV-2-infected participants; blue, increased in controls; grey, no significant association). These estimates were obtained from DESeq2 models adjusting for potential confounders and controlling for multiple testing (see text). ASV, amplicon sequence variant; FC, fold change; SARS-CoV-2, severe acute respiratory syndrome coronavirus 2.
Fig. 5.
Fig. 5.
Longitudinal changes in the predominant genera of the upper respiratory tract microbiota in SARS-CoV-2-infected participants with and without high viral load at baseline. The figure shows alluvial plots of the relative abundance (%) of the top 10 most abundant genera (y-axis) per group and by follow-up day (x-axis). The relative abundances of other genera were collapsed into the ‘other’ category.
Fig. 6.
Fig. 6.
Longitudinal effect of SARS-CoV-2 viral load on the ⍺-diversity of the upper respiratory tract microbiota in participants with coronavirus disease 2019. The figure shows line plots of the observed species (1A), Shannon (1B) and inverse Simpson indices (1C) (y-axes) for each participant per group and follow-up day (x-axes). The coefficient, 95% CI, and P-value for the comparison between groups using a GEE model adjusting for potential confounders (see text) are shown. Each group’s fitted locally estimated scatterplot smoothing lines (bold lines) and corresponding 95 % CIs (shaded bands) are also shown. CI, confidence interval, GEE, generalized estimating equation; SARS-CoV-2, severe acute respiratory syndrome coronavirus 2.

Similar articles

Cited by

References

    1. Man WH, de Steenhuijsen Piters WAA, Bogaert D. The microbiota of the respiratory tract: gatekeeper to respiratory health. Nat Rev Microbiol. 2017;15:259–270. doi: 10.1038/nrmicro.2017.14. - DOI - PMC - PubMed
    1. Bosch A, de Steenhuijsen Piters WAA, van Houten MA, Chu M, Biesbroek G, et al. Maturation of the infant respiratory microbiota, environmental drivers, and health consequences. A prospective cohort study. Am J Respir Crit Care Med. 2017;196:1582–1590. doi: 10.1164/rccm.201703-0554OC. - DOI - PubMed
    1. Petersen C, Round JL. Defining dysbiosis and its influence on host immunity and disease. Cell Microbiol. 2014;16:1024–1033. doi: 10.1111/cmi.12308. - DOI - PMC - PubMed
    1. Rosas-Salazar C, Shilts MH, Tovchigrechko A, Chappell JD, Larkin EK, et al. Nasopharyngeal microbiome in respiratory syncytial virus resembles profile associated with increased childhood Asthma risk. Am J Respir Crit Care Med. 2016;193:1180–1183. doi: 10.1164/rccm.201512-2350LE. - DOI - PMC - PubMed
    1. Rosas-Salazar C, Shilts MH, Tovchigrechko A, Schobel S, Chappell JD, et al. Differences in the nasopharyngeal microbiome during acute respiratory tract infection with human rhinovirus and respiratory syncytial virus in infancy. J Infect Dis. 2016;214:1924–1928. doi: 10.1093/infdis/jiw456. - DOI - PMC - PubMed

Publication types