

A Competition, Benchmark, Code, and Data for Using Artificial Intelligence to Detect Lesions in Digital Breast Tomosynthesis
- PMID: 36821110
- PMCID: PMC9951043
- DOI: 10.1001/jamanetworkopen.2023.0524
A Competition, Benchmark, Code, and Data for Using Artificial Intelligence to Detect Lesions in Digital Breast Tomosynthesis
Abstract
Importance: An accurate and robust artificial intelligence (AI) algorithm for detecting cancer in digital breast tomosynthesis (DBT) could significantly improve detection accuracy and reduce health care costs worldwide.
Objectives: To make training and evaluation data for the development of AI algorithms for DBT analysis available, to develop well-defined benchmarks, and to create publicly available code for existing methods.
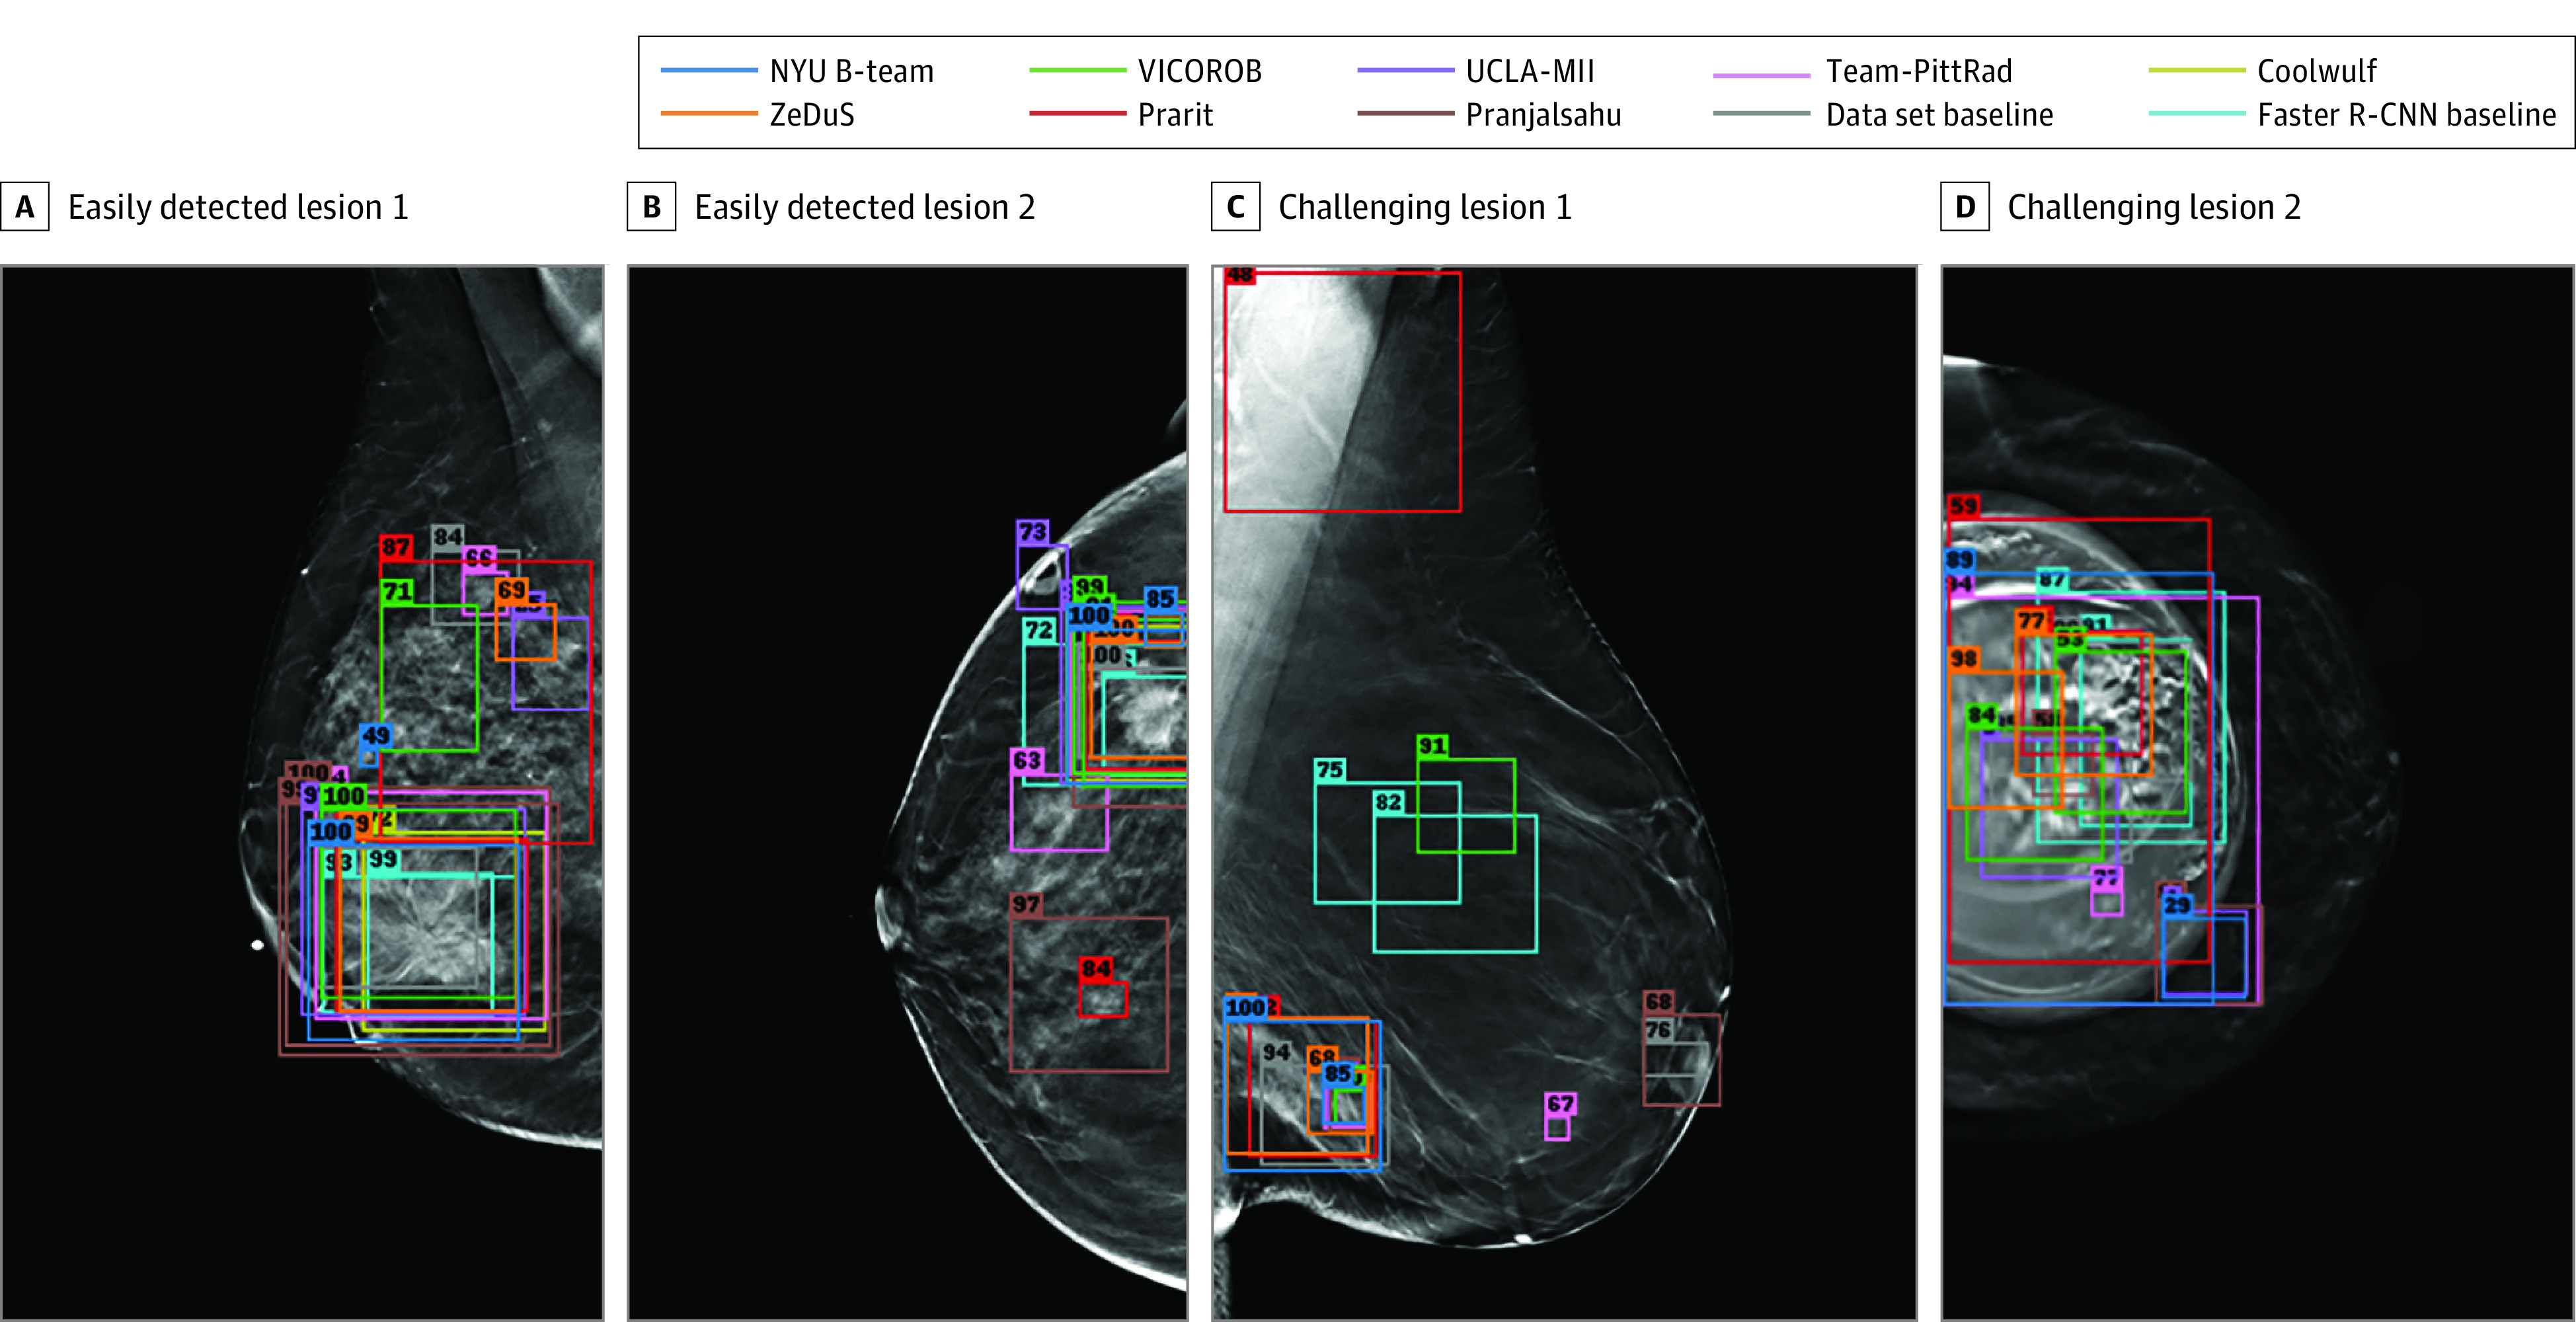
Design, setting, and participants: This diagnostic study is based on a multi-institutional international grand challenge in which research teams developed algorithms to detect lesions in DBT. A data set of 22 032 reconstructed DBT volumes was made available to research teams. Phase 1, in which teams were provided 700 scans from the training set, 120 from the validation set, and 180 from the test set, took place from December 2020 to January 2021, and phase 2, in which teams were given the full data set, took place from May to July 2021.
Main outcomes and measures: The overall performance was evaluated by mean sensitivity for biopsied lesions using only DBT volumes with biopsied lesions; ties were broken by including all DBT volumes.
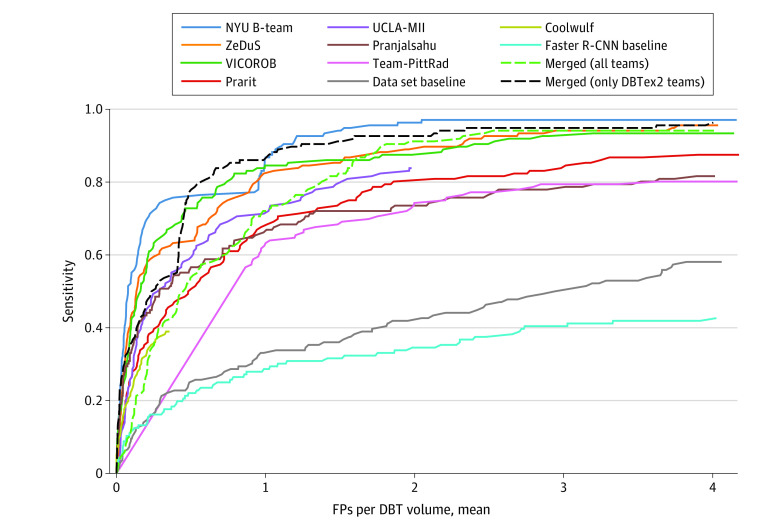
Results: A total of 8 teams participated in the challenge. The team with the highest mean sensitivity for biopsied lesions was the NYU B-Team, with 0.957 (95% CI, 0.924-0.984), and the second-place team, ZeDuS, had a mean sensitivity of 0.926 (95% CI, 0.881-0.964). When the results were aggregated, the mean sensitivity for all submitted algorithms was 0.879; for only those who participated in phase 2, it was 0.926.
Conclusions and relevance: In this diagnostic study, an international competition produced algorithms with high sensitivity for using AI to detect lesions on DBT images. A standardized performance benchmark for the detection task using publicly available clinical imaging data was released, with detailed descriptions and analyses of submitted algorithms accompanied by a public release of their predictions and code for selected methods. These resources will serve as a foundation for future research on computer-assisted diagnosis methods for DBT, significantly lowering the barrier of entry for new researchers.
Conflict of interest statement
Figures
Comment in
-
Beyond the AJR: An International Competition Advances Artificial Intelligence Research.AJR Am J Roentgenol. 2024 Jan;222(1):e2329644. doi: 10.2214/AJR.23.29644. Epub 2023 Jun 30. AJR Am J Roentgenol. 2024. PMID: 37222276 No abstract available.
References
-
- Krizhevsky A, Sutskever I, Hinton GE. ImageNet classification with deep convolutional neural networks. In: Pereira F, Burges CJ, Bottou L, Weinberger KQ. Advances in Neural Information Processing Systems 25 (NIPS 2012). Curran Associates Inc; 2012:1097-1105. Accessed January 19, 2023. https://papers.nips.cc/paper/2012/hash/c399862d3b9d6b76c8436e924a68c45b-...
-
- Ren S, He K, Girshick R, Sun J. Faster R-CNN: towards real-time object detection with region proposal networks. In: Cortes C, Lawrence N, Lee D, Sugiyama M, Garnett R. Advances in Neural Information Processing Systems 28 (NIPS2015). Curran Associates Inc; 2015:91-99. Accessed January 19, 2023. https://papers.nips.cc/paper/2015/hash/14bfa6bb14875e45bba028a21ed38046-...
-
- Ronneberger O, Fischer P, Brox T. U-Net: convolutional networks for biomedical image segmentation. In: Navab N, Hornegger J, Wells WM, Frangi AF, eds. Medical Image Computing and Computer-Assisted Intervention—MICCAI 2015. Springer International Publishing; 2015:234-241, doi:10.1007/978-3-319-24574-4_28 - DOI
Publication types
MeSH terms
Grants and funding
LinkOut - more resources
Full Text Sources
Medical
