. 2023 Feb;169(2):001305.
doi: 10.1099/mic.0.001305.

Variable disruption of epithelial monolayers by Neisseria meningitidis carriage isolates of the hypervirulent MenW cc11 and MenY cc23 lineages

Affiliations

Variable disruption of epithelial monolayers by Neisseria meningitidis carriage isolates of the hypervirulent MenW cc11 and MenY cc23 lineages

Neelam Dave et al. Microbiology (Reading). 2023 Feb.

Abstract

Colonization of mucosal tissues by Neisseria meningitidis requires adhesion mediated by the type IV pilus and multiple outer-membrane proteins. Penetration of the mucosa and invasion of epithelial cells are thought to contribute to host persistence and invasive disease. Using Calu-3 cell monolayers grown at an air-liquid interface, we examined adhesion, invasion and monolayer disruption by carriage isolates of two clonal complexes of N. meningitidis. Carriage isolates of both the serogroup Y cc23 and the hypervirulent serogroup W cc11 lineages exhibited high levels of cellular adhesion, and a variable disruption phenotype across independent isolates. Inactivation of the gene encoding the main pilus sub-unit in multiple cc11 isolates abrogated both adhesive capacity and ability to disrupt epithelial monolayers. Contrastingly, inactivation of the phase-variable opa or nadA genes reduced adhesion and invasion, but not disruption of monolayer integrity. Adherence of tissue-disruptive meningococci correlated with loss of staining for the tight junction protein, occludin. Intriguingly, in a pilus-negative strain background, we observed compensatory ON switching of opa genes, which facilitated continued adhesion. We conclude that disruption of epithelial monolayers occurs in multiple meningococcal lineages but can vary during carriage and is intimately linked to pilus-mediated adhesion.

Keywords: MenW; Neisseria meningitidis; air–liquid interface; meningococcus; opa; phase variation.


Conflict of interest statement

The authors declare that there are no conflicts of interest.

Figures

Fig. 1.
Fig. 1.
Adherence of carriage isolates of the MenY:cc23 and MenW:cc11 lineages to Calu-3 monolayers grown in an air–liquid interface. (a) Calu-3 cells were infected with N222.1, MC58 and N59.1, MenY:cc23, MenB:cc32 and MenY:cc174 isolates, respectively, at an m.o.i. of 30 for 6 and 24 h. No data were obtained for N222.1 at 24 h due to disruption of the monolayers. (b) Calu-3 monolayers were infected with three MenW:cc11 isolates (i.e. R001, B285 and R191) at an m.o.i. of 30 for 1 h before removal of bacteria, and replacement with medium and incubation for 18 h. After incubation, non-adherent bacteria were removed by sequential PBS washes and lysed with 0.1 % saponin to release cell-associated bacteria. Bacterial c.f.u. counts were determined by plating serial dilutions on BHI agar plates. Error bars represent the standard deviation of the mean of three replicates (MenY) or three independent experiments (MenW). No significant differences were detected by an ordinary one way-ANOVA.
Fig. 2.
Fig. 2.
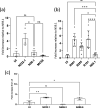
Effect of MenY and MenW:cc11 isolates on Calu-3 monolayer permeability. Calu-3 cells were grown in transwell plates under ALI conditions to confluent monolayers. Permeabilization of uninfected and infected cells was tested by adding FITC-dextran to the upper chamber and measuring the amounts of this molecule in the basolateral chamber after 3 h incubation. (a) Monolayers were infected at an m.o.i. of 30 with MenY:cc23 (N222.1), MenY:cc174 (N59.1) or MenB:cc32 (MC58) isolates for 12 h. (b) Monolayers were infected with three different MenW:cc11 (m.o.i. 30) isolates or N59.1 for 1 h followed by removal of the inoculum and incubation for 18 h. (c) Monolayers were infected with three MenY:cc23 isolates (N222.1, N459.3 and N459.6) from carrier V222 at an m.o.i. of 30 for 12 h. Levels of FITC-dextran in the basal chamber are expressed as a fold increase from uninfected (UI) control cells. For panels (a, b), these data were then normalized relative to the fold increase for N59.1. Error bars show the standard deviation of the mean from three or eight replicates (filled circles) for the MenY and MenW isolates, respectively. Individual experiments consisted of two or more technical replicates. Significance values above each column indicate statistical comparisons with N59.1 (a, b) or the uninfected control (c). Significant differences are indicated: ns, not significant; *, P<0.05; and ***, P<0.001 (ordinary one way-ANOVA).
Fig. 3.
Fig. 3.
Effect of disruption of known adhesins on adherence of MenW:cc11 isolates to human epithelial cells. Semi-confluent A549 human epithelial cells (a–c) and ALI Calu-3 monolayers (d–f) were infected with wild-type or mutant meningococcal strains at an m.o.i. of 30 for 1 h followed by removal and replacement of the inoculum with media and incubation for 18–22 h, respectively. After incubation, non-adherent bacteria were removed by sequential PBS washes followed by lysis of the cells with 0.1 % saponin and enumeration of bacterial cells by plating of serial dilutions on agar plates. Error bars show the standard deviation of the mean from three independent biological replicates (filled circles). Individual experiments consisted of two or more technical replicates. Significance values above each column indicate statistical comparisons with the relevant wild-type strain. Comparisons between columns are shown by connecting lines. Significant differences are indicated: ns, not significant; *, P<0.05; **, P<0.01 ***, P<0.001; and ****, P<0.0001 (ordinary one way-ANOVA).
Fig. 4.
Fig. 4.
Effect of deletion of adhesins on invasion of human epithelial cells by MenW:cc11 strains. Initial infections were performed as described in Fig. 3. Numbers of viable intracellular bacteria were determined by subjecting infected cells to a 30 min incubation with 100 µg ml−1 gentamicin in order to kill extracellular and adherent bacteria. After removal of the antibiotic, intracellular bacteria were released by lysis of the eukaryotic cells with 0.1 % saponin and enumerated. Invasion c.f.u. counts were normalized against the total number of cell-associated c.f.u. as determined prior to gentamicin treatment (see Fig. 3). Data are shown for A549 (a–c) and Calu-3 (d–f) cells with wild-type and mutant strains of R001 (a, d), B285 (b, e) and R191 (c, f). Error bars show the standard deviation of the mean from three independent biological replicates. Individual experiments consisted of two or more technical replicates. Statistical significance for each mutant compared to their respective wild-type strain are displayed on the graph. Significant differences are indicated: ns, non-significant; *, P<0.05; **, P<0.01 ***, P<0.001; and ****, P<0.0001 (ordinary one way-ANOVA for A549 and unpaired t-test for Calu-3).
Fig. 5.
Fig. 5.
Confocal microscopy analysis of meningococcal adherence to A549 cells. Microcolony formation on A549 cells was analysed after 19 h of infection for the R001 and B285 strains [(a, b), respectively]. Adherent meningococcal cells were detected utilizing a polyclonal N. meningitidis antibody and visualized by confocal microscopy. The numbers of meningococcal cells per individual A549 cell were quantified using the Fiji program. The data represent the mean and standard error (see Fig. S5 for individual data points). Statistical significance was tested for each mutant as compared to their respective wild-type strain. Significant differences are indicated: *, P<0.05; **, P<0.01; and ***, P<0.001 (one-way ANOVA). Exemplar confocal microscopy images of uninfected cells (c) and cells infected with either R001 (d) or R001ΔpilE (e) are shown. Nuclei are stained with DAPI (blue) and actin with a phalloidin–alexafluor-647 conjugate (magenta). Meningococci were detected with a polyclonal N. meningitidis antibody followed by alexafluor488-conjugated secondary antibody (green). Scale bars, 10 um. Channels from each individual fluorophore are displayed in addition to a merged image for each condition.
Fig. 6.
Fig. 6.
Expression states of opaD before and after infection of A549, and Calu-3 cells with wild-type R001 and R001ΔpilE. Opa expression states of input and output colonies from adhesion assays with wild-type R001 and R001ΔpilE in adhesion assays with A549 and ALI Calu-3 cells (see Fig. 3) were tested by GeneScan PCR. The graph shows the percentage of these colonies in either the ON (white bar fraction) or OFF (grey fraction) expression state. Data shown were obtained across four independent experiments for the A549 cells and two independent experiments for the Calu-3 cells (n, total number of bacterial colonies analysed).
Fig. 7.
Fig. 7.
Effect of pilE, opa and nadA mutants of three MenW:cc11 strains on Calu-3 monolayer permeability and tight junction integrity. Monolayers of Calu-3 cells, formed in an air–liquid phase, were infected with MenW:cc11 R001 (m.o.i. 30) for 1 h followed by removal of non-attached bacteria and incubation for a further 18 h. (a) Monolayer permeability was measured by determining the quantity of FITC-dextran (µg ml−1) in the basolateral chamber after 3 h. Error bars show the standard deviation of the mean from at least three independent biological replicates. Each individual experiment was performed with technical triplicates. Significance values are for comparisons with the relative wild-type strain. *, P<0.05; **, P<0.01 ***, P<0.001; and ****, P<0.0001 (one way-ANOVA). The full-time course of FITC-dextran permeation can be found in Fig. S6. (b) Infected monolayers were fixed with methanol and stained using monoclonal antibodies specific for occludin or a polyclonal meningococcal antisera (n=4). Control, uninfected Calu-3 monolayer showed expected pattern of expression and localization for occludin. Calu-3 monolayers infected with N. meningitidis MenW:cc11 (green) at 22 h p.i showed loss of uniform occludin (red) staining and diffuse localization in the cytoplasm. Scale bars sizes are indicated in the figure.

References

    1. Hill DJ, Griffiths NJ, Borodina E, Virji M. Cellular and molecular biology of Neisseria meningitidis colonization and invasive disease. Clin Sci. 2010;118:547–564. doi: 10.1042/CS20090513. - DOI - PMC - PubMed
    1. Mikucki A, McCluskey NR, Kahler CM. The host-pathogen interactions and epicellular lifestyle of Neisseria meningitidis . Front Cell Infect Microbiol. 2022;12:862935. doi: 10.3389/fcimb.2022.862935. - DOI - PMC - PubMed
    1. Tunkel AR, Scheld WM. Pathogenesis and pathophysiology of bacterial meningitis. Clin Microbiol Rev. 1993;6:118–136. doi: 10.1128/CMR.6.2.118. - DOI - PMC - PubMed
    1. Humbert MV, Christodoulides M. Atypical, Yet Not Infrequent, Infections with Neisseria Species. Pathogens. 2019;9:10. doi: 10.3390/pathogens9010010. - DOI - PMC - PubMed
    1. Rouphael NG, Stephens DS. Neisseria meningitidis: biology, microbiology, and epidemiology. Methods Mol Biol. 2012;799:1–20. doi: 10.1007/978-1-61779-346-2_1. - DOI - PMC - PubMed

Publication types