. 2023 Apr 3;133(7):e166031.
doi: 10.1172/JCI166031.

Glycolysis drives STING signaling to facilitate dendritic cell antitumor function

Affiliations

Glycolysis drives STING signaling to facilitate dendritic cell antitumor function

Zhilin Hu et al. J Clin Invest. .

Abstract

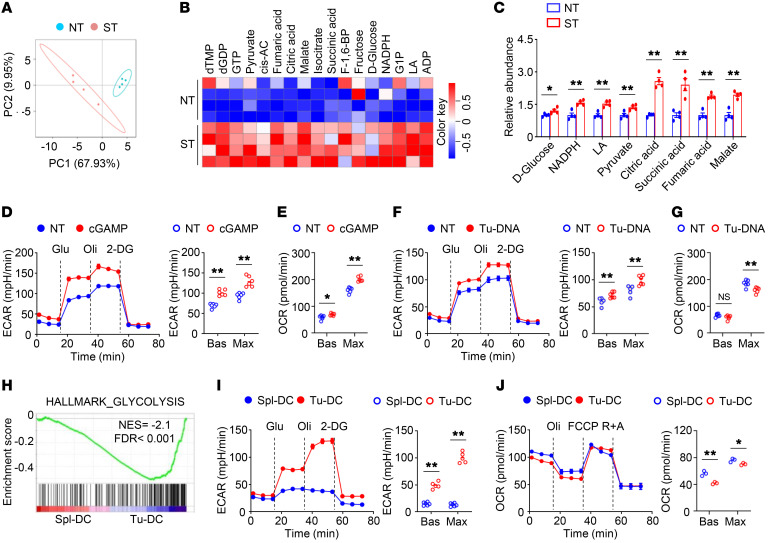
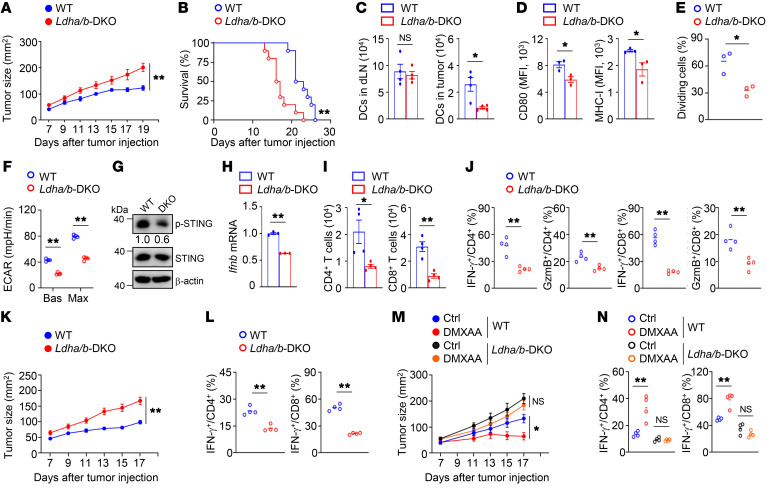
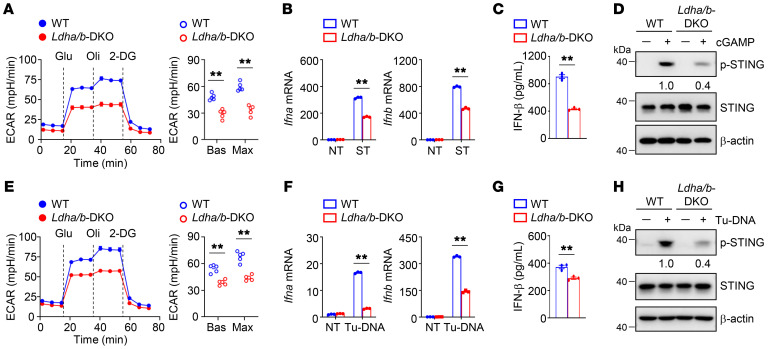
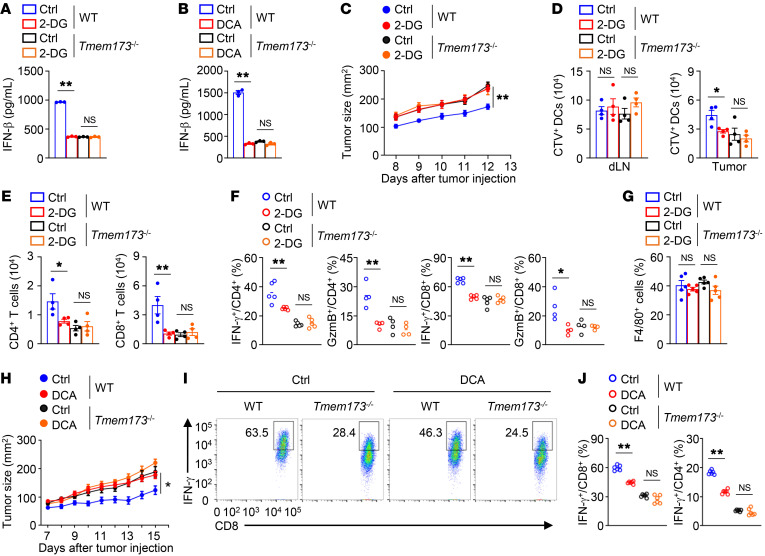
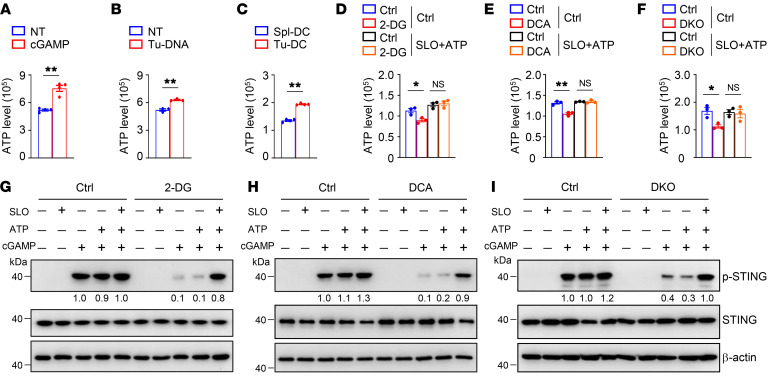
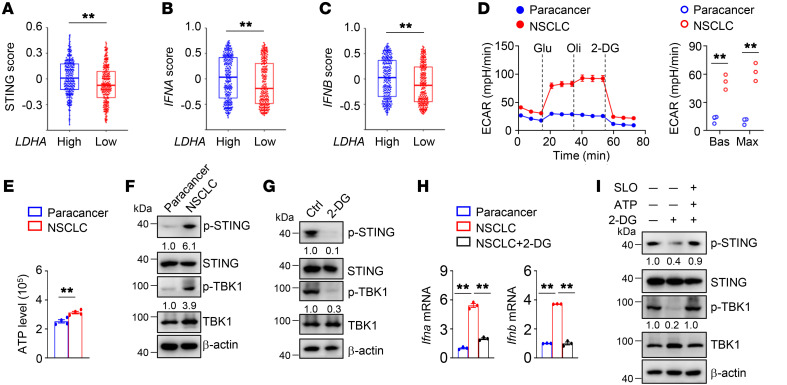
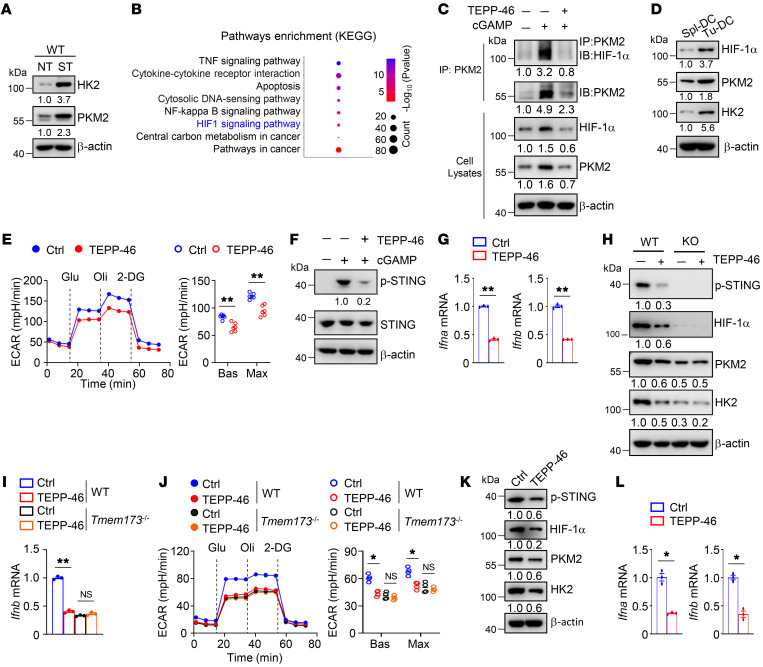
Activation of STING signaling in DCs promotes antitumor immunity. Aerobic glycolysis is a metabolic hallmark of activated DCs, but how the glycolytic pathway intersects with STING signaling in tumor-infiltrating DCs remains elusive. Here, we show that glycolysis drives STING signaling to facilitate DC-mediated antitumor immune responses. Tumor-infiltrating DCs exhibited elevated glycolysis, and blockade of glycolysis by DC-specific Ldha/Ldhb double deletion resulted in defective antitumor immunity. Mechanistically, glycolysis augmented ATP production to boost STING activation and STING-dependent DC antitumor functions. Moreover, DC-intrinsic STING activation accelerated HIF-1α-mediated glycolysis and established a positive feedback loop. Importantly, glycolysis facilitated STING-dependent DC activity in tissue samples from patients with non-small cell lung cancer. Our results provide mechanistic insight into how the crosstalk of glycolytic metabolism and STING signaling enhances DC antitumor activity and can be harnessed to improve cancer therapies.

Keywords: Cancer immunotherapy; Glucose metabolism; Immunology; Innate immunity; Metabolism.


Conflict of interest statement

Conflict of interest: The authors have declared that no conflict of interest exists.

Figures

Figure 1
Figure 1. STING signaling–activated DCs exhibit enhanced glycolysis.
(A) Principal components analysis (PCA) of central carbon metabolome of bone marrow–derived DCs (BMDCs) stimulated with 2 μg/mL 2′3′-cGAMP (cGAMP) for 4 hours (n = 4). Each symbol represents data from an individual mouse. NT, nontreated; ST, cGAMP stimulated. (B and C) Heatmap analysis (B) and graph presentation (C) of differential metabolites in NT and ST groups from A. (D and E) Extracellular acidification rate (ECAR; n = 6; D) and oxygen consumption rate (OCR; n = 5; E) of BMDCs stimulated with 2 μg/mL cGAMP for 4 hours under basal (Bas) or maximum (Max) conditions. (F and G) ECAR (n = 5; F) and OCR (n = 6; G) of BMDCs stimulated with 40 μg/mL tumor DNA (Tu-DNA) for 4 hours under Bas or Max conditions. (H) Gene set enrichment analysis of the hallmark glycolysis pathway in the freshly isolated tumor-infiltrating DCs (Tu-DC) compared with that of splenic DCs (Spl-DC). DCs were isolated from MC38 tumor-bearing WT mice on day 14 after tumor injection. (I and J) ECAR (n = 5; I) and OCR (n = 3; J) of splenic and tumor-infiltrating DCs isolated from MC38 tumor-bearing WT mice on day 14 after tumor injection. Representative data are shown from 3 independent experiments in DG, I, and J. Data are shown as the mean ± SEM. Statistical analysis was performed using 2-tailed Student’s t test; *P < 0.05; **P < 0.01.
Figure 2
Figure 2. Blockade of glycolysis inhibits DC antitumor function.
(A and B) Tumor growth (n = 10; A) and survival curves (n = 10; B) of mice inoculated s.c. with MC38 cells. Representative data shown in A and B are from different experiments. (C) The numbers of DCs in the draining lymph nodes (dLN) and tumors of tumor-bearing mice on day 14 after tumor inoculation (n = 4). (D) Flow cytometry analysis of CD80 and MHC-I expression in tumor-infiltrating DCs from tumor-bearing mice (n = 3). (E) Flow cytometric analysis of the division of CTV-labeled OT-I T cells cocultured with tumor-infiltrating DCs (n = 3). (F) ECAR of tumor-infiltrating DCs from tumor-bearing mice (n = 4). (G) Immunoblot analysis of tumor-infiltrating DCs from tumor-bearing mice. The numbers indicate the relative densities of indicated protein bands normalized to β-actin. (H) qRT-PCR analysis of isolated tumor-infiltrating DCs from tumor-bearing mice. (I and J) Flow cytometry analysis of T cells from tumor-bearing mice on day 14. (K) Tumor growth of MC38 tumor-bearing WT mice transferred with cGAMP-stimulated BMDCs on day 3 after tumor injection (n = 9). (L) Flow cytometry analysis of tumor-infiltrating T cells of the mice from K. (M) Tumor growth of mice after i.p. injection with 500 μg DMXAA on day 7 after MC38 tumor injection (n = 7). Ctrl, without DMXAA injection. (N) Flow cytometry analysis of tumor-infiltrating T cells of the mice from M. Representative data are shown from 3 independent experiments. Data are shown as the mean ± SEM. Statistical analysis was performed using 2-way ANOVA (A, K, and M), log-rank (Mantel-Cox) test (B), 1-way ANOVA (N), and 2-tailed Student’s t test (CF, HJ, and L); *P < 0.05; **P < 0.01.
Figure 3
Figure 3. Glycolysis drives STING signaling in DCs.
(A) ECAR of WT and Ldha/b-DKO BMDCs stimulated with 2 μg/mL cGAMP for 4 hours under Bas or Max conditions (n = 5). (B) Relative mRNA expression level of WT and Ldha/b-DKO BMDCs stimulated with 2 μg/mL cGAMP for 3 hours was determined by qRT-PCR. (C) IFN-β protein level of WT and Ldha/b-DKO BMDCs stimulated with 2 μg/mL cGAMP for 8 hours was determined by ELISA. (D) Immunoblot analysis of indicated proteins in whole-cell lysates of BMDCs stimulated with 2 μg/mL cGAMP for 4 hours. (E) ECAR of WT and Ldha/b-DKO BMDCs stimulated with 40 μg/mL Tu-DNA for 4 hours under Bas or Max conditions (n = 5). (F) Relative mRNA expression level of WT and Ldha/b-DKO BMDCs stimulated with 40 μg/mL Tu-DNA for 3 hours was determined by qRT-PCR. (G) IFN-β protein level of WT and Ldha/b-DKO BMDCs stimulated with 40 μg/mL Tu-DNA for 8 hours was determined by ELISA. (H) Immunoblot analysis of indicated proteins in whole-cell lysates of BMDCs stimulated with 40 μg/mL Tu-DNA for 4 hours. The numbers indicate the relative densities of indicated protein bands normalized to β-actin. Representative data are shown from 3 independent experiments. Data are shown as the mean ± SEM. Statistical analysis was performed using 2-tailed Student’s t test; **P < 0.01.
Figure 4
Figure 4. Glycolysis potentiates STING-dependent DC antitumor function.
(A and B) ELISA analysis of BMDCs treated with 2-DG (1 mM; A) or DCA (10 mM; B) overnight and then stimulated with cGAMP for 8 hours. (C) MC38 tumor growth of WT mice transferred with cGAMP-stimulated BMDCs. BMDCs were labeled with CTV following 2-DG (1 mM) treatment for 8 hours. 2-DG–pretreated BMDCs were then stimulated with cGAMP for 4 hours. MC38 tumor-bearing WT mice were injected s.c. adjacent to the tumor with 2 × 10⁶ cGAMP-stimulated DCs on days 3 and 6 after tumor injection (n = 8). (D) The numbers of CTV+ DCs in the draining lymph nodes and tumors from mice from C on day 8 after tumor inoculation (n = 4). (E) The numbers of tumor-infiltrating CD4+ and CD8+ T cells from mice from C on day 14 after tumor inoculation (n = 4). (F and G) Flow cytometry analysis of tumor-infiltrating CD4+ and CD8+ T cells (F) or F4/80+ macrophages (G) from mice from C on day 14 after tumor inoculation. (H) Tumor growth of MC38 tumor-bearing WT mice transferred with cGAMP-stimulated DCs. BMDCs were pretreated with DCA (10 mM) for 8 hours and then stimulated with cGAMP for 4 hours. MC38 tumor-bearing WT mice were injected s.c. adjacent to the tumor with 2 × 10⁶ cGAMP-stimulated DCs on days 3 and 6 after tumor injection (n = 8). (I and J) Flow cytometry analysis of tumor-infiltrating CD8+ and CD4+ T cells of the mice from H. Representative data are shown from 2 (CJ) and 3 (A and B) independent experiments. Data are shown as the mean ± SEM. Statistical analysis was performed using 1-way ANOVA (A, B, DG, and J) and 2-way ANOVA (C and H); *P < 0.05; **P < 0.01.
Figure 5
Figure 5. Glycolysis promotes STING signaling via glycolytic ATP production.
(A and B) Intracellular ATP of BMDCs stimulated with 2 μg/mL cGAMP (A) or 40 μg/mL Tu-DNA (B) for 4 hours. (C) Intracellular ATP of splenic DCs (Spl-DC) and tumor-infiltrating DCs (Tu-DC) isolated from WT mice inoculated s.c. with MC38 colon cancer cells at 14 days. (D and E) Intracellular ATP of BMDCs stimulated with 2 μg/mL cGAMP in the presence of streptolysin-O (SLO) and ATP for 2 hours. BMDCs were pretreated with 2-DG (1 mM; D) or DCA (10 mM; E) overnight and subsequently stimulated as indicated. (F) Intracellular ATP of WT and Ldha/b-DKO (DKO) BMDCs stimulated with 2 μg/mL cGAMP in the presence of SLO and ATP for 2 hours. (G and H) Immunoblot analysis of indicated proteins in whole-cell lysates of BMDCs stimulated with 2 μg/mL cGAMP in the presence of SLO and ATP for 2 hours. BMDCs were pretreated with 2-DG (1 mM; G) or DCA (10 mM; H) overnight and subsequently stimulated as indicated. (I) Immunoblot analysis of indicated proteins in whole-cell lysates of WT and Ldha/b-DKO BMDCs stimulated with 2 μg/mL cGAMP in the presence of SLO and ATP for 2 hours. The numbers indicate the relative densities of indicated protein bands normalized to β-actin. Representative data are shown from 3 independent experiments. Data are shown as the mean ± SEM. Statistical analysis was performed using 2-tailed Student’s t test (AC) and 1-way ANOVA (DF); *P < 0.05; **P < 0.01.
Figure 6
Figure 6. Glycolysis facilitates STING signaling in DCs from human NSCLC.
(AC) Correlation between LDHA transcripts and STING signature, including STING (A), IFNA (B), and IFNB (C), in TCGA data set of patients with lung cancer with low or high LDHA transcripts (n = 262). (D) ECAR of the freshly isolated DCs from the paracancerous tissue and NSCLC tissue under Bas or Max conditions. (E) Intracellular ATP of the freshly isolated DCs from the paracancerous tissue and NSCLC tissue. (F) Immunoblot analysis of indicated proteins in whole-cell lysates of the freshly isolated DCs from the paracancerous tissue and NSCLC tissue. (G) Immunoblot analysis of the freshly isolated NSCLC DCs treated with 2-DG (5 mM) for 8 hours. Ctrl, without 2-DG treatment. (H) qRT-PCR analysis of DCs isolated from the paracancerous tissue and NSCLC tissue and NSCLC DCs treated with 2-DG (5 mM) for 8 hours. (I) Immunoblot analysis of indicated proteins in whole-cell lysates of human NSCLC DCs that were pretreated with 2-DG (5 mM) for 6 hours and subsequently incubated in the presence or absence of ATP and SLO for 3 hours. The numbers indicate the relative densities of indicated protein bands normalized to β-actin. Data are representative of 3 independent experiments (DI). Data are shown as the mean ± SEM. Statistical analysis was performed using a paired 2-sided Wilcoxon signed-rank test (AC), 2-tailed Student’s t test (D and E), and 1-way ANOVA (H); **P < 0.01.
Figure 7
Figure 7. STING signaling promotes glycolysis and enables a positive feedback circuitry.
(A) Immunoblot analysis of indicated proteins in whole-cell lysates of BMDCs stimulated with 2 μg/mL cGAMP for 4 hours. (B) Functional enrichment analysis of KEGG pathways in BMDCs stimulated with 2 μg/mL cGAMP for 4 hours. (C) Immunoprecipitation assays using indicated antibodies in BMDCs stimulated with 2 μg/mL cGAMP in the presence or absence of TEPP-46 (100 μM) for 4 hours. (D) Immunoblot analysis of indicated proteins in whole-cell lysates of splenic DCs (Spl-DC) and tumor-infiltrating DCs (Tu-DC) isolated from MC38 tumor-bearing WT mice on day 14 after tumor inoculation. (EG) ECAR (E), immunoblot analysis (F), and qRT-PCR analysis (G) of BMDCs stimulated with 2 μg/mL cGAMP in the presence or absence of TEPP-46 (100 μM) for 4 hours. (HJ) Immunoblot analysis (H), qRT-PCR analysis (I), and ECAR (J) of tumor-infiltrating DCs from WT and Tmem173–/– (KO) mice i.p. injected with 50 mg/kg TEPP-46 on days 3, 5, and 7 after MC38 tumor cell inoculation. Ctrl, without TEPP-46 injection. (K and L) Immunoblot analysis (K) and qRT-PCR analysis (L) of human NSCLC DCs treated with TEPP-46 (100 μM) for 8 hours. The numbers indicate the relative densities of indicated protein bands normalized to β-actin. Data are representative of 3 independent experiments (A and CL). Data are shown as the mean ± SEM. Statistical analysis was performed using 1-way ANOVA (I and J) and 2-tailed Student’s t test (E, G, and L); *P < 0.05; **P < 0.01.

References

    1. Duong E, et al. Type I interferon activates MHC class I-dressed CD11b+ conventional dendritic cells to promote protective anti-tumor CD8+ T cell immunity. Immunity. 2022;55(2):308–323. doi: 10.1016/j.immuni.2021.10.020. - DOI - PMC - PubMed
    1. Salomon R, et al. Bispecific antibodies increase the therapeutic window of CD40 agonists through selective dendritic cell targeting. Nat Cancer. 2022;3(3):287–302. doi: 10.1038/s43018-022-00329-6. - DOI - PubMed
    1. Chen Q, et al. Regulation and function of the cGAS-STING pathway of cytosolic DNA sensing. Nat Immunol. 2016;17(10):1142–1149. doi: 10.1038/ni.3558. - DOI - PubMed
    1. Hu Z, et al. SENP3 senses oxidative stress to facilitate STING-dependent dendritic cell antitumor function. Mol Cell. 2021;81(5):940–952. doi: 10.1016/j.molcel.2020.12.024. - DOI - PubMed
    1. Wang H, et al. cGAS is essential for the antitumor effect of immune checkpoint blockade. Proc Natl Acad Sci U S A. 2017;114(7):1637–1642. doi: 10.1073/pnas.1621363114. - DOI - PMC - PubMed

Publication types