. 2023 Apr 10;8(7):e168142.
doi: 10.1172/jci.insight.168142.

CD11c+ macrophages are proangiogenic and necessary for experimental choroidal neovascularization

Affiliations

CD11c+ macrophages are proangiogenic and necessary for experimental choroidal neovascularization

Steven Droho et al. JCI Insight. .

Abstract

Patients with neovascular AMD (nAMD) suffer vision loss from destructive angiogenesis, termed choroidal neovascularization (CNV). Macrophages are found in CNV lesions from patients with nAMD. Additionally, Ccr2-/- mice, which lack classical monocyte-derived macrophages, show reduced CNV size. However, macrophages are highly diverse cells that can perform multiple functions. We performed single-cell RNA-Seq on immune cells from WT and Ccr2-/- eyes to uncover macrophage heterogeneity during the laser-induced CNV mouse model of nAMD. We identified 12 macrophage clusters, including Spp1+ macrophages. Spp1+ macrophages were enriched from WT lasered eyes and expressed a proangiogenic transcriptome via multiple pathways, including vascular endothelial growth factor signaling, endothelial cell sprouting, cytokine signaling, and fibrosis. Additionally, Spp1+ macrophages expressed the marker CD11c, and CD11c+ macrophages were increased by laser and present in CNV lesions. Finally, CD11c+ macrophage depletion reduced CNV size by 40%. These findings broaden our understanding of ocular macrophage heterogeneity and implicate CD11c+ macrophages as potential therapeutic targets for treatment-resistant patients with nAMD.

Keywords: Inflammation; Macrophages; Ophthalmology; Retinopathy.


Conflict of interest statement

Conflict of interest: The authors have declared that no conflict of interest exists.

Figures

Figure 1
Figure 1. Single-cell identification of CD45+ immune cells.
(A) Schematic of experimental groups (n = 9–15 mice per group). (B) Flow cytometry gating strategy for Live and Singlet CD45+ immune cells from whole mouse eyes for scRNA-Seq. (C) UMAP dimension plot. (D) Dot plot of marker genes for each cell type. (E) UMAP dimension plot split by experimental group. (F) Proportion of cells derived from each experimental group. Black bracket indicates cell types used for reclustering in Figure 2.
Figure 2
Figure 2. Single-cell identification of ocular mononuclear phagocytes.
(A) UMAP dimension plot. (B) Dot plot of marker genes for each cell type. (C) UMAP dimension plot split by experimental group. (D) Proportion of cells derived from each experimental group. Black bracket indicates cell types used for reclustering in Figure 3.
Figure 3
Figure 3. Single-cell identification of ocular macrophages.
(A) UMAP dimension plot. (B) Dot plot of marker genes for each cell type. (C) UMAP dimension plot split by experimental group. (D) Proportion of cells derived from each experimental group. *P < 0.001 by hypergeometric enrichment test. Color of asterisk identifies which groups were enriched.
Figure 4
Figure 4. Gene ontology (GO) enrichment analysis of ocular macrophages.
(A) Graph of GO enrichment from each macrophage cluster visualizing GO term on the y axis, fold enrichment on the x axis, FDR q value in color, and number of genes as the size of the circle. (BD) Dot plot graphs of genes that were differentially expressed in the positive regulation of angiogenesis (B), lipid catabolism and localization (C), and glycolysis (D) GO terms.
Figure 5
Figure 5. Spp1+ MDMs express CD11c, and CD11c+ macrophages are present prior to and during laser CNV growth.
(A) Dot plot graph of Itgax/CD11c expression in each macrophages cluster. (BJ) IF imaging of laser CNV lesions from choroidal whole mounts using CD11cCre–eGFP mice. (BD) On Day 3, GFP+IBA1+ and GFPIBA1+ macrophages were present at laser injury sites (lack of hexagonal Actin+ RPE cells). (EG) On Day 5, GFP+IBA1+ macrophages were near early CD31+ neovascular lesions. (HJ) On Day 7, GFP+IBA1+ macrophages were present in mature CD31+ neovascularizations. White boxes indicate magnified areas in C, D, F, G, I, and J insets. White arrows indicate GFP+IBA1+ colocalizing cells. Scale bars: 100 μm (B, E, and H).
Figure 6
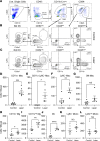
Figure 6. CD11c+ macrophages are significantly increased by laser injury.
(A) Flow cytometry gating strategy. Left panel: CD45+ cells were identified from Live, Singlet cells identically to Figure 1B. Middle left panel: Lineage (CD4, CD8 [T cells], B220 [B cells], Ly6G [neutrophils], NK1.1 [NK cells], SiglecF [eosinophils]) versus CD11b plot to gate forward CD11b+Lin mononuclear phagocytes. Middle right panel: CD64+ macrophages were discriminated from CD64 monocytes and DCs. Right panel: Cx3cr1 versus CD45 plot to delineate Cx3cr1hiCD45dim microglia from CD45hi infiltrating macrophages. (B and C) Flow cytometry gating strategy for the identification of macrophage and microglia subtypes, DCs, and monocytes from control (B) and laser-treated (C) choroid and retina. Right panel: CD45hi infiltrating macrophages were separated into 4 groups: CD11c+, CD11c+Ly6C+, Ly6C+, and double-negative (DN) macrophages. Middle right panel: CD45dim microglia were divided into 2 groups: CD11c+ and CD11c microglia. Middle left panel: DCs were identified as CD64MHCII+CD11c+ cells. Left panel: Ly6C versus Cx3cr1 plot from Not DC cells to delineate Ly6C+Cx3cr1+ classical monocytes and Ly6CCx3cr1+ nonclassical monocytes. (DF and HJ) Quantitative analysis of mononuclear phagocyte cell numbers after laser treatment. CD11c+ macrophages (D, Welch’s t test), CD11c+Ly6C+ macrophages (E, Welch’s t test), Ly6C+ macrophages (F, unpaired t test), CD11c+ microglia (H, unpaired t test), CD11c microglia (I, unpaired t test), and DCs (J, unpaired t test) were significantly increased in the choroid and retina after laser treatment (n = 6 per group for all). (G, K, and L) DN macrophage (G, Welch’s t test), classical monocyte (K, unpaired t test), and nonclassical monocytes (L, Welch’s t test) numbers were not significantly increased after laser treatment. *P < 0.05, **P < 0.01, ***P < 0.001, ****P < 0.0001.
Figure 7
Figure 7. CD11c+MaciDTR mice deplete CD11c+ macrophages.
(A) Breeding strategy to generate CD11c+MaciDTR mice. (B) Schematic of experimental design. (C) Flow cytometry gating strategy. Top: control no laser. Middle: Laser + PBS. Bottom: Laser + DT. Middle left panel: CD11b+Lin cells were identified identically to Figure 6A. CD64 was used to differentiate macrophages from nonmacrophage populations. Middle right panel: Cx3cr1 versus CD45 plot to discriminate CD45dim microglia from CD45hi macrophages. Right panel: GFP versus mCherry plot to separate GFP+mCherry+CD11c+ macrophages from GFPmCherryCD11c macrophages. Left panel: GFP versus CD11c plot to identify GFP+CD11c+ DCs. (DG) Quantitative analysis of mononuclear phagocyte groups. (D) CD11c+ macrophages were increased 9-fold in the laser + PBS group and depleted by 65% by DT. (E) CD11c macrophages were increased by laser and unaffected by DT. (F and G) Microglia (F) and DCs (G) were increased by laser and also depleted by DT treatment. n = 5–10 per group for all. Brown-Forsythe and Welch’s ANOVA followed by Dunnett’s T3 multiple comparisons test. **P < 0.01, ***P < 0.001, ****P < 0.0001.
Figure 8
Figure 8. CD11c+MaciDTR mice have reduced CNV area.
(A and B) IF imaging of choroidal whole mounts on Day 3 after laser injury from CD11c+MaciDTR mice. (A) In PBS-treated mice, both GFPIBA1+ (arrowheads) and GFP+IBA1+ (white arrows) macrophages were present at laser injury sites. (B) In DT-treated mice, GFPIBA1+ macrophages (arrowheads) and GFP+IBA1 DCs were present, but GFP+IBA1+ macrophages were depleted. (C) Schematic of experimental design for laser CNV analysis. (D and E) Representative IF image on Day 7 from a PBS-treated mouse. GFP+IBA1+ macrophages were found on Day 7 in the CD31+ CNV lesion. (G and H) Representative IF image on Day 7 from a DT-treated mouse. GFP+IBA1+ macrophages were depleted by DT and CD31+ CNV lesion area was decreased. (F and I) Quantitative analysis of CNV area between PBS- and DT-treated mice. DT treatment reduced CNV area by 40% in both per lesion (n = 54–62 per group, **P < 0.01, Mann Whitney U test) and per mouse (n = 8 per group, *P < 0.05, Mann Whitney U test) analysis. Scale bars: 100 μm.

References

    1. Mullins RF, et al. Drusen associated with aging and age-related macular degeneration contain proteins common to extracellular deposits associated with atherosclerosis, elastosis, amyloidosis, and dense deposit disease. FASEB J. 2000;14(7):835–846. doi: 10.1096/fasebj.14.7.835. - DOI - PubMed
    1. Nozaki M, et al. Drusen complement components C3a and C5a promote choroidal neovascularization. Proc Natl Acad Sci U S A. 2006;103(7):2328–2333. doi: 10.1073/pnas.0408835103. - DOI - PMC - PubMed
    1. Rosenfeld PJ, et al. Ranibizumab for neovascular age-related macular degeneration. N Engl J Med. 2006;355(14):1419–1431. doi: 10.1056/NEJMoa054481. - DOI - PubMed
    1. Brown DM, et al. Ranibizumab versus verteporfin for neovascular age-related macular degeneration. N Engl J Med. 2006;355(14):1432–1444. doi: 10.1056/NEJMoa062655. - DOI - PubMed
    1. CATT Research Group. et al. Ranibizumab and bevacizumab for neovascular age-related macular degeneration. N Engl J Med. 2011;364(20):1897–1908. doi: 10.1056/NEJMoa1102673. - DOI - PMC - PubMed

Publication types

MeSH terms

Substances