. 2023 Mar 28;42(3):112129.
doi: 10.1016/j.celrep.2023.112129. Epub 2023 Feb 22.

TGF-β in the microenvironment induces a physiologically occurring immune-suppressive senescent state

Affiliations

TGF-β in the microenvironment induces a physiologically occurring immune-suppressive senescent state

Satoru Matsuda et al. Cell Rep. .

Abstract

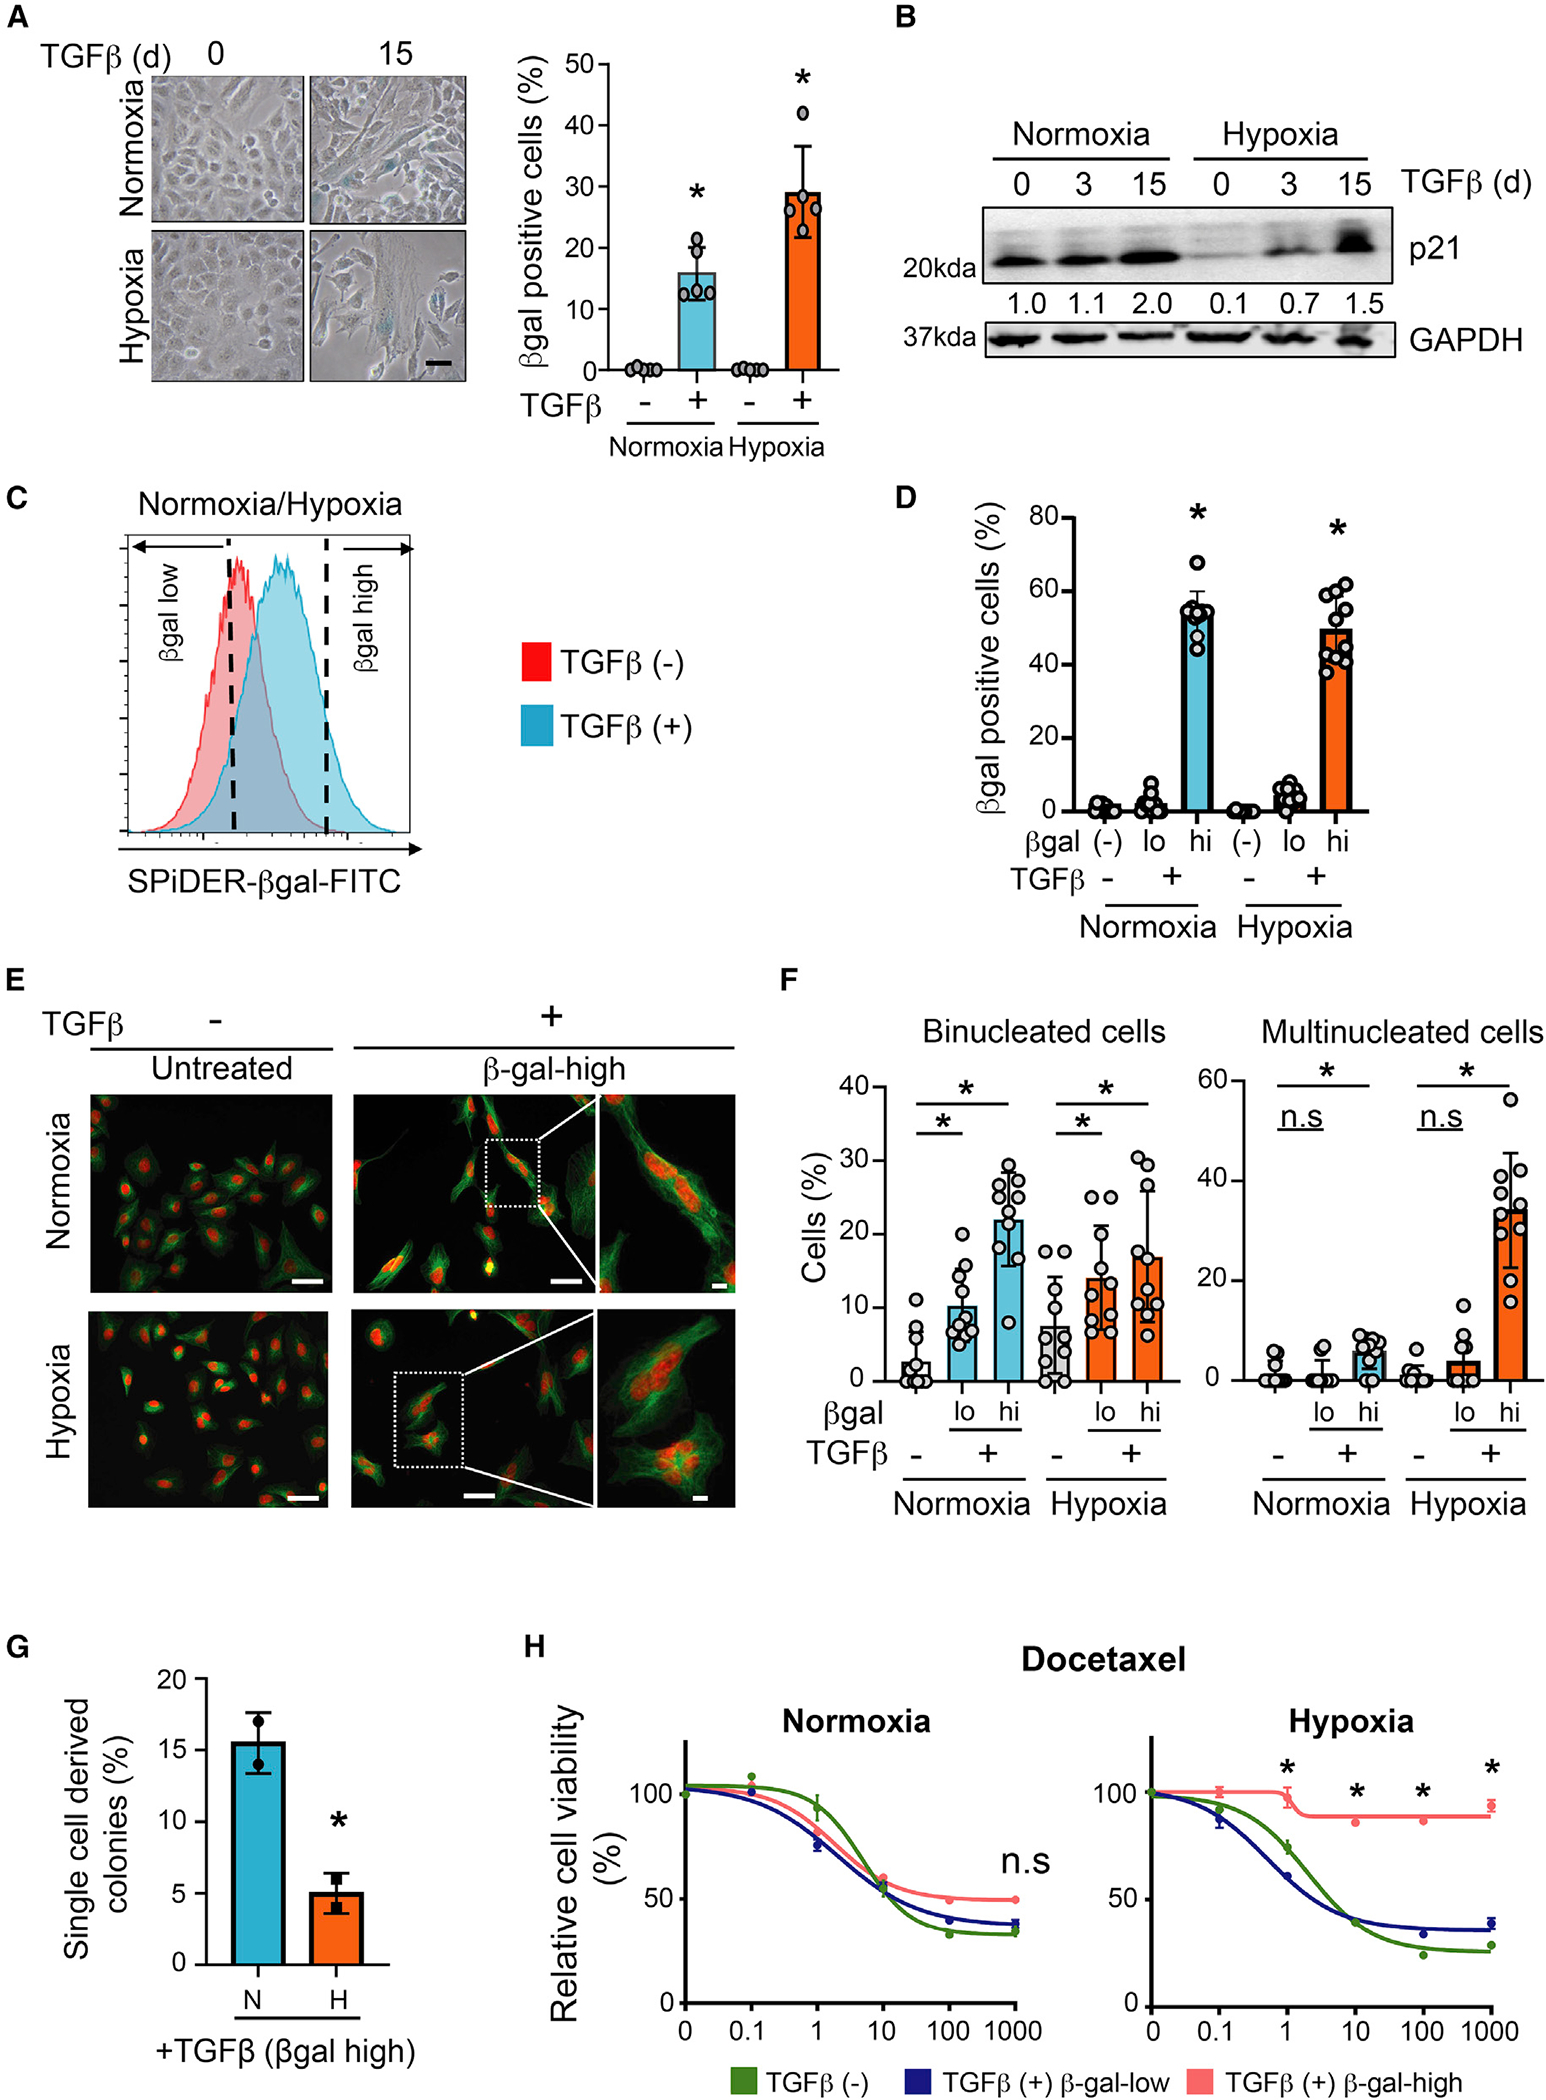
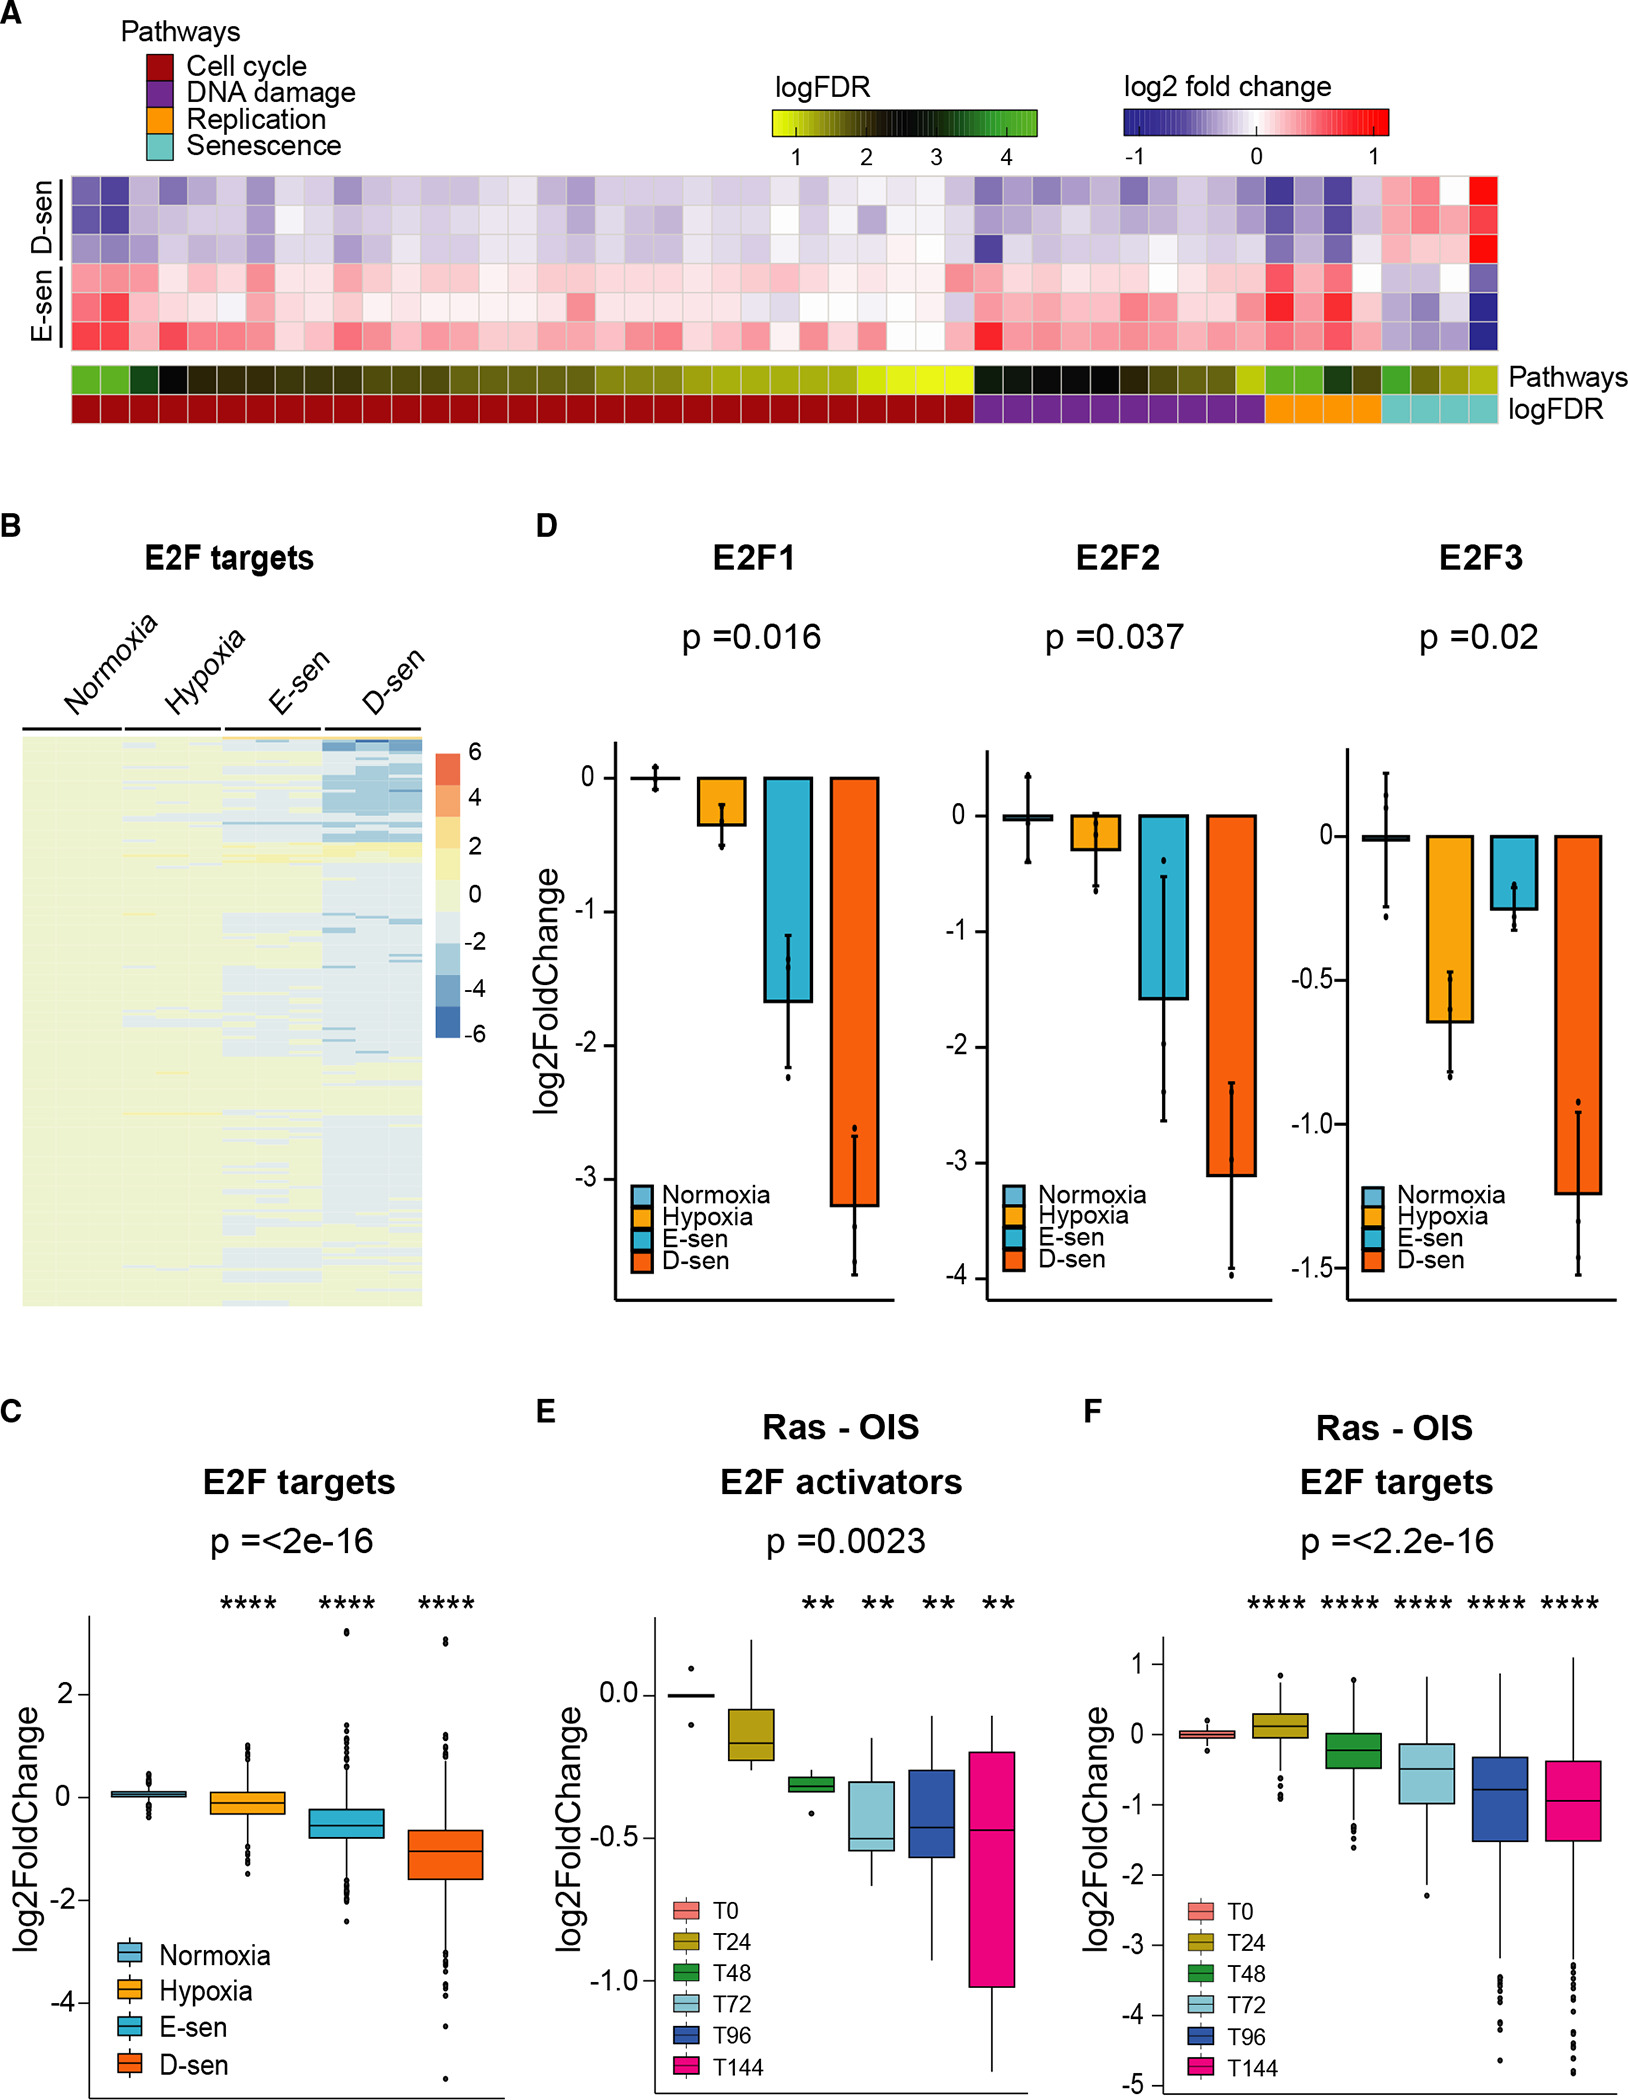
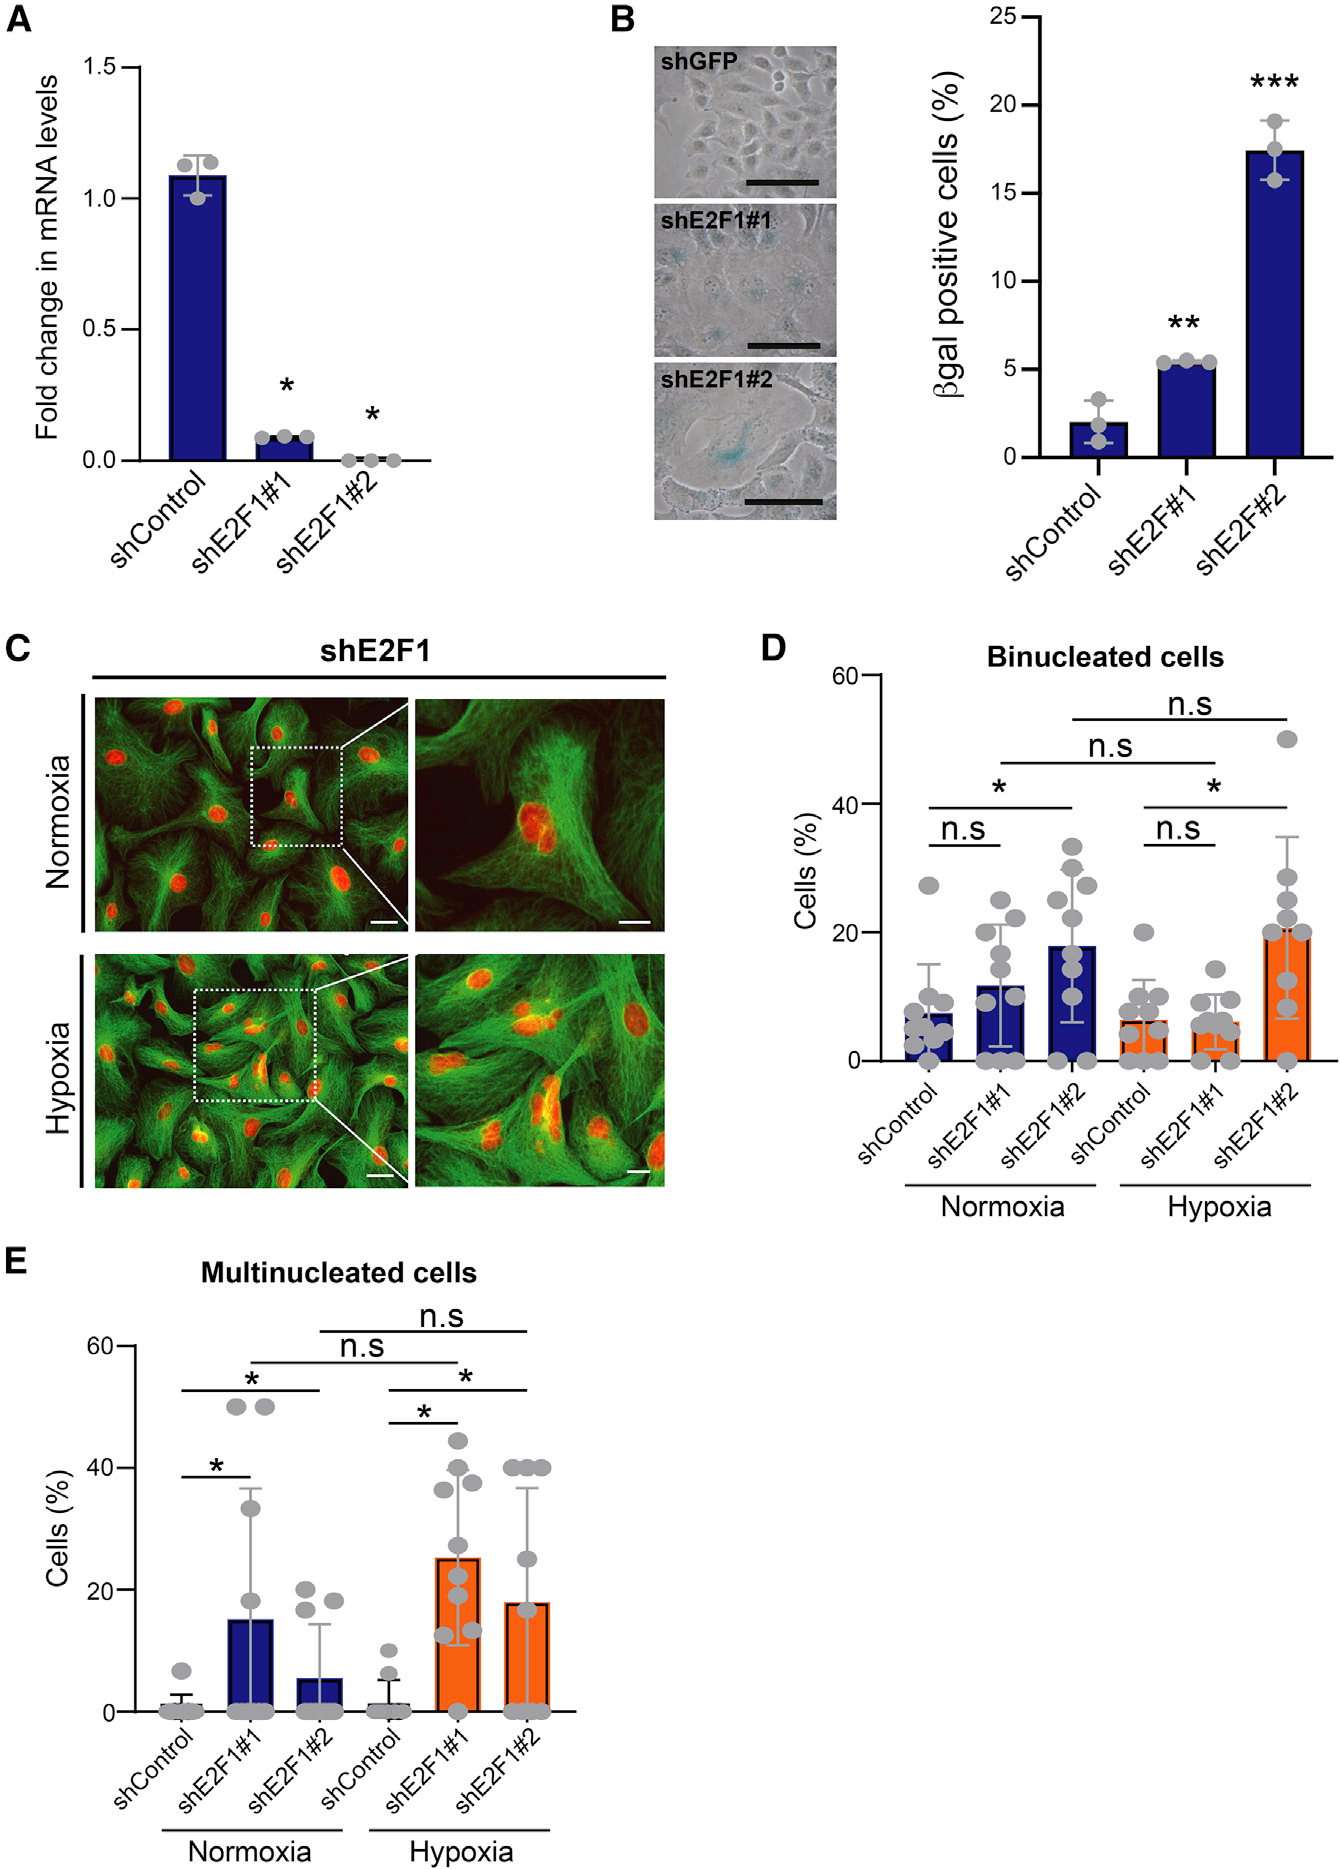
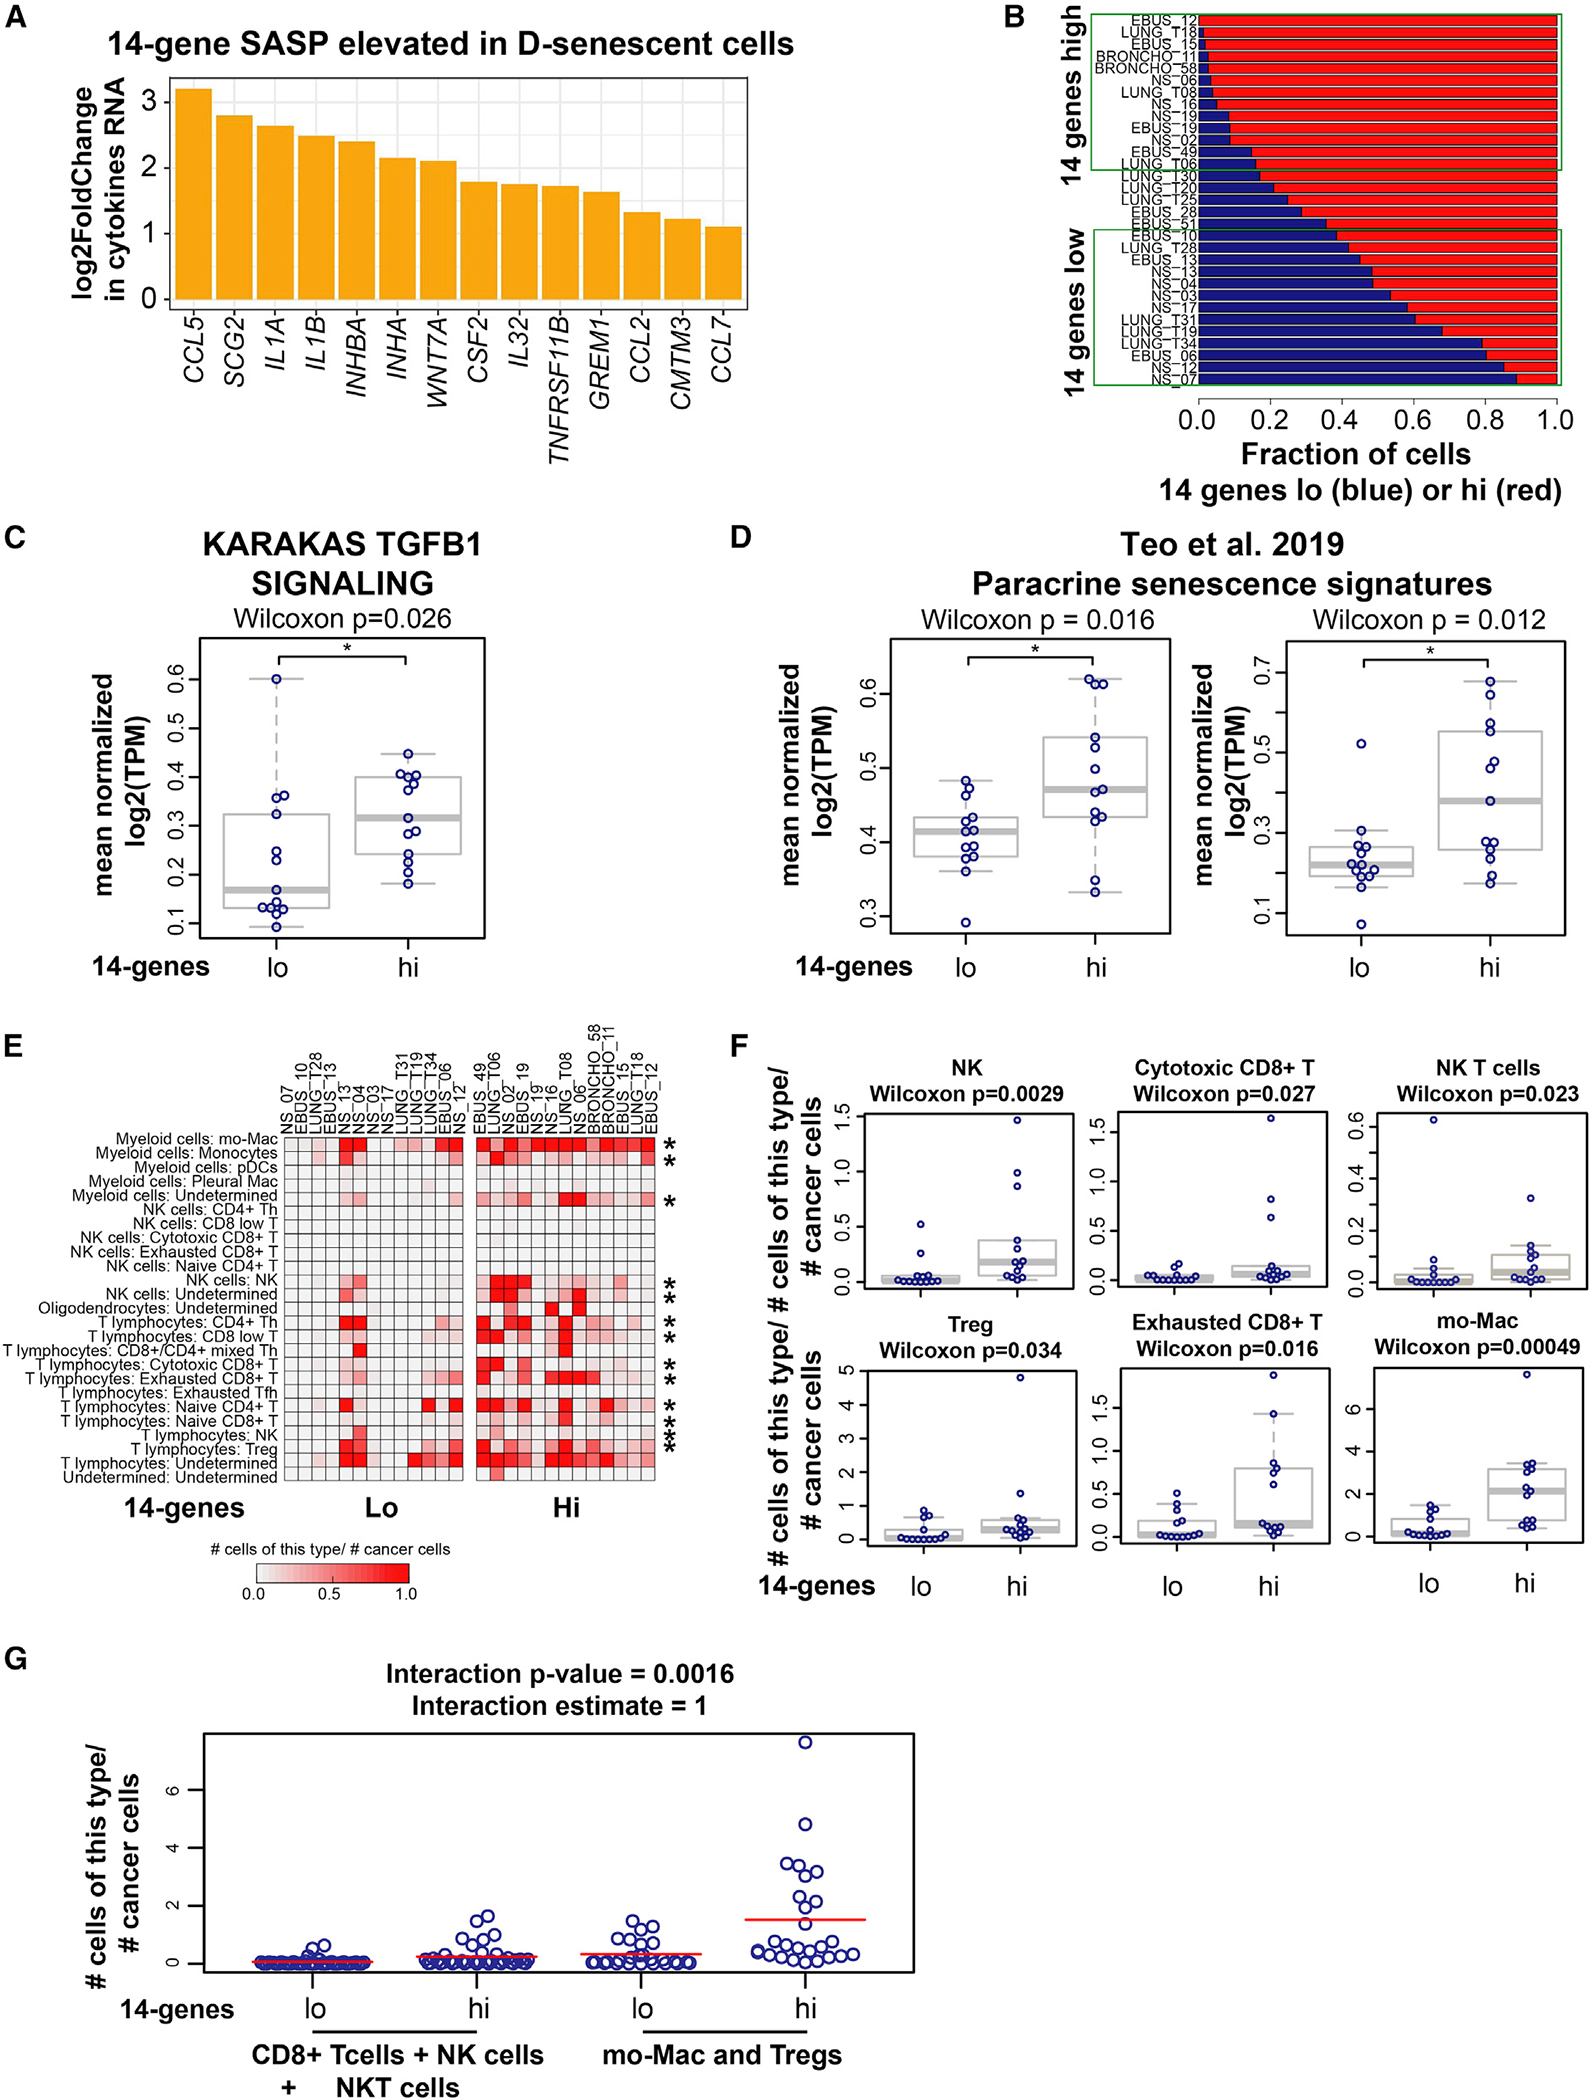
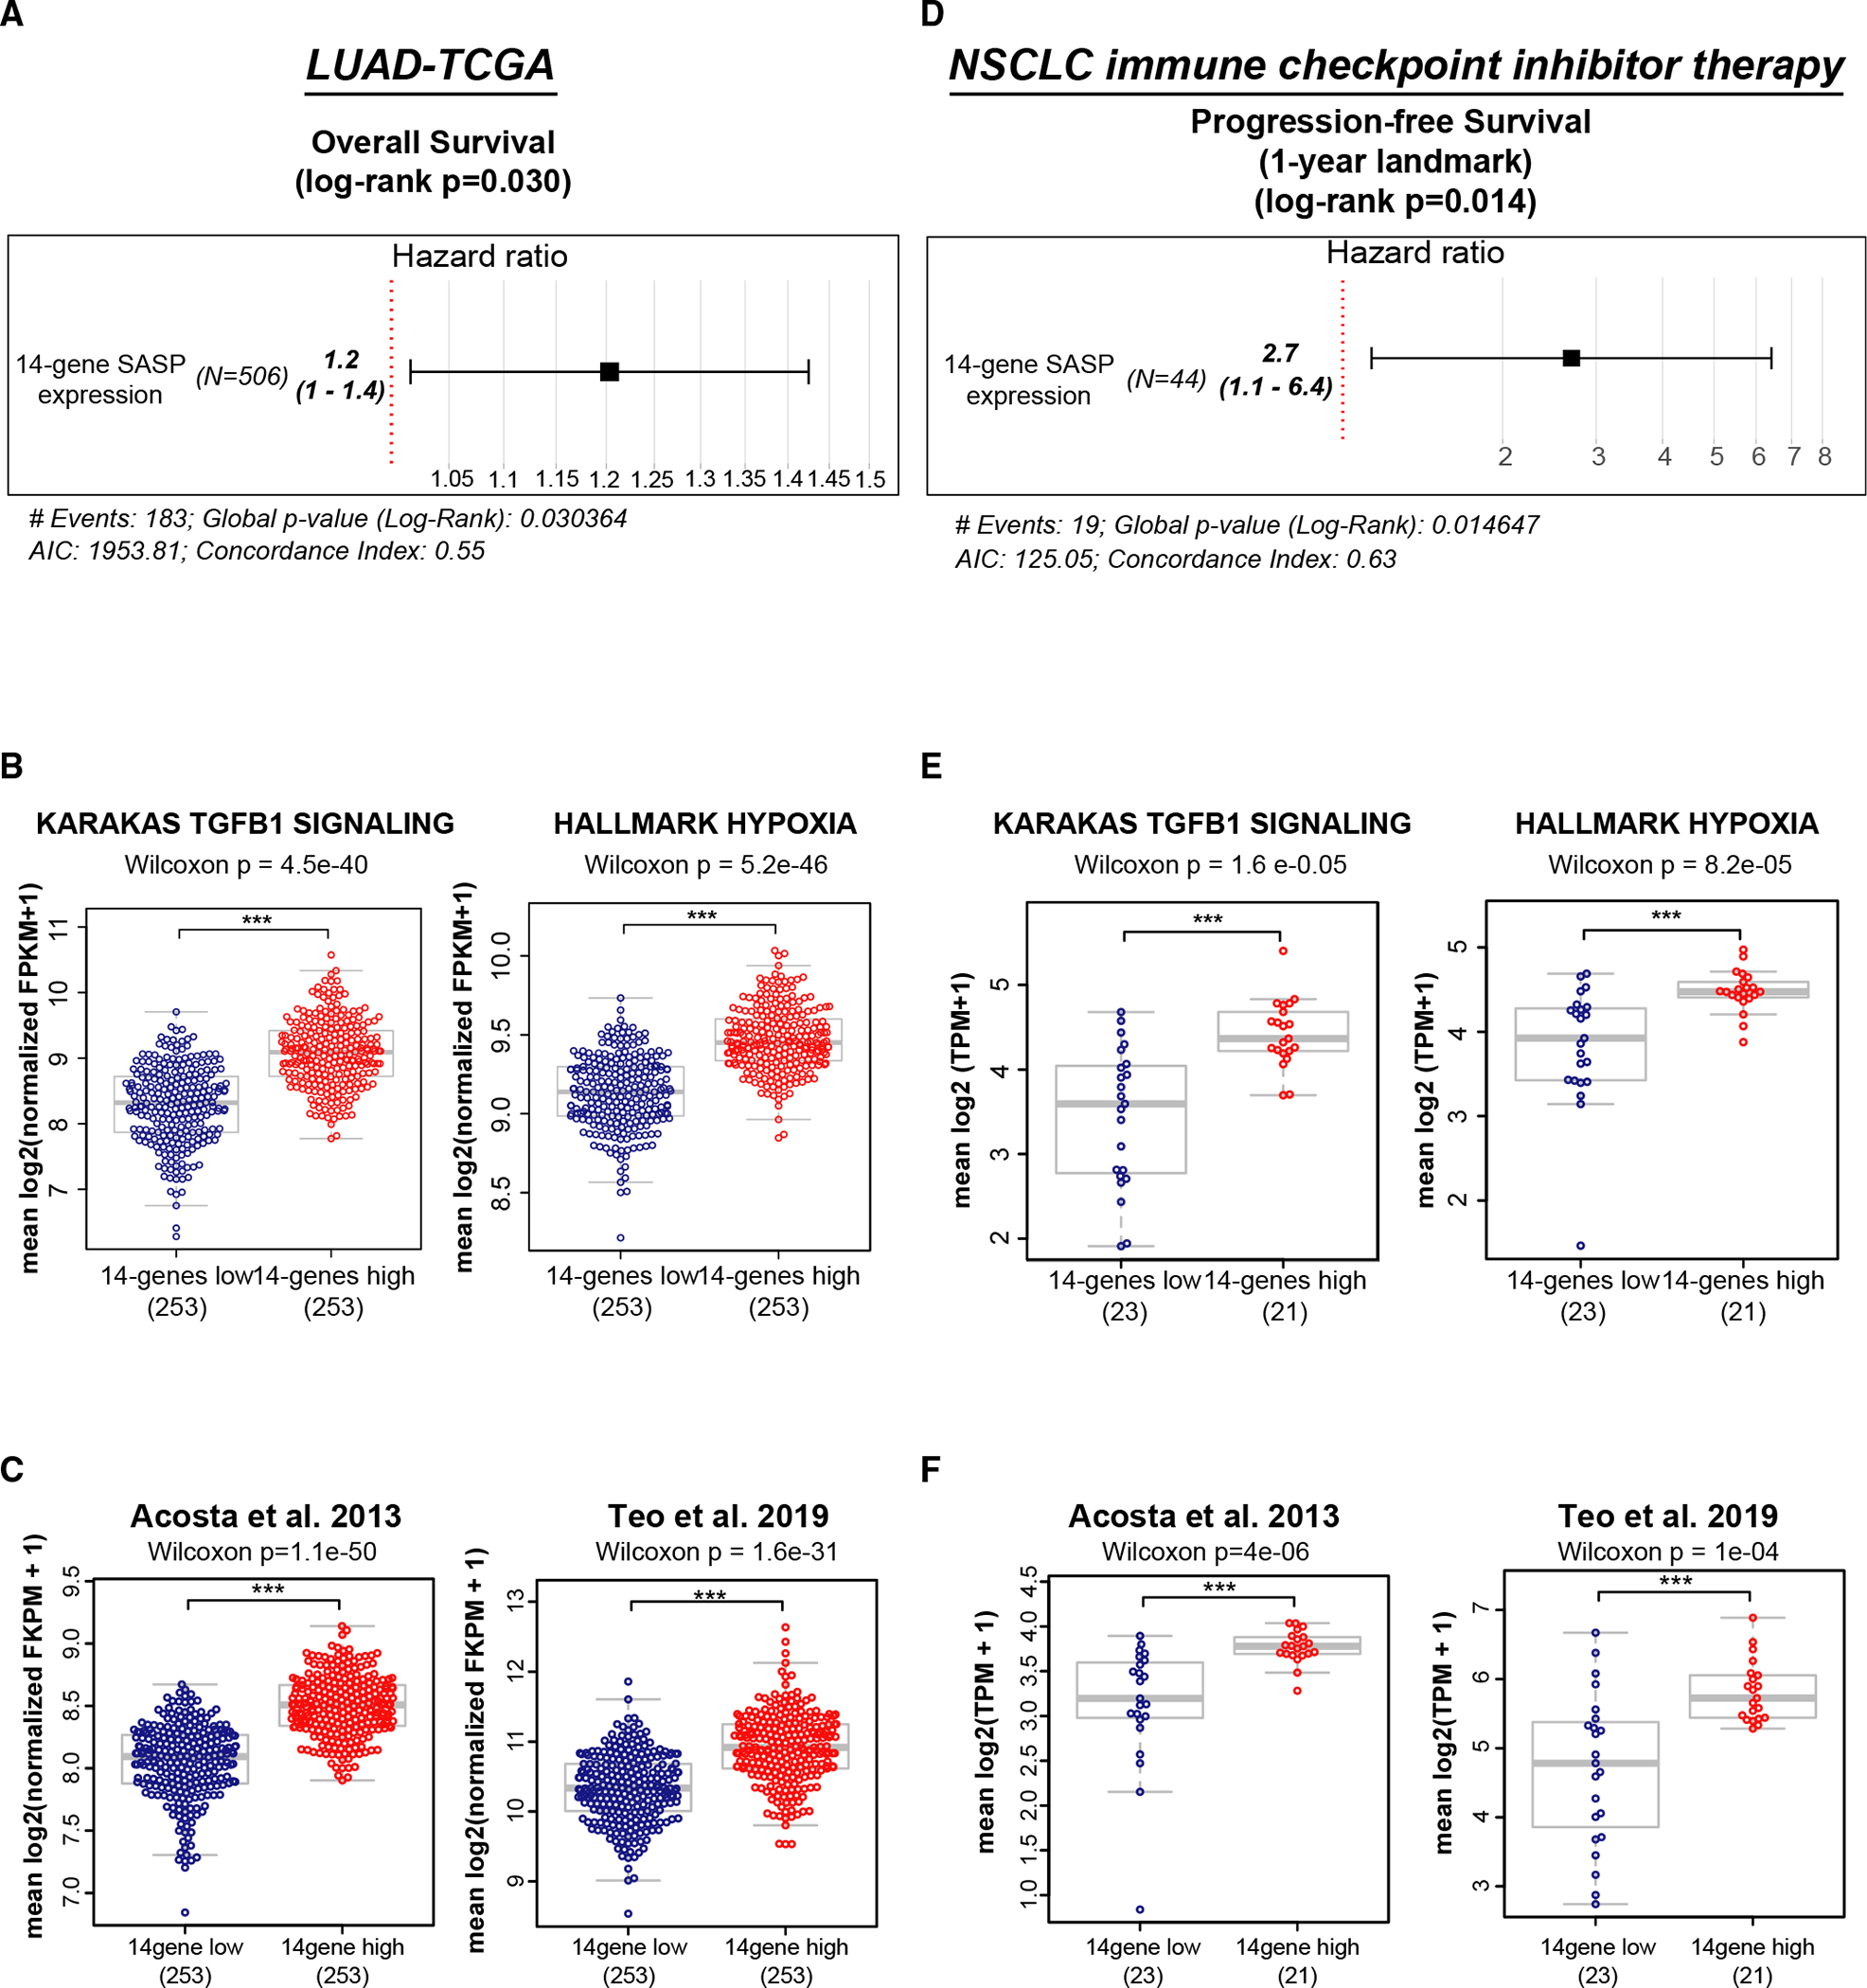
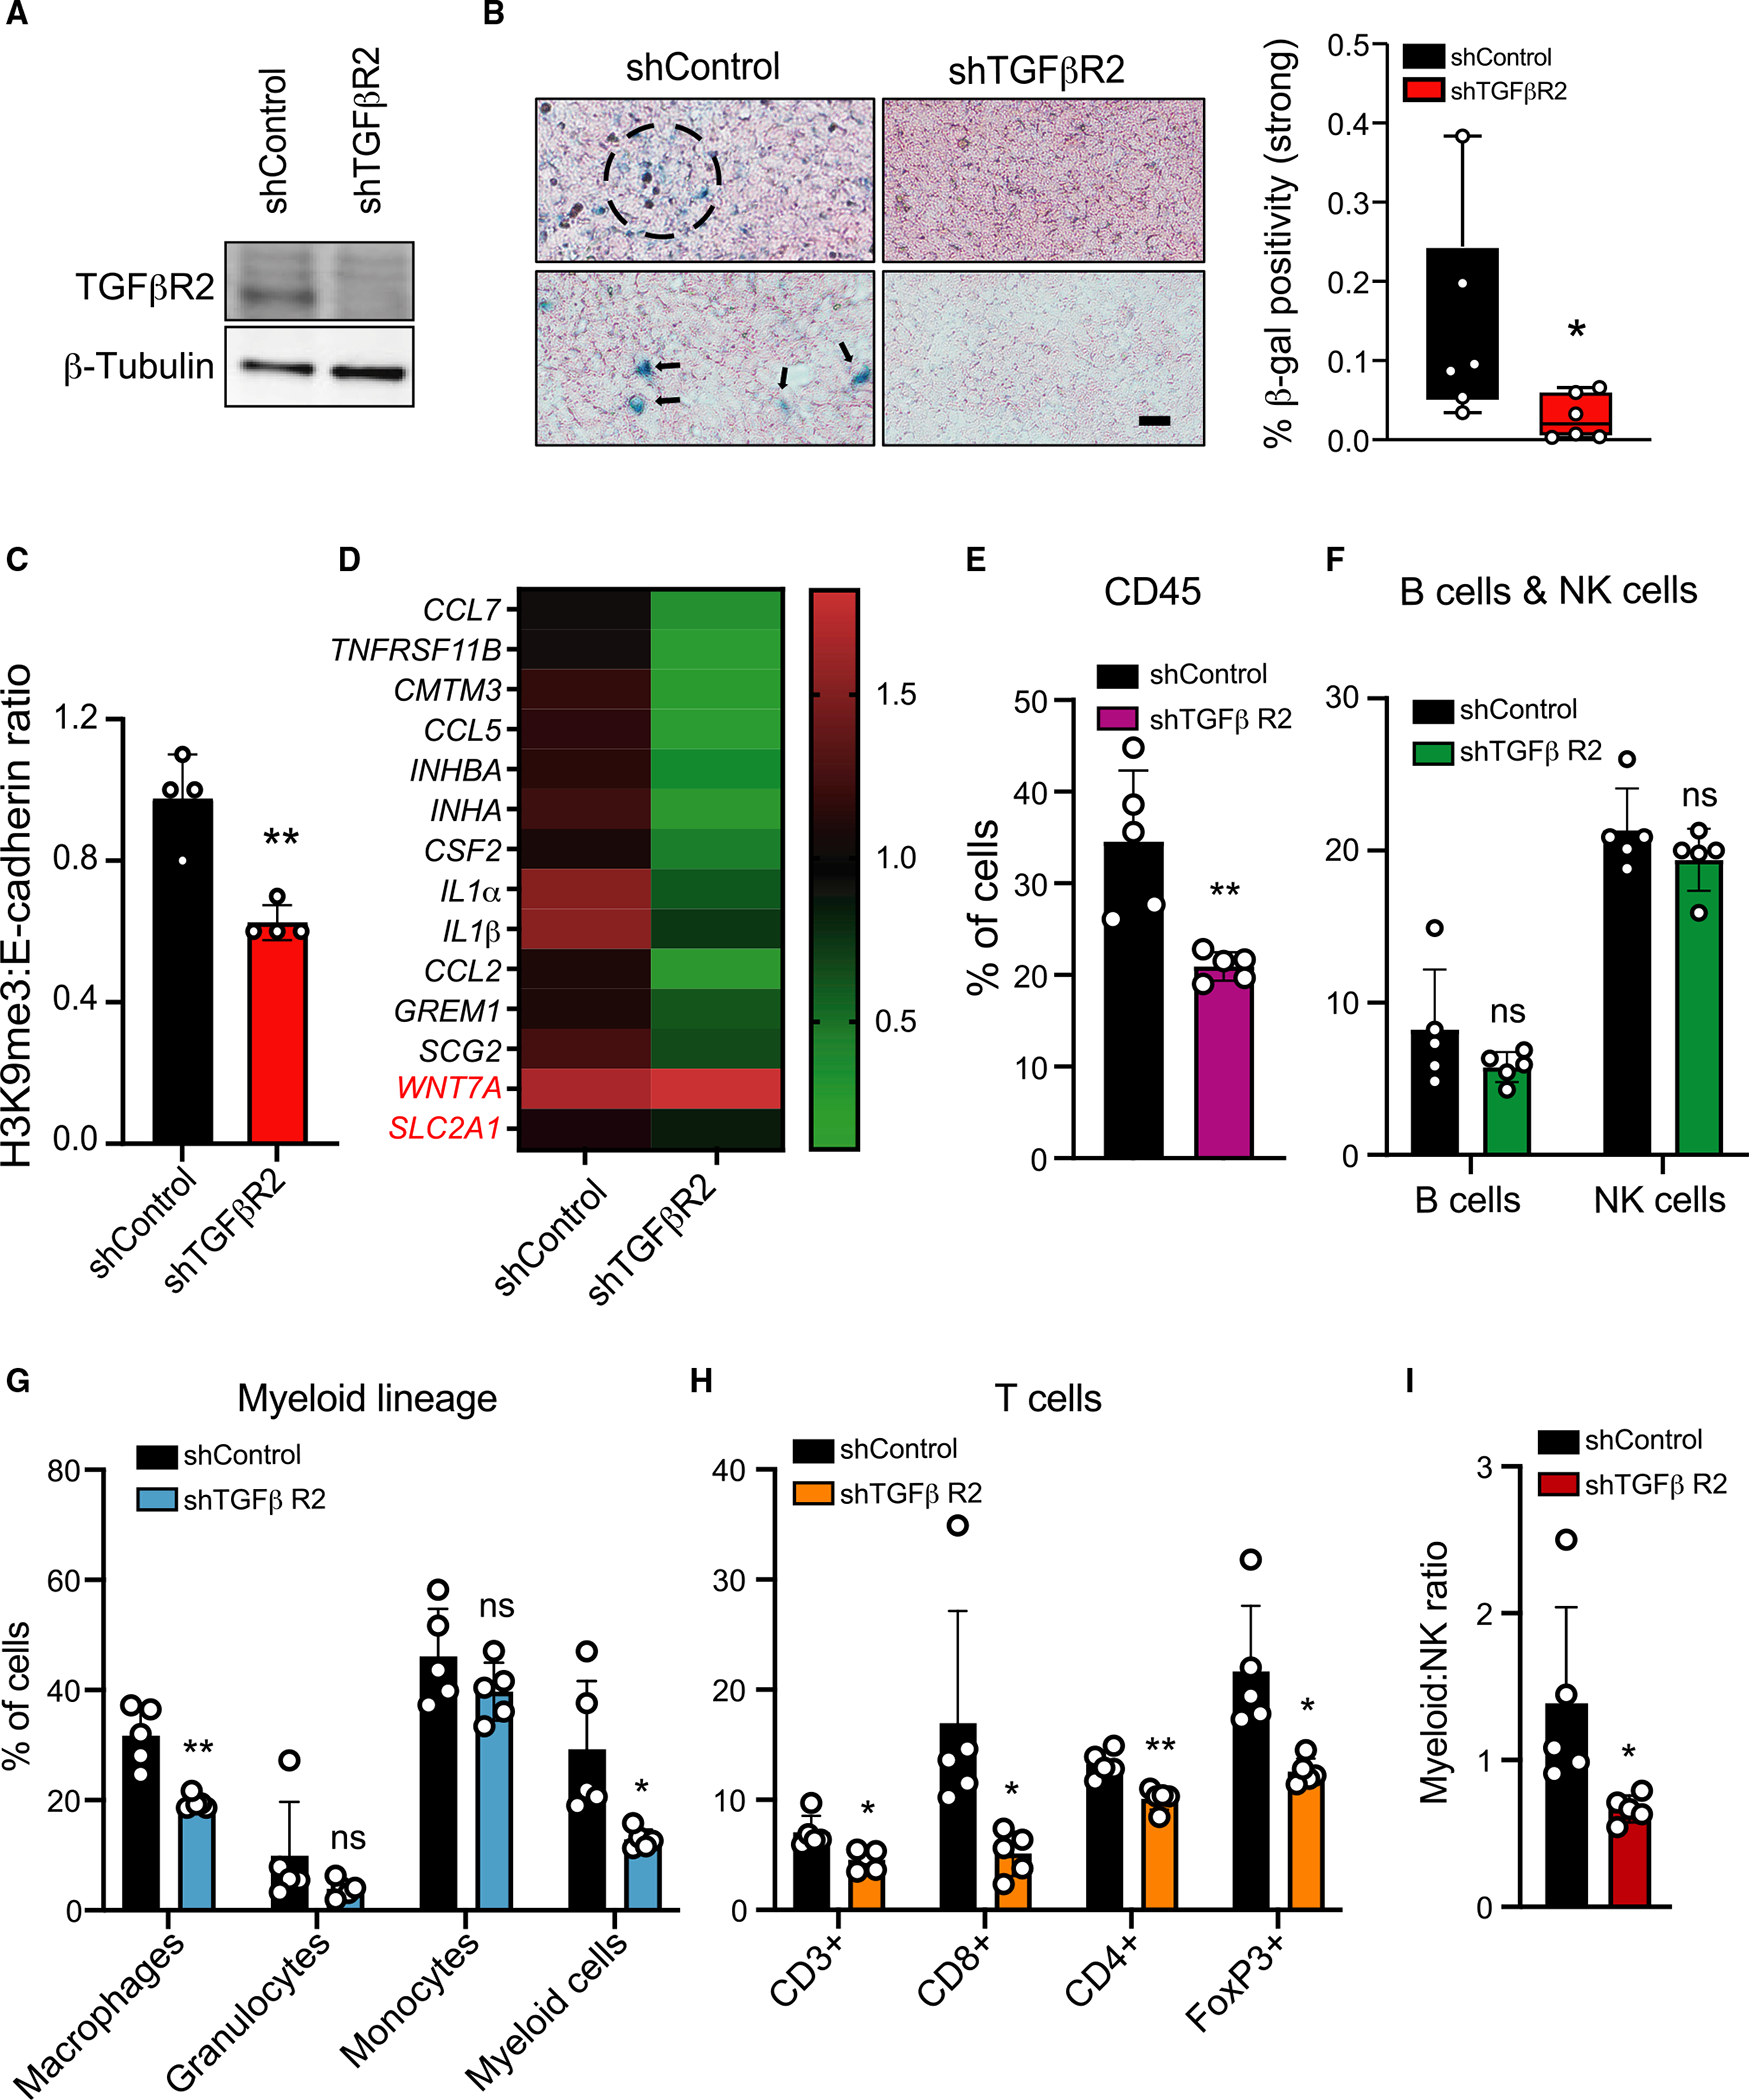
TGF-β induces senescence in embryonic tissues. Whether TGF-β in the hypoxic tumor microenvironment (TME) induces senescence in cancer and how the ensuing senescence-associated secretory phenotype (SASP) remodels the cellular TME to influence immune checkpoint inhibitor (ICI) responses are unknown. We show that TGF-β induces a deeper senescent state under hypoxia than under normoxia; deep senescence correlates with the degree of E2F suppression and is marked by multinucleation, reduced reentry into proliferation, and a distinct 14-gene SASP. Suppressing TGF-β signaling in tumors in an immunocompetent mouse lung cancer model abrogates endogenous senescent cells and suppresses the 14-gene SASP and immune infiltration. Untreated human lung cancers with a high 14-gene SASP display immunosuppressive immune infiltration. In a lung cancer clinical trial of ICIs, elevated 14-gene SASP is associated with increased senescence, TGF-β and hypoxia signaling, and poor progression-free survival. Thus, TME-induced senescence may represent a naturally occurring state in cancer, contributing to an immune-suppressive phenotype associated with immune therapy resistance.

Keywords: CP: Cancer; CP: Immunology; E2Fs; SASP; TGF-β; hypoxia; immune checkpoint inhibitors; lung cancer; senescence; tumor microenvironment.


Conflict of interest statement

Declaration of interests A. Ravi has served as a consultant to Halo Solutions and Tyra Biosciences. J.F.G. has served as a compensated consultant or received honoraria from Bristol-Myers Squibb, Genentech/Roche, Takeda, Loxo/Lilly, Blueprint, Oncorus, Regeneron, Gilead, Moderna, Mirati, AstraZeneca, Pfizer, Novartis, iTeos, Nuvalent, Karyopharm, Beigene, Silverback Therapeutics, Merck, and GlydeBio; received research support from Novartis, Genentech/Roche, and Ariad/Takeda; received institutional research support from Bristol-Myers Squibb, Tesaro, Moderna, Blueprint, Jounce, Array Biopharma, Merck, Adaptimmune, Novartis, and Alexo; and has an immediate family member who is an employee with equity at Ironwood Pharmaceuticals. D.T.T. has received consulting fees from ROME Therapeutics, Tekla Capital, Ikena Oncology, Foundation Medicine, Inc., NanoString Technologies, and Pfizer that are not related to this work. D.T.T. is a founder of and has equity in ROME Therapeutics, PanTher Therapeutics, and TellBio, Inc., which are not related to this work. D.T.T. receives research support from ACD-Biotechne, PureTech Health LLC, and Ribon Therapeutics, which was not used in this work. D.T.T.’s interests were reviewed and are managed by Massachusetts General Hospital and Mass General Brigham in accordance with their conflict-of-interest policies. S. Maheswaran and D.A.H. are co-founders and have equity in Tell-Bio, which is not related to this work.

Figures

Figure 1.
Figure 1.. TGF-β induces different degrees of senescence depending on oxygen concentration
(A) TGF-β induces senescence in normoxic and hypoxic cells. A549 cells were treated with 5 ng/mL TGF-β for 15 days and stained for β-gal activity. Left: photomicrographs of β-gal-stained untreated and TGF-β-treated cells. Scale bar: 20 μm. Right: quantification of percentage of β-gal-positive cells. Mean ± SD was calculated from imaging 10 random fields. *p < 0.05 by two-tailed unpaired Student’s t test; n=3 biological replicates. (B) TGF-β induces p21 in normoxic and hypoxic cells. Western blot showing p21 protein in A549 cells treated with 5 ng/mL TGF-β for 0, 3, and 15 days. p21 band intensity quantification is provided below. p21 expression in untreated normoxic cells was set at 1. GAPDH was used as loading control; n=2 biological replicates. (C) Schematic showing β-gal-high senescent population enrichment. TGF-β-treated hypoxic and normoxic A549 cells (5 ng/mL for 15 days) were sorted after SPiDER-βGal staining. β-gal-low and β-gal-high populations, defined as the bottom and top 20% of the observed distribution, respectively, were collected for downstream analysis. Representative data from three biological replicates are shown. (D) The β-gal-low and β-gal-high populations collected as described in (C) were cultured for 24 h and stained for β-gal. Bar graph shows percentage of β-gal-positive cells in each condition. Untreated A549 cells were used as control. Mean ± SD was calculated from imaging 10 random fields. *p < 0.05 by two-tailed unpaired Student’s t test; n=3 biological replicates. (E) Multinucleated cells are prevalent in TGF-β-treated hypoxic cultures. The β-gal-high cells collected from TGF-β-treated (5 ng/mL, 15 days) hypoxic and normoxic cultures were stained with DAPI (red) and tubulin (green). Untreated cells were used as control. Photomicrographs of cells under each condition are shown. Scale bar: 50 μm. Far right images: higher-magnification images of binucleated (upper, normoxia) and multinucleated (lower, hypoxia) cells in highlighted images. Scale bar: 10 μm. Representative data from two biological replicates are shown. (F) Quantification of binucleated and multinucleated cells in β-gal-low and β-gal-high populations sorted from TGF-β-treated (5 ng/mL, 15 days) hypoxic and normoxic A549 cells. Untreated cells are shown as controls. Mean ± SD was calculated from imaging 10 random fields. *p < 0.05 by two-tailed unpaired Student’s t test; n=3 biological replicates. (G) β-gal-high TGF-β-treated hypoxic cells exhibit reduced ability to resume proliferation. TGF-β-treated (5 ng/mL, 15 days) hypoxic and normoxic A549 cells were sorted for β-gal activity and seeded as single cells into 96-well plates. Colony formation of single cells in medium without TGF-β was monitored after 7 days. Bar graph shows fraction of wells with colonies for each condition; n=2 biological replicates; mean ± SD; *p < 0.05 by two-tailed unpaired Student’s t test. (H) TGF-β-treated β-gal-high hypoxic cells are resistant to drug treatment. The β-gal-low and β-gal-high populations from TGF-β-treated hypoxic and normoxic A549 cells were cultured for a day without TGF-β and treated with increasing concentrations of docetaxel for 72 h. Graph shows relative viability of cells for each condition (y axis) under different drug concentrations (x axis). Untreated cells (TGF-β [−]) are shown as controls; n=2 biological replicates. *p < 0.05 by two-tailed unpaired Student’s t test. See also Figures S1 and S2.
Figure 2.
Figure 2.. Gradual decline in the dosage of E2F-mediated gene expression as cells progress into deep senescence
(A) RNA-sequencing data from β-gal-high cells from TGF-β-treated (5 ng/mL, 15 days) hypoxic and normoxic A549 cultures were evaluated for differential expression of 4 paracrine senescence signatures,, 45 cell-cycle (n=31), DNA-replication (n=4), and DNA-damage response (n=10) signatures (see Figure S3A). Heatmaps of gene set scores show significant differences in these pathways in deep-senescent cells (D-sen; β-gal-high-TGF-β-treated hypoxic cells) compared with early-senescent cells (E-sen; β-gal-high-TGF-β-treated normoxic cells). The scales for log2 fold change and log false discovery rate (FDR) are provided. (B) E2F target gene expression is reduced in D-senescent cells. Heatmap shows gradual decline in E2F-target genes in E-sen and D-sen A549 cells compared with untreated normoxic and hypoxic cells; n=3 biological replicates. (C) The bar graph (mean ± SD) provides the log2 fold change in E2F target genes quantified from samples shown in (B); n=3 biological replicates; ****p < 2.5e−16 was calculated using ANOVA. (D) Activator E2Fs, E2F1, E2F2, and E2F3 are suppressed in D-senescent cells. Activator E2F expression in untreated normoxic, hypoxic, E-sen, and D-sen A549 cells is shown; n=3 biological replicates; p values were calculated using ANOVA. (E) The dosage of activator E2Fs gradually decreases during Ras oncogene-induced senescence (Ras-OIS). Analysis of a time-series RNA-sequencing dataset {0, 24, 48, 72, 96, and 144 h] from human lung fibroblasts (WI-38) undergoing OIS with RasV12 (GEO: GSE112084) is shown; n=2 biological replicates; **p = 0.0023 was calculated using Kruskal-Wallis test. (F) The bar graph (mean ± SD) shows gradual decline in E2F target genes during Ras-OIS in the samples described in (E). The y axis shows log2 fold change in expression; n=2 biological replicates; ****p < 2.2e−16 was calculated using ANOVA. See also Figure S3 and Table S1.
Figure 3.
Figure 3.. Suppression of E2F phenocopies in deep senescence
(A) qPCR of relative E2F1 mRNAs in cells infected with two different E2F1 shRNAs. shGFP was used as control; n=3 biological replicates. Data are represented as mean ± SD; *p < 0.05 by Student’s t test. (B) E2F1 suppression induces senescence. E2F1-KD A549 cells were stained for β-gal activity. Left: photomicrographs of β-gal-stained control and E2F1-KD cells. Scale bar: 50 μm. Right: percentage of β-gal-positive cells for each condition; n=3 biological replicates. Data are shown as mean ± SD; **p < 0.01 and ***p < 0.001 by two-tailed unpaired Student’s t test. (C) E2F1 knockdown increases multinucleated cells irrespective of oxygen concentration. Control and E2F1-KD A549 cells were stained with DAPI (red) and tubulin (green). Left: photomicrographs of cells cultured under hypoxia and normoxia. Higher magnification of highlighted multinucleated cells is shown on the right. Scale bars: 50 μm (low magnification) and 20 μm (high magnification). Representative data from two biological replicates are shown. (D and E) Bar graphs show percentage of binucleated (D) and multinucleated (E) E2F-KD A549 cells grown under hypoxia and normoxia. shGFP is shown as control; n=3 biological replicates. Mean ± SD was calculated from imaging 10 random fields. *p < 0.05 by two-tailed unpaired Student’s t test; n.s, not significant. See also Table S3.
Figure 4.
Figure 4.. Lung cancers with high 14-gene SASP exhibit an immune-suppressive microenvironment
(A) A 14-cytokine SASP is elevated in deep-senescent cells. Bar graph shows log2 fold change in cytokines/growth factors constituting the 14-gene SASP elevated in D-senescent cells compared with E-senescent cells; n=3 biological replicates for each condition (see Figures S4A–S4C). Significantly different cytokines were selected based on Benjamini-Hochberg corrected p<10% and >2-fold differences in gene expression. (B) Stratification of 31 treatment-naive metastatic lung cancers based on the fraction of tumor cells with high and low 14-gene metagene signature in each patient. Fractions of 14-gene low (blue) and 14-gene high (red) cancer cells in each patient are shown. We defined the top 13 tumors harboring >80% of tumor cells expressing a high 14-gene signature as “14 genes high” and the bottom 13 tumors with <60% of tumor cells expressing the 14-gene signature as “14 genes low” (marked within the green boxes). (C) TGF-β signaling is significantly elevated in the tumor cell compartment of the 14-gene-high NSCLCs compared with 14-gene-low samples (*Wilcoxon p=0.026). (D) Paracrine senescence signatures (paracrine/OIS and secondary senescence from time course/top overlap only [*Wilcoxon p=0.012]; secondary senescence from co-culture/OIS from co-culture and secondary senescence from time course/OIS from time course overlap only [*Wilcoxon p=0.016]) are elevated in 14-gene-high treatment-naive NSCLCs compared with 14-gene-low NSCLCs. (E) Increased immune cell infiltration in lung cancers with higher fraction of tumor cells with high-14-gene expression. Quantification of each class of tumor-infiltrating immune cells (normalized to the number of cancer cells in each sample) across 14-gene-high and 14-gene-low lung cancers is shown. Asterisks mark the immune cell subtype significantly elevated in 14-gene-high lung cancers. *p < 0.05 was calculated using two-sample two-sided Wilcoxon test. (F) Boxplots showing the fraction of indicated immune cell type residing within each lung cancer sample in 14-gene-high and -low groups. p < 0.05 was calculated using two-sample two-sided Wilcoxon test. (G) Plot showing that the net increase in immune cells in the 14-gene-high NSCLCs is biased toward increased infiltration of immune-suppressive cell types (Mo-Macs and Tregs) compared with cytotoxic cells (cytotoxic CD8+ T cells + NK cells + NK-T cells). The linear model used to analyze these data are described in the STAR Methods. The interaction estimate shows a positive value of 1, indicating that the mean for 14-gene-high patients minus the mean for 14-gene-low patients is significantly greater for immune-suppressive cells than for cytolytic cells with an interactive p value of 0.0016. See also Figures S4 and S5.
Figure 5.
Figure 5.. Lung cancers with high 14-gene SASP exhibit poor clinical outcome after ICI therapy
(A) Lung cancers from the TCGA dataset were stratified based on expression of the 14-gene SASP. High 14-gene SASP expression correlates with adverse clinical outcome by the Cox proportional hazards model applied to overall survival (p=0.030). (B and C) High (i.e., greater than median) 14-gene SASP correlates with (B) high TGF-β signaling (Wilcoxon p=4.5e40) and high hypoxia signaling (Wilcoxon p=5.2e46) and (C) high paracrine senescence signatures (Acosta et al., Wilcoxon p=1.1e50; Teo et al., Wilcoxon p=1.6e31). (D) RNA-sequencing data from tumor samples collected from metastatic NSLC patients prior to initiation of ICI therapy. Cox proportional hazards model shows that high 14-gene SASP expression in pre-treatment samples correlates with poor PFS at the 1-year landmark (log rank p=0.014). (E and F) High (i.e., greater than median) 14-gene SASP correlates with (E) high TGF-β signaling (Wilcoxon p=1.6e05) and high hypoxia signaling (Wilcoxon p=8.2e05) and (F) high paracrine senescence signatures (Acosta et al., Wilcoxon p=4e06; Teo et al., Wilcoxon p=1e04). See also Figure S6.
Figure 6.
Figure 6.. TGF-βR2-KD in tumor cells suppresses senescence and immune cell infiltration in an immune-competent mouse lung cancer model
(A) Western blot showing knockdown of TGF-βR2 in LLC1. β-tubulin is shown as control. (B) TGF-βR2-KD suppresses senescence in LLC tumors. shControl and TGF-βR2-KD LLC1 cells were inoculated into both flanks of C57BL/6 mice (n=5 mice per group). Tumors resected after 14 days were stained for β-gal. Photomicrographs show β-gal-positive senescent cells present as single cells (arrows) or clusters (dashed circle) in two representative shControl tumors. Scale bar: 100 μm. Right: quantification of β-gal positivity in shControl and TGF-βR2-KD tumors; percentage of strong β-gal stain to total tissue area was computed and a Wilcoxon test was applied across the two conditions (*p = 0.026); n=5 tumors for each condition. (C) The senescence marker H3K9Me3 is reduced in TGF-βR2-KD tumors. Quantification of western blot of proteins from shControl and TGF-βR2-KD tumors with antibodies against H3K9Me3 and E-cadherin. Bar graph shows the ratio of H3K9Me3:E-cadherin (H3K9Me3 expression in the epithelial tumor compartment) in tumors; n=5 tumors/condition. Bar graph shows mean ± SD. **p = 0.0021 by two-tailed unpaired Student’s t test. (D) SASP activity is reduced in TGF-βR2-KD tumors. RNA from shControl and TGF-βR2-KD tumors was analyzed for 14-gene SASP expression. Heatmap shows fold change in expression; shControl was set at 1; n=5 tumors/condition. IL-32 is not expressed in mouse cells. (E–H) TGF-βR2-KD in tumor cells suppresses immune cell infiltration. Immune cells in shControl and TGF-βR2-KD tumors were quantified by FACS after staining for immune cell subtypes shown. The percentage of each immune cell type in shControl and TGF-βR2-KD tumors is shown. Significant decreases were observed in CD45+ cells (p=0.005), CD3+ T cells (p=0.014), CD8+ T cells (p=0.033), CD4+ Tregs (p=0.002), FoxP3+ Tregs (p=0.01), macrophages (p=0.001), and myeloid cells (p=0.02) in shTGF-βR2-KD tumors. Granulocytes, monocytes, B cells, and NK cells were not significantly altered (ns); n=5 tumors/condition. Bar graphs shows mean ± SD. The p values *p < 0.05 and **p < 0.01 were calculated by multiple unpaired Student’s t test. (I) TGF-βR2-KD in tumors significantly reduced the ratio of myeloid:NK cells compared with shControl tumors; n=5 tumors/condition; *p = 0.04 calculated by two-tailed unpaired Student’s t test. Also see Figure S7.

References

    1. Gorgoulis V, Adams PD, Alimonti A, Bennett DC, Bischof O, Bishop C, Campisi J, Collado M, Evangelou K, Ferbeyre G, et al. (2019). Cellular senescence: defining a path forward. Cell 179, 813–827. 10.1016/j.cell.2019.10.005. - DOI - PubMed
    1. Kuilman T, Michaloglou C, Mooi WJ, and Peeper DS (2010). The essence of senescence. Genes Dev. 24, 2463–2479. 10.1101/gad.1971610. - DOI - PMC - PubMed
    1. Hernandez-Segura A, Nehme J, and Demaria M (2018). Hallmarks of cellular senescence. Trends Cell Biol. 28, 436–453. 10.1016/j.tcb.2018.02.001. - DOI - PubMed
    1. Lee S, and Schmitt CA (2019). The dynamic nature of senescence in cancer. Nat. Cell Biol. 21, 94–101. 10.1038/s41556-018-0249-2. - DOI - PubMed
    1. van Deursen JM (2014). The role of senescent cells in ageing. Nature 509, 439–446. 10.1038/nature13193. - DOI - PMC - PubMed

Publication types

Substances