. 2023 Feb 28;120(9):e2210836120.
doi: 10.1073/pnas.2210836120. Epub 2023 Feb 23.

Defining and targeting tumor-associated macrophages in malignant mesothelioma

Affiliations

Defining and targeting tumor-associated macrophages in malignant mesothelioma

Licun Wu et al. Proc Natl Acad Sci U S A. .

Abstract

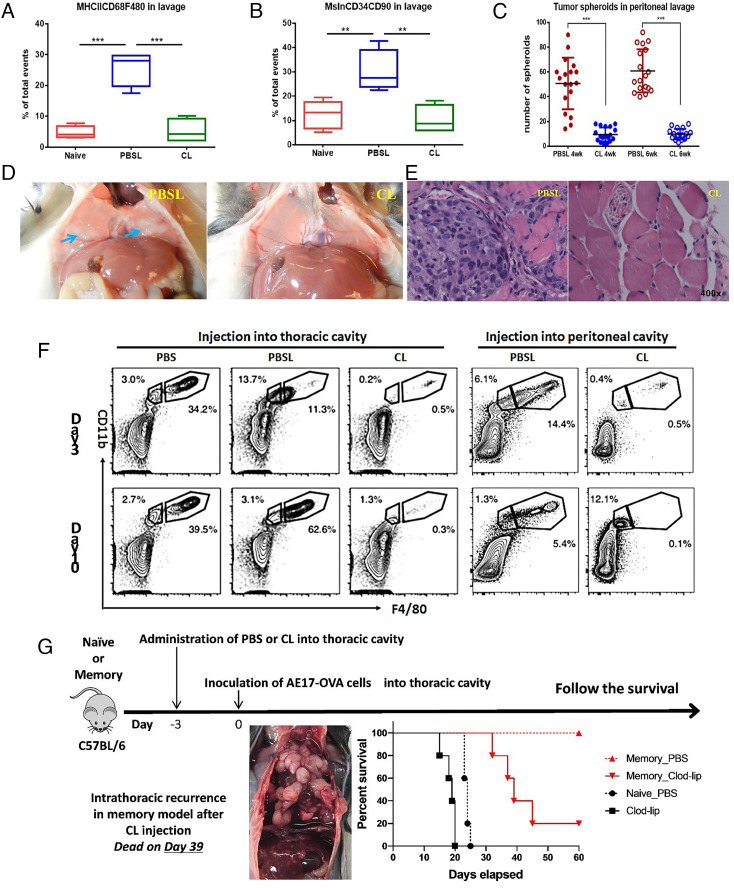
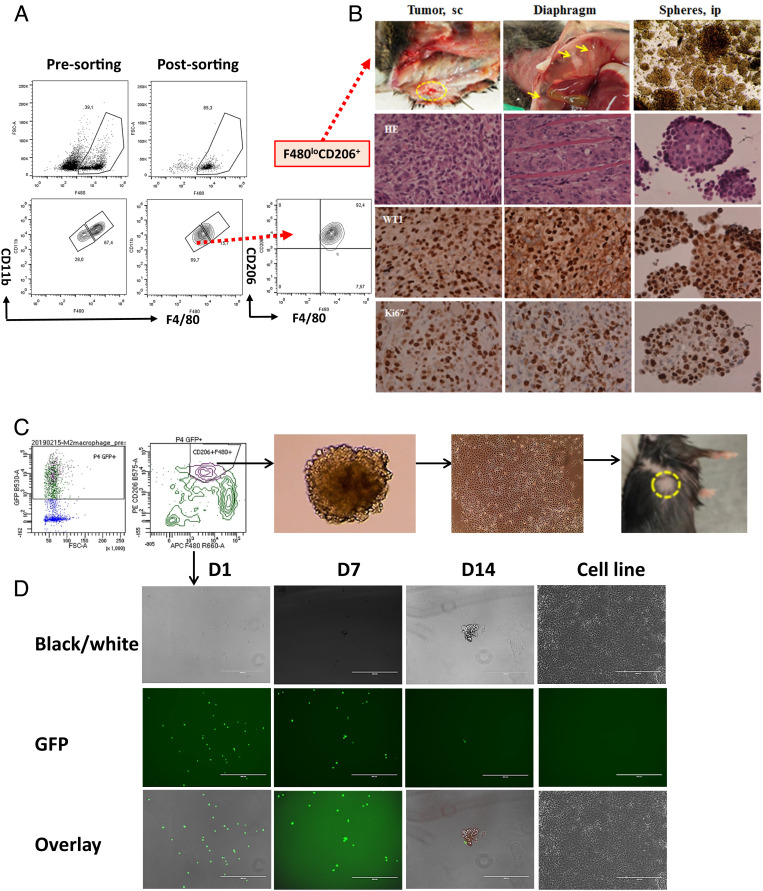
Defining the ontogeny of tumor-associated macrophages (TAM) is important to develop therapeutic targets for mesothelioma. We identified two distinct macrophage populations in mouse peritoneal and pleural cavities, the monocyte-derived, small peritoneal/pleural macrophages (SPM), and the tissue-resident large peritoneal/pleural macrophages (LPM). SPM rapidly increased in tumor microenvironment after tumor challenge and contributed to the vast majority of M2-like TAM. The selective depletion of M2-like TAM by conditional deletion of the Dicer1 gene in myeloid cells (D-/-) promoted tumor rejection. Sorted SPM M2-like TAM initiated tumorigenesis in vivo and in vitro, confirming their capacity to support tumor development. The transcriptomic and single-cell RNA sequencing analysis demonstrated that both SPM and LPM contributed to the tumor microenvironment by promoting the IL-2-STAT5 signaling pathway, inflammation, and epithelial-mesenchymal transition. However, while SPM preferentially activated the KRAS and TNF-α/NFkB signaling pathways, LPM activated the IFN-γ response. The importance of LPM in the immune response was confirmed by depleting LPM with intrapleural clodronate liposomes, which abrogated the antitumoral memory immunity. SPM gene signature could be identified in pleural effusion and tumor from patients with untreated mesothelioma. Five genes, TREM2, STAB1, LAIR1, GPNMB, and MARCO, could potentially be specific therapeutic targets. Accordingly, Trem2 gene deletion led to reduced SPM M2-like TAM with compensatory increase in LPM and slower tumor growth. Overall, these experiments demonstrate that SPM M2-like TAM play a key role in mesothelioma development, while LPM more specifically contribute to the immune response. Therefore, selective targeting of monocyte-derived TAM may enhance antitumor immunity through compensatory expansion of tissue-resident TAM.

Keywords: cancer; gene signature; mesothelioma; tumor microenvironment; tumor-associated macrophages.


Conflict of interest statement

The authors have organizational affiliations to disclose. M. De Perrot received personal fees outside of this work from Bayer (speaking fees for work related to pulmonary hypertension), Merck (speaking fees for work related to lung cancer), Janssen (consulting fees for work related to pulmonary hypertension), Roche (consulting fees for work related to lung cancer), BMS (consulting fees for work related to lung cancer), and Astra-Zeneca (Ad board for work related to lung cancer).

Figures

Fig. 1.
Fig. 1.
Experimental design of intraperitoneal and intrapleural mesothelioma models in mice. (A) Schema of the experimental design in intraperitoneal mouse model: RN5 cells (2 × 106) were injected intraperitoneally (ip) into C57BL/6 mice, lavage rinsed with phosphate buffered saline (PBS) was collected at different time points, single cells were used for further analysis. (B) Two distinct subpopulations of TAM were identified by F4/80hiCD11bhi (LPM) and F4/80loCD11blo (SPM). (C) Total macrophages, including SPM and LPM populations, accumulated in the peritoneal cavity after tumor challenge and were quantitatively analyzed up to day 28. (D) Fluorescent immunostaining of SPM (CD11bloF4/80lo) and LPM (CD11bhiF4/80hi) from tumor-bearing mice at 4 wk after tumor cell injection. (E) Intrapleural mouse model: AB12 cells (5 × 105) were injected intrapleurally into Balb/c mice. Representative dot plots of flow cytometry in the intrapleural model. (F) The proportions of CD206 in SPM and LPM were presented during observation after tumor challenge. *P < 0.05, **P < 0.01, ***P < 0.001, ****< 0.0001.
Fig. 2.
Fig. 2.
Systemic depletion of TAM resulted in a significant decrease in mesothelial precursor cells in peritoneal lavage, mesospheres, and tumorigenicity. (A and B) Macrophages were depleted by CL on the same day as tumor challenge. Macrophage depletion was associated with a significant reduction in total macrophages (MHCII+CD68+F4/80+) and mesothelial precursor cells characterized by Msln+CD34+CD90+ in the peritoneal lavage. (C) The number of spheroids in the peritoneal lavage at 4 wk and 6 wk after treatment with CL compared with PBS liposome (PBSL) was counted based on the diameter greater than 100 µm. (D and E) Tumor invasion into the diaphragm was evident at 4 wk after ip injection of RN5 cells in control mice, while it was absent in CL-treated group. (F) The impact of macrophage depletion with CL injection in the pleural cavity was tested in the intrapleural model. PBS, PBSL, or CL was injected into the thoracic cavity and peritoneal cavity of naïve mice, respectively, and mice were killed on day 3 and day 10. The depletion of SPM and LPM was quantified in both models. (G) Using the memory model, mice were then challenged by intrapleural injection of mesothelioma cells. Survival time and tumor progression were recorded in memory mice with or without CL treatment in response to the tumor rechallenge. *< 0.05, **< 0.01, ***< 0.001, ****< 0.0001.
Fig. 3.
Fig. 3.
Selective depletion of TAM resulted in a significant decrease in mesospheres in peritoneal lavage and unfavorable tumorigenicity. (A) Selective depletion of M2-like SPM macrophages was achieved in D−/− mice. Macrophage M2-like depletion by using Dicer1-deficient (D−/−) mice to inject tumor cells in the ip model, the number of intraperitoneal mesospheres in the D+/+ and D−/− mice was counted at 4 wk and 6 wk after RN5 cells ip injection. (C) In the sc model, tumor growth was initiated and palpable for the first few days after tumor challenge in both groups, but then the tumor was completely rejected in D−/− mice, while it continued to grow in D+/+ mice. (B) The M2-polarized macrophages in the peritoneal lavage of D−/− mice compared with D+/+ mice were identified with F4/80loCD206+ fluorescent immunostaining. (D) Using ip model, both SPM and LPM populations significantly dropped in tumor-bearing D−/− mice. (E) The immune checkpoint PD-L1 was remarkably reduced in TAM of tumor-bearing D−/− mice compared with D+/+ mice. The majority CD206+ M2-like macrophages were SPM in D+/+ mice. CD206+ SPM were nearly absent in D−/− mice. PD-L1 was downregulated in all TAM in D−/− mice at 4 wk after tumor cell injection. (D) D−/− resulted in drop of SPM and LPM, but to a much larger extent in SPM (E). (F) Total number of genes with significant differential expression. Nearly all differentially expressed genes were converted to normal in D−/− mice compared with tumor-naïve mice. (G) Top 10 WikiPathways of interest in comparing: Naïve vs. WT (Top), WT D+/+ vs. D−/− (Bottom). *< 0.05, **< 0.01, ***< 0.001, ****< 0.0001.
Fig. 4.
Fig. 4.
Sorted M2-like SPM macrophages from peritoneal lavage of RN5-bearing WT or GFP mice initiate tumorigenesis. (A) Peritoneal lavage cells were collected from the RN5-bearing WT mice at 4 wk after ip injection. F4/80loCD11bloCD206+ cells were sorted using a cell sorter. (B) Sorted SPM M2-like cells were injected subcutaneously and intraperitoneally into WT mice. Tumors and mesospheres were stained for H&E, WT1, and Ki67. (C) Similar experiment was then performed in GFP mice to confirm the purity of GFP+F4/80loCD206+ after cell sorting by tracking GFP expression. Cell sorting strategy to acquire GFP+F4/80loCD206+ M2-like SPM macrophages. M2-like SPM macrophages were able to form spheroids at day 14 and cell lines were derived from the spheroids. (D) Sorted cells were cultured in an ultra-low adherent plate. Spheroids were formed at day 14. Cell line was then established from the spheroids. Sorted cells were GFP+ at the beginning of culture and disappeared afterward.
Fig. 5.
Fig. 5.
Transcriptomic analysis of gene expression profiles of SPM and LPM by microarray. (A) Total RNAs extracted from CD11bloF4/80lo (SPM) and CD11bhiF4/80hi (LPM) subpopulations of sorted cells were used to perform Affymetrix microarray. Naïve group was included for controls. SPM were compared to LPM in tumor-bearing mice and tumor-naive mice, and up- or downregulated genes were shown in scatter plots as average values (log2). (B) Summary of differentially expressed genes, red color represents upregulated genes and green color downregulated genes. (C) GSEA was performed to show the SPM-specific genes involved in top 10 hallmark gene sets of up- or downregulated genes (>twofold change; P < 0.05). (D) LPM-specific genes involved in top 10 hallmark gene sets, and (E) common genes shared by both subpopulations involved in top 10 hallmark gene sets.
Fig. 6.
Fig. 6.
Gene signatures of SPM and LPM identified by scRNA-Seq. (A) The gene Adgre1 (encoded protein F4/80) expression in single cells from treatment-naïve and RN5-bearing mice. Adgre1lo and Adgre1hi cells in all clusters were highlighted with different colors. (B) SPM and LPM populations increased significantly in RN5 compared with treatment-naïve mice. (C) Heatmap of differentially expressed genes in SPM, LPM of treatment-naïve and RN5 groups plotted by Loupe Cell Browser. (D) Venn diagrams show the number of genes specific for each population or shared between the two subpopulations. (E) Lists of specific genes for each population. Naïve SPM-specific genes, RN5 SPM-specific genes, Naïve LPM-specific genes, and RN5 LPM-specific genes were presented in both heatmaps and bar graphs (genes of interest shown in red). *< 0.05, **< 0.01, ***< 0.001, ****P < 0.0001.
Fig. 7a.
Fig. 7a.
SPM gene signature is consistently identified in patients with mesothelioma, while LPM gene signature displays high variability. (A) Pleural effusion from a patient with malignant pleural mesothelioma. The t-SNE plots of macrophage cluster distribution (clusters 5, 7, and 11) identified by genes CD68 ITGAM CD163 and MRC1 showed dramatic overexpression of 14 SPM genes in both pleural effusion and tumor tissue of patients with pleural mesothelioma (A and B and SI Appendix, Fig. S15). Gene expression violin plots of SPM genes were consistently higher in macrophages than in other clusters in both pleural effusion and tumors (C and D and SI Appendix, Fig. S15).
Fig. 7b.
Fig. 7b.
SPM gene signature is consistently identified in patients with mesothelioma, while LPM gene signature displays high variability. (E) Uniform manifold approximation and projection (UMAP) of single cells derived from tumor biopsy of untreated mesothelioma. Regulatory macrophages (Mreg) were identified by selecting the cluster with CD68+/ITGAM+/CD163hi/TREM2hi TAM. M1 were identified by CD68+/ITGAM+/CD163lo/TREM2lo. (F) Violin plots demonstrated that GPNMB was expressed on Mreg and not on M1-like macrophages. (G) Mreg (mainly SPM) and M1-like macrophages (mainly LPM) pathway enrichment determined by GSEA.
Fig. 8.
Fig. 8.
Trem2 KO results in M2 SPM depletion and unfavorable tumorigenesis (A) Experimental schema: RN5 cells (2 × 10⁶/200 µL PBS) were injected ip into WT and Trem2KO C57BL/6 mice. (B) Tumor modules invasion was detected when mice were killed at 4 wk after tumor challenge. Invasive tumor nodules were observed on the diaphragm in both groups, but smaller tumors were found in the Trem2KO mice. (C) The number of mesospheres was significantly lower in Trem2KO mice compared with WT mice, and (D) F4/80loCD206+ M2 SPM almost disappeared, whereas the F4/80hiCD206 LPM were more easily visible in the Trem2KO mice compared with WT mice. (E) Representative dot plots of flow cytometry data, showing that CD11bloF4/80lo SPM decreased while CD11bhiF4/80hi LPM increased. (F) Quantification of total SPM and LPM in Trem2KO vs. WT mice. (G) The CD206 expression decreased in both SPM and LPM subpopulations of the Trem2KO vs. WT mice. *< 0.05, **< 0.01, ***< 0.001, ****< 0.0001.

References

    1. Carbone M., et al. , Mesothelioma: Scientific clues for prevention, diagnosis, and therapy. CA Cancer J. Clin. 69, 402–429 (2019). - PMC - PubMed
    1. Carbone M., et al. , Medical and surgical care of patients with mesothelioma and their relatives carrying germline BAP1 mutations. J. Thorac. Oncol. 17, 873–889 (2022). - PMC - PubMed
    1. Blum Y., et al. , Dissecting heterogeneity in malignant pleural mesothelioma through histo-molecular gradients for clinical applications. Nat. Commun. 10, 1333 (2019). - PMC - PubMed
    1. Qian B. Z., Pollard J. W., Macrophage diversity enhances tumor progression and metastasis. Cell 141, 39–51 (2010). - PMC - PubMed
    1. Courtiol P., et al. , Deep learning-based classification of mesothelioma improves prediction of patient outcome. Nat. Med. 25, 1519–1525 (2019). - PubMed

Publication types

MeSH terms