. 2023 Jul;79(1):25-42.
doi: 10.1016/j.jhep.2023.02.010. Epub 2023 Feb 21.

Ketohexokinase-C regulates global protein acetylation to decrease carnitine palmitoyltransferase 1a-mediated fatty acid oxidation

Affiliations

Ketohexokinase-C regulates global protein acetylation to decrease carnitine palmitoyltransferase 1a-mediated fatty acid oxidation

Robert N Helsley et al. J Hepatol. 2023 Jul.

Abstract

Background & aims: The consumption of sugar and a high-fat diet (HFD) promotes the development of obesity and metabolic dysfunction. Despite their well-known synergy, the mechanisms by which sugar worsens the outcomes associated with a HFD are largely elusive.

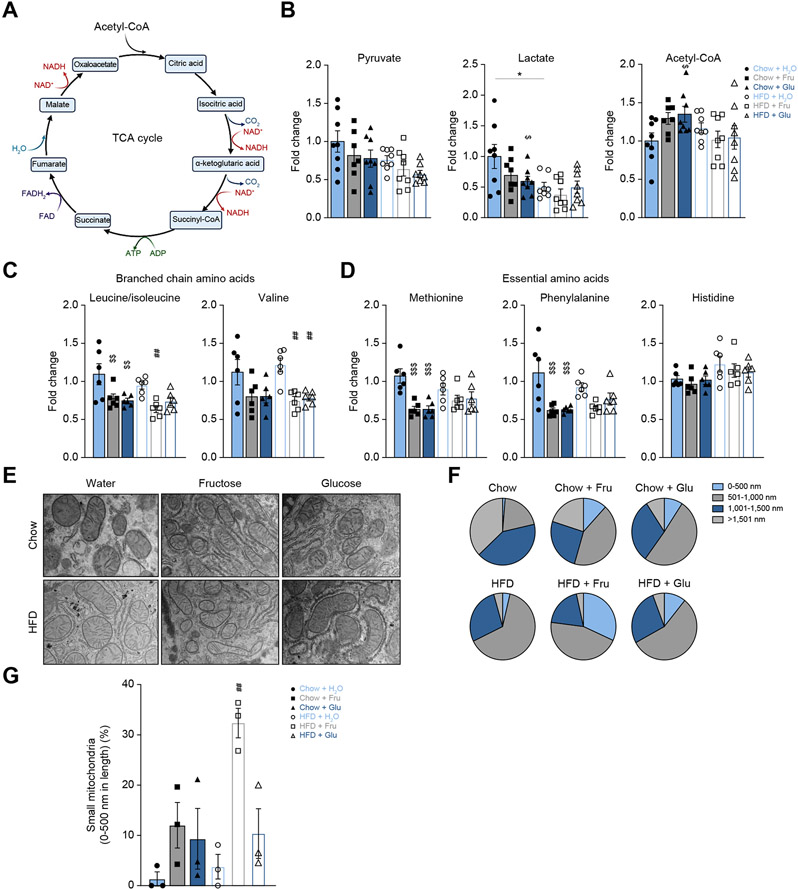
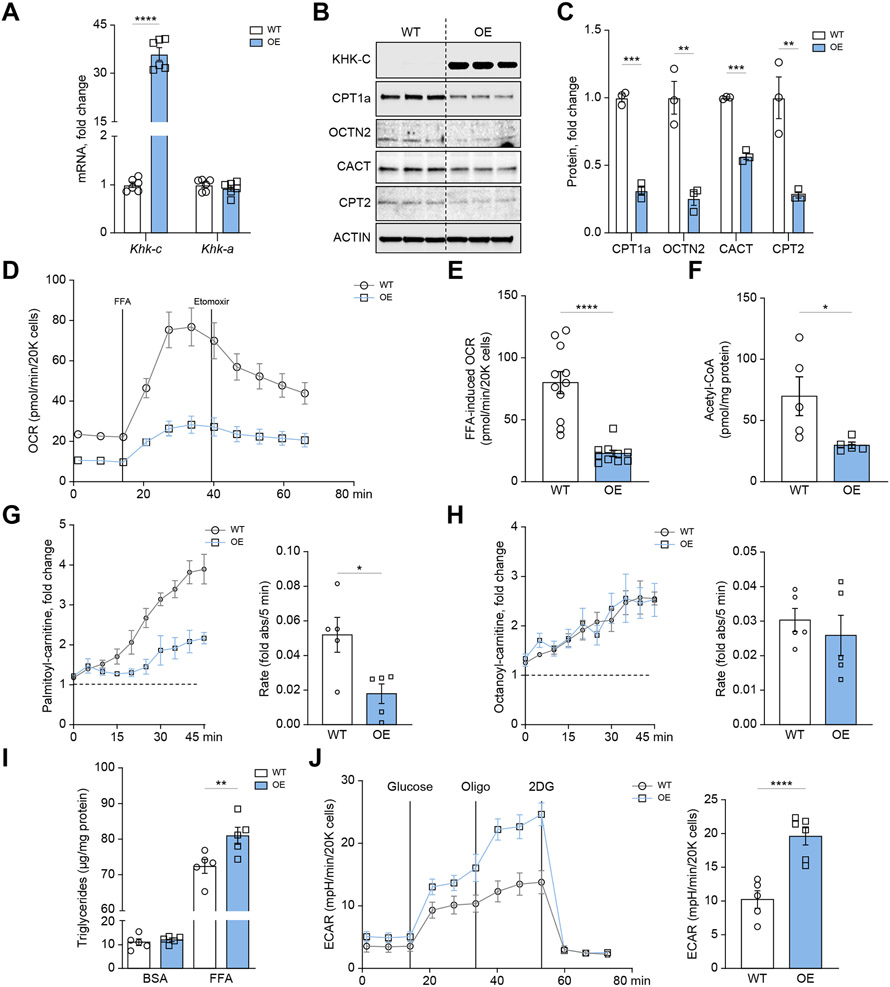
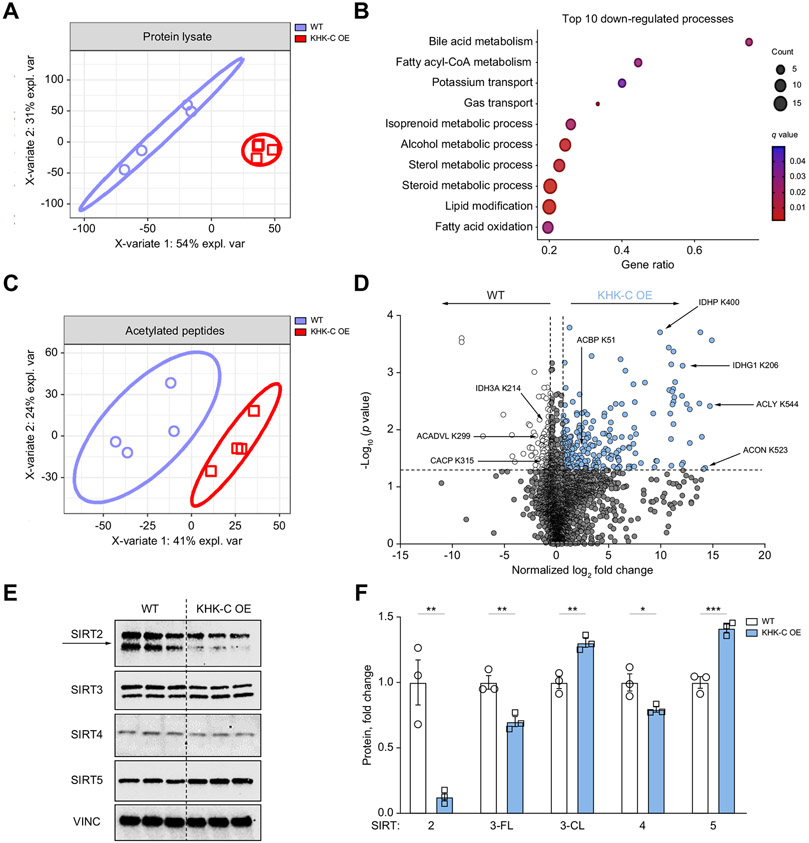
Methods: Six-week-old, male, C57Bl/6 J mice were fed either chow or a HFD and were provided with regular, fructose- or glucose-sweetened water. Moreover, cultured AML12 hepatocytes were engineered to overexpress ketohexokinase-C (KHK-C) using a lentivirus vector, while CRISPR-Cas9 was used to knockdown CPT1α. The cell culture experiments were complemented with in vivo studies using mice with hepatic overexpression of KHK-C and in mice with liver-specific CPT1α knockout. We used comprehensive metabolomics, electron microscopy, mitochondrial substrate phenotyping, proteomics and acetylome analysis to investigate underlying mechanisms.

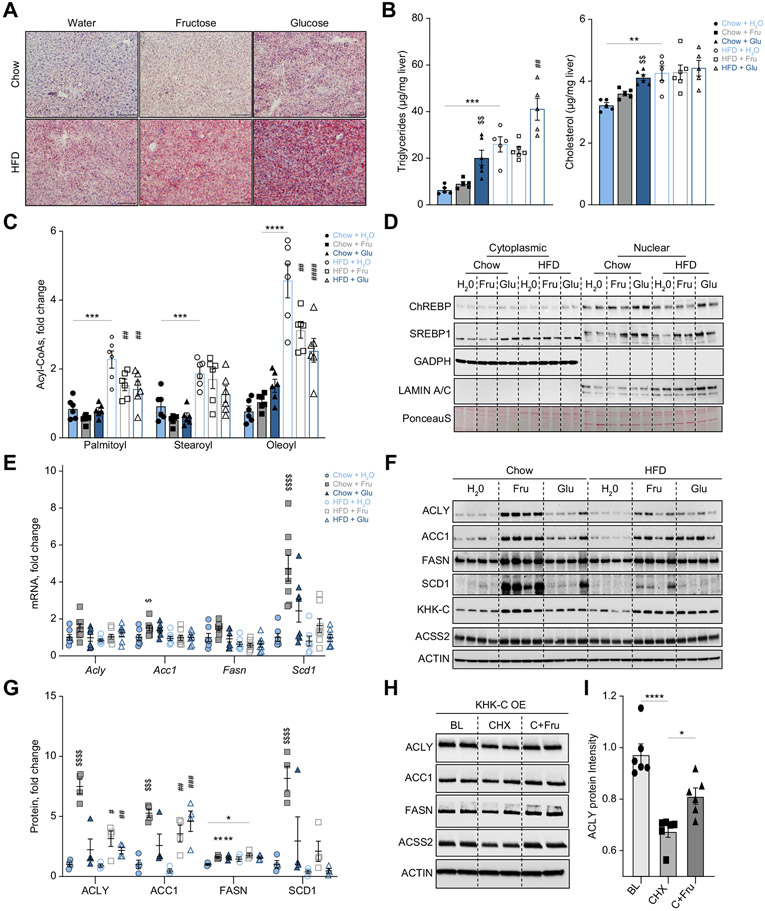
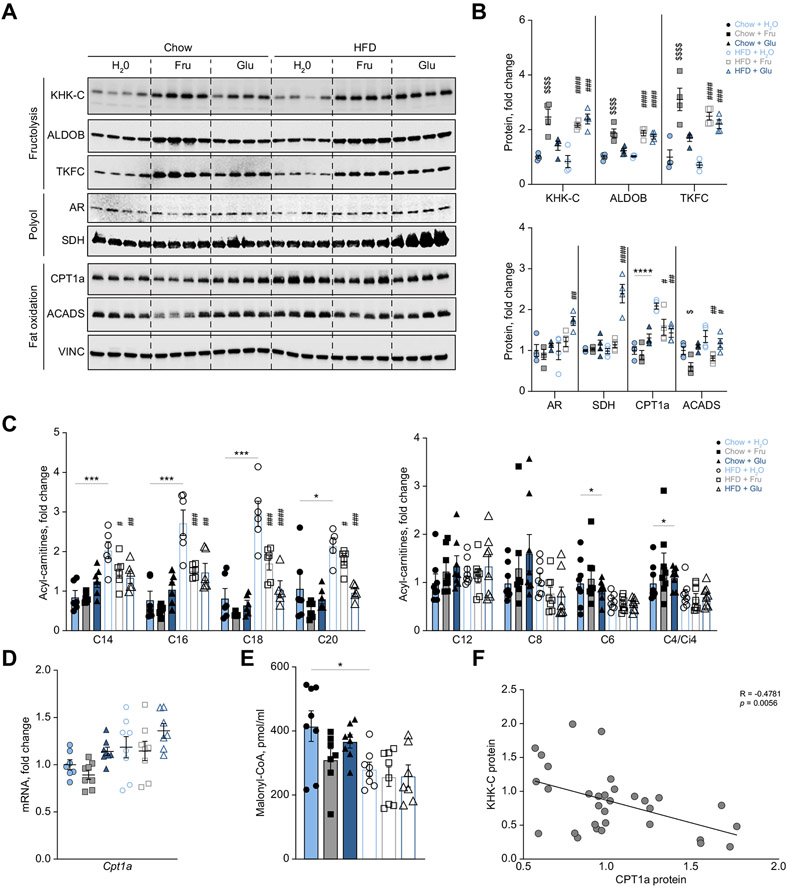
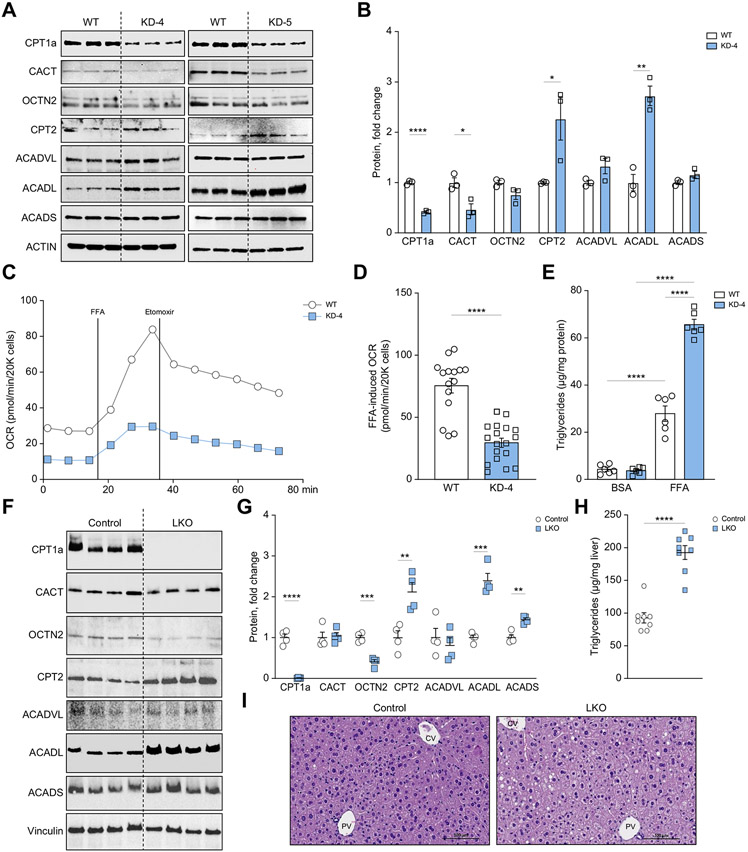
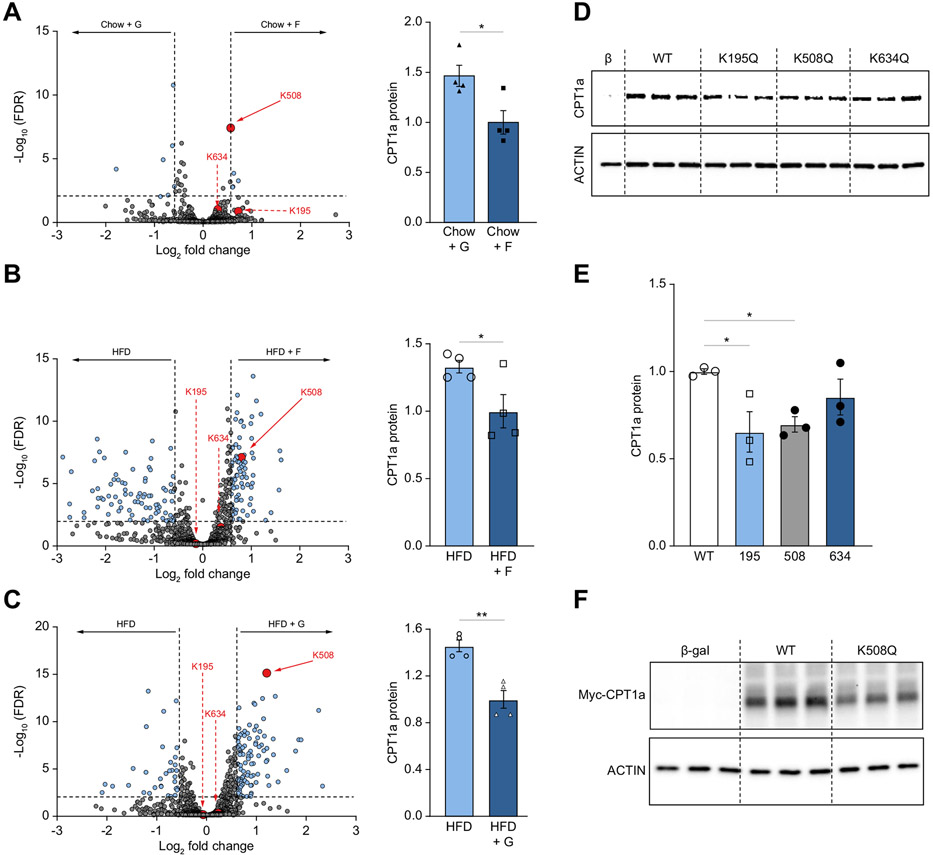
Results: Fructose supplementation in mice fed normal chow and fructose or glucose supplementation in mice fed a HFD increase KHK-C, an enzyme that catalyzes the first step of fructolysis. Elevated KHK-C is associated with an increase in lipogenic proteins, such as ACLY, without affecting their mRNA expression. An increase in KHK-C also correlates with acetylation of CPT1α at K508, and lower CPT1α protein in vivo. In vitro, KHK-C overexpression lowers CPT1α and increases triglyceride accumulation. The effects of KHK-C are, in part, replicated by a knockdown of CPT1α. An increase in KHK-C correlates negatively with CPT1α protein levels in mice fed sugar and a HFD, but also in genetically obese db/db and lipodystrophic FIRKO mice. Mechanistically, overexpression of KHK-C in vitro increases global protein acetylation and decreases levels of the major cytoplasmic deacetylase, SIRT2.

Conclusions: KHK-C-induced acetylation is a novel mechanism by which dietary fructose augments lipogenesis and decreases fatty acid oxidation to promote the development of metabolic complications.

Impact and implications: Fructose is a highly lipogenic nutrient whose negative consequences have been largely attributed to increased de novo lipogenesis. Herein, we show that fructose upregulates ketohexokinase, which in turn modifies global protein acetylation, including acetylation of CPT1a, to decrease fatty acid oxidation. Our findings broaden the impact of dietary sugar beyond its lipogenic role and have implications on drug development aimed at reducing the harmful effects attributed to sugar metabolism.

Keywords: Fructose; Ketohexokinase; Nonalcoholic fatty liver disease; SIRT2; carnitine palmitoyltransferase 1a; fatty acid oxidation; mass spectrometry.


Conflict of interest statement

Conflict of interest

SS receives grant funding from Alnylam Pharmaceuticals, Inc., to study KHK as a target for management of NAFLD. No other conflicts of interest are reported.

Please refer to the accompanying ICMJE disclosure forms for further details.

Figures

Fig. 1.
Fig. 1.. Sugar supplementation of a HFD worsens hepatic steatosis.
(A) Representative Oil red-O staining to assess neutral lipid accumulation across all groups. Scale bar = 20 μm. (B) Hepatic triglyceride and cholesterol levels were quantified enzymatically (n = 5-6). (C) Long-chain acyl-CoA levels quantified by mass spectrometry (n = 6). (D) Representative cytoplasmic and nuclear protein was blotted for ChREBP, SREBP1, GAPDH (cytoplasmic control), and Lamin A/C (nuclear control). (E) Liver mRNA levels of Acly, Acc1, Fasn, and Scd1 were quantified by qPCR (n = 7-8). (F, G) Protein levels of ACLY, ACC1, FASN, SCD1, KHK–C, and ACSS2 were measured by western blot (F) and quantified using densitometry (G; n = 4). (H) KHK–C-overexpressing hepG2 hepatocytes were treated with 25 μg/ml of cycloheximide (CHX) or CHX+25 mM fructose (C+Fru) for 4 h. After 4-hour incubation, protein levels of ACLY, ACC1, FASN, ACSS2, and ACTIN (loading control) were measured using western blot. Baseline (BL) was compared to CHX and C+Fru treatment. (I) Densitometry quantification of ACLY protein in Fig. 1H and Fig. S2E. Significance was determined by two-way ANOVA with Sidak’s post hoc analysis of sugar supplementation (H2O, Fru, Glu) and solid diet (chow and HFD). Significance denoted with ($) compares sugar-supplemented groups to their chow+H2O control (*) comparing HFD+H2O to chow+H2O group or the difference between adjacent groups using a post hoc Student’s t test, and lastly (#) denotes significance of sugar-supplemented groups compared to their HFD+H2O control. #p<0.05; ##p<0.01; ###p<0.001; ####p<0.0001.
Fig. 2.
Fig. 2.. Upregulation of KHK–C correlates with mitochondrial histology, but minimally affects TCA cycle and amino acid metabolism.
(A) Graphical representation of the TCA cycle. (B-D) Hepatic TCA cycle intermediates (B), branched chain (C) and essential amino acids (D) measured by mass spectrometry (n = 6). (E-G) Representative transmission electron microscopy (EM) 5,000x images. (E) and pie-chart representation (F) of mitochondrial length shown as a percent of four equal length subgroups. (n = 3 mice, EM images contained 26-78 mitochondria per slide). (G) Percent of small mitochondria from 0-500 nm in length (n = 3 mice per group). Significance was determined by two-way ANOVA with Sidak’s post hoc analysis of sugar supplementation (H2O, Fru, Glu) and solid diet (Chow and HFD). Significance denoted with ($) compares sugar-supplemented groups to their chow+H2O control (*) comparing HFD+H2O to chow+H2O group or the difference between adjacent groups using a post hoc Student’s t test, and lastly (#) denotes significance of sugar-supplemented groups compared to their HFD+H2O controls. #p<0.05; ##p<0.01; ###p<0.001; ####p<0.0001.
Fig. 3.
Fig. 3.. KHK–C is inversely associated with CPT1α protein and long-chain acylcarnitine levels.
(A-B) Protein levels measured by western blot (A) of fructolysis (KHK–C, ALDOB, TKFC), polyol (AR, SDH), and fat oxidation proteins (CPT1α, ACADS), and quantified by densitometry (B) normalized to vinculin (VINC) loading control (n = 4). (C) Hepatic long-chain acylcarnitine levels measured by GC-MS (n = 5-6). (D) Liver CPT1α mRNA expression across the six groups (n = 8). (E) Hepatic malonyl-CoA levels quantified by mass spectrometry (n = 8). (F) Linear regression analysis using KHK–C and CPT1α protein normalized to vinculin from panel A (n = 24) and from db/db mice (Fig. S5D; n = 8 for a total of 32 samples included in the linear regression). Significance was determined by two-way ANOVA with Sidak’s post hoc analysis of sugar supplementation (H2O, Fru, Glu) and solid diet (Chow and HFD). Significance denoted with ($) compares sugar-supplemented groups to their chow+H2O control (*) comparing HFD+H2O to chow+H2O group or the difference between adjacent groups using a post hoc Student’s t test, and lastly (#) denotes significance of sugar-supplemented groups compared to their HFD+H2O control. #p<0.05; ##p<0.01; ###p<0.001; ####p<0.0001.
Fig. 4.
Fig. 4.. Ketohexokinase-C overexpression impairs long-chain fatty acid oxidation in mouse hepatocytes.
(A) qPCR was used to measure Khk-c and Khk-a mRNA levels in WT and KHK–C-overexpressing AML12 hepatocytes (n = 6) (B–C) KHK–C and carnitine shuttle/FAO proteins (CPT1α, OCTN2, CACT, CPT2) assessed by western blot (B) and quantified by densitometry using actin as a loading control (C; n = 3) (D-E) Seahorse fatty acid oxidation assay (D) recording oxygen consumption rate (OCR) in WT and KHK–C-overexpressing AML12 hepatocytes upon stimulation with free fatty acids (FFAs) and treated with the CPT1α inhibitor etomoxir (E; n = 10-11) (F) Acetyl-CoA levels were quantified in WT and KHK–C-overexpressing AML12 hepatocytes (n = 5). (G-H) Mitosubstrate assay from BioLog quantifying palmitoyl-carnitine (G) and octanoyl-carnitine (H) utilization in WT and KHK–C-overexpressing AML12 cells (n = 5). The panels to the right quantify the rate of substrate utilization over 45 min. (I) Triglycerides were quantified enzymatically from WT and KHK–C-overexpressing cells treated with BSA or 0.4 mM FFA for 24 h (n = 6). (J) Seahorse glycolysis assay recording extracellular acidification rate (ECAR) in WT and KHK–C-overexpressing cells in response to glucose, oligomycin (Oligo), and 2-deoxyglucose (2DG). Glycolysis is quantified in the panel on the right as area under curve. Significance was determined using unpaired, Student’s t test. For panel I, significance was determined by two-way ANOVA with Sidak’s post hoc analysis comparing OE vs. WT groups. Significance is defined as *p<0.05; **p<0.01; ***p<0.001; ****p<0.0001.
Fig. 5.
Fig. 5.. CPT1a knockdown, in part, mirrors KHK–C overexpression in mouse hepatocytes.
(A-C) Carnitine shuttle/FAO protein levels (CPT1α, CACT, OCTN2, CPT2, ACADVL, ACADL, ACADS) were measured by western blot in WT and CPT1α knockdown clones 4 (KD-4) and 5 (KD-5) (A), and were further quantified by densitometry (B, KD-4 and S8C, KD-5) using actin as a loading control (n = 3). (C-D) Seahorse fatty acid oxidation assay (C) recording oxygen consumption rate (OCR) in WT and CPT1α KD-4 AML12 hepatocytes upon stimulation with free fatty acid (FFA) (D; n = 15-18 wells per group). (E) Triglycerides were quantified enzymatically from WT and KD-4 cells treated with BSA or 0.4 mM FFA for 24 h (n = 6). (F, G) Carnitine shuttle and FAO protein levels (CPT1α, CACT, OCTN2, CPT2, ACADVL, ACADL, ACADS) were measured by western blot (F) and were further quantified by densitometry (G) from CPT1a LKO and littermate control male mice. (H, I) Hepatic triglycerides were quantified (H) and livers were stained with H&E (I). 40x magnification and scale bar = 100 μm. Significance was determined using unpaired, Student’s t test. Significance is defined as *p<0.05; **p<0.01; ***p<0.001; ****p<0.0001. CV, central vein; PV, portal vein.
Fig. 6.
Fig. 6.. Acetylation at lysine 508 decreases CPT1α protein levels.
(A-C) Volcano plots (A, B, C) highlighting all acetylation sites that are different between two dietary groups. CPT1α acetylation sites are highlighted in red. The horizontal black bar denotes the significance cut-off of FDR = 0.01. The vertical black bars denote a minimal threshold for effect size of 1.5 (Log2 fold-change = ±0.58). Quantification of total CPT1α protein levels (A, B, C; right) normalized to vinculin (loading control) across the same two groups. Protein levels of CPT1α were measured by western blot (D) in COS-7 cells transfected with plasmids encoding β-galactosidase control (β-gal), wild-type (WT) CPT1α, and mutant K195Q, K508Q, and K634Q CPT1α. (E) Densitometry quantification of the data in panel D. (F) Western blot for c-MYC tag in cells transfected with β-galactosidase control (Cont) plasmid, wild-type (WT) CPT1α c-MYC tagged plasmid and mutant CPT1α K508Q c-MYC tagged plasmid. Significance was determined by one-way ANOVA with Dunnet’s post hoc analysis comparing Cont to WT and mutant CPT1α proteins. Significance is defined as *p<0.05; **p<0.01; ****p<0.0001.
Fig. 7.
Fig. 7.. KHK–C OE drives global protein acetylation in AML12 hepatocytes and alters sirtuin levels.
(A) Partial least squares-discriminant analysis comparing WT and KHK–C OE total protein levels. (B) Gene ontology analysis highlighting the top 10 most downregulated biological processes in KHK–C-overexpressing hepatocytes. (C) Partial least squares-discriminant analysis comparing acetylated peptides in WT and KHK–C-overexpressing cells. (D) Volcano plot analysis highlighting acetylated peptides that are increased (in red) or decreased (in purple) with KHK–C OE. The horizontal black bar denotes the significance cut-off of p value = 0.05. The vertical black bars denote a minimal threshold for effect size of 1.5 (Log2 normalized fold-change = ±0.58) (E, F) Sirtuin protein levels (SIRTS2-5) were measured by western blot in WT and KHK–C-overexpressing (E) cells and were quantified by densitometry using Vinculin (VINC) as a loading control. Sirt3 full-length (3-FL) and Sirt3 cleaved (3-CL) proteins (F; n = 3). Significance was determined using unpaired, Student’s t test, and is defined as *p<0.05; **p<0.01; ***p<0.001.

References

    1. Softic S, Kahn CR. Fatty liver disease: is it nonalcoholic fatty liver disease or obesity-associated fatty liver disease? Eur J Gastroenterol Hepatol 2019;31:143. - PMC - PubMed
    1. Perumpail BJ, Khan MA, Yoo ER, Cholankeril G, Kim D, Ahmed A. Clinical epidemiology and disease burden of nonalcoholic fatty liver disease. World J Gastroenterol 2017;23:8263–8276. - PMC - PubMed
    1. Malik VS, Hu FB. Sweeteners and risk of obesity and type 2 diabetes: the role of sugar-sweetened beverages. Curr Diab Rep 2012;12:195–203. - PubMed
    1. Malik VS, Hu FB. Sugar-sweetened beverages and cardiometabolic health: an update of the evidence. Nutrients 2019;11. - PMC - PubMed
    1. Helsley RN, Moreau F, Gupta MK, Radulescu A, DeBosch B, Softic S. Tissue-specific fructose metabolism in obesity and diabetes. Curr Diab Rep 2020;20:64. - PMC - PubMed

Publication types