. 2023 May 31;192(2):967-981.
doi: 10.1093/plphys/kiad117.

Armadillo repeat only protein GS10 negatively regulates brassinosteroid signaling to control rice grain size

Affiliations

Armadillo repeat only protein GS10 negatively regulates brassinosteroid signaling to control rice grain size

Erwang Chen et al. Plant Physiol. .

Abstract

Grain yield and grain quality are major determinants in modern breeding controlled by many quantitative traits loci (QTLs) in rice (Oryza sativa). However, the mechanisms underlying grain shape and quality are poorly understood. Here, we characterize a QTL for grain size and grain quality via map-based cloning from wild rice (W1943), GS10 (Grain Size on Chromosome 10), which encodes a protein with 6 tandem armadillo repeats. The null mutant gs10 shows slender and narrow grains with altered cell size, which has a pleiotropic effect on other agronomical traits. Functional analysis reveals that GS10 interacts with TUD1 (Taihu Dwarf1) and is epistatic to OsGSK2 (glycogen synthase kinase 2) through regulating grain shape and lamina joint inclination, indicating it is negatively involved in brassinosteroid (BR) signaling. Pyramiding gs10 and the grain size gene GW5 into cultivar GLA4 substantially improved grain shape and appearance quality. Natural variation analysis revealed that gs10 from the wild rice Oryza rufipogon W1943 is a rare allele across the rice population. Collectively, these findings advance our understanding of the underlying mechanism of grain shape and provide the beneficial allele of gs10 for future rice breeding and genetic improvement.


Conflict of interest statement

Conflict of interest statement. None declared.

Figures

Figure 1.
Figure 1.
Map-based cloning of GS10. Plant morphology and grain shape phenotype between GLA4 and CSSL50. Scale bar, 5 cm (A), 1 cm (B, both panels). C)GS10 was initially mapped between marker loci OP10-6 and OP10-7 using 155 BC2F2 plants based on the phenotype of GW and grain length/GW. D)GS10 was then fine-mapped to a 10-kilobase (kb) genomic region between the marker SNP10-6 and SNP10-3 using the BC2F4 population. Genotype (left), GW (middle), and grain length/GW (right) were shown for recombinant plants and the control plants. White and black bars represent chromosomal segments homozygous for GLA4 and W1943 alleles, respectively. The only 1 predicted open reading frame in the 10-kb delimited region among 3 CSSLs and their parents. The numbers below the molecular markers in (D) indicate the number of recombinants. Statistics of grain length E), GW F), grain length/GW G), grain thickness H), and grain weight I) between GLA4 and CSSSL50, n ≥ 18. Values are given as the mean ± Sd. Student's t-test significant difference, ***P < 0.001; ns, not significant.
Figure 2.
Figure 2.
Conformation of GS10 by the transgenic test. A) Schematic representation of gene structure and allelic variation of the GS10, the numbers below the gene bar indicate the number of polymorphic nucleotide(s) located in the coding region. The nucleotides of the causative mutation are in red. CDS, coding region sequence. B) Transgenic validation of GS10. Two complementary transgenic lines, CP-1 (pGLA4::gGS10GLA4) and CP-2 (pW1943::gGS10GLA4) were constructed, expressing the GS10 gDNAGLA4 fused with a native promoter from GLA4 and W1943 based on the background of NIL-gs10; the overexpressing lines (OX, Ubi::GS10GLA4) and knock-out lines GS10-CR based on the GLA4 background. C) Schematic representation of CRISPR/Cas9-edited sequence in GS10-CR alleles. The GS10-CR mutant has a 289-bp deletion (the resulting knock-out region is in red) in the coding region. Confirmation by using the near-isogenic line. Morphology of grain shape D), panicle E) of GLA4, the near-isogenic line NIL-gs10, and different transgenic lines (CP-1, GS10-CR, GS10-OX, and CP-2) during maturation from the field. Scale bars, 1 cm (D, for all panels), 5 cm (E). Comparison of grain length F), GW G), grain weight H), and panicle length I) between different lines (GLA4, NIL-gs10, CP-1, GS10-CR, GS10-OX, and CP-2), n = 6. J) Phylogenetic analysis of putative ARM proteins in representative species. OsPUB15, spl11, and TUD1 are all characterized genes. Scale bar, 0.1. K) Plant morphology phenotype between CR-GSL1 and CR-GS10-GSL1. Scale bars, 10 cm. L) Grain shape between ZH11, CR-GSL1, and CR-GS10-GSL1. Scale bar, 5 mm (for all panels). M, N) Statistics of GW and grain length/GW between ZH11, CR-GS10, CR-GSL1, and CR-GS10-GSL1, n = 6. Values are given as the mean ± Sd. As determined by Duncan's multiple-range test, lowercase letters indicate significant differences (P < 0.05).
Figure 3.
Figure 3.
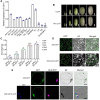
Expression pattern and subcellular localization of GS10. A) Relative expression of GS10 in different tissues of GLA4. PA, panicle before heading; FL, flag leaf; LS, leaf sheath; TB, tiller bud. OsUBQ5 was used as the control. Data are presented as mean values ± Sd, n = 3 biologically independent samples. B) Comparison of the shape of developing caryopsis at indicated DAF between GLA4 (left) and NIL-gs10 (right). Scale bars, 1 mm. C) Statistics of developing caryopsis dry weight at indicated days between GLA4 and NIL-gs10. Data are presented as mean values ± Sd, n = 3 biologically independent samples. Subcellular localization of GS10 (35S::GS10-GFP) in N. benthamiana leaf D) and rice protoplasts E). The plasmid 35S::GFP and NLS-RFP (nuclei marker) were used as the control. Scale bar, 10 μm D) and 20 μm E) in N. benthamiana leaf; 10 μm in rice protoplasts. Chl, chlorophyll. BF, bright field. Student's t-test significant difference, *P < 0.05 and ***P < 0.001; ns, not significant.
Figure 4.
Figure 4.
GS10 regulates grain shape by altering cell size. A) Histological comparison of spikelet hulls between GLA4 and NIL-gs10. Scale bars, 5 mm. B) Cross-sections of spikelet hulls. The right images show closeup views of the boxed region. Scale bars, 100 μm. C) Scanning electron microscopy observation of the outer glumes between GLA4 and NIL-gs10. D) Cell number in longitude and latitude of glumes (n = 4). E) Statistics of cell width in latitude (n = 4). Relative expression levels of cell cycle-related genes F) and cell-expansion genes G) in young panicles (1 to 3 cm) of GLA4 and NIL-gs10. OsUBQ5 was used as the control, and the expression levels in GLA4 were set to 1. n = 3 biologically independent samples. Values are given as the mean ± Sd. Student's t-test significant difference: *P < 0.05, **P < 0.01 and ***P < 0.001; ns, not significant.
Figure 5.
Figure 5.
GS10 interacts with TUD1, which is involved in BR signaling. A) Y2H assay of GS10, TUD1, and D1. AD, activation domain; BD, binding domain. SD–Leu–Trp–His–Ade (or SD–Leu–Trp), SD medium lacks Leu, Trp, Ade, and His (or lacks Leu, Trp). B) In vivo protein interaction of GS10 and TUD1 based on LCI in N. benthamiana leaf. C) BiFC assay between GS10 and TUD1 in N. benthamiana leaf. nYFP-GS10 and cYFP-GS10 were used as the control. BF, bright field. D) Statistics of lamina joint inclination in GLA4, NIL-gs10, GS10-CR, and GS10-OX. n = 40. E) Statistics of lamina joint inclination in ZH11, GS10-CR-ZH11, GS10-OX-ZH11, GS10-OsGSK2-CR, OsGSK2-CR, OsGSK2-OX, and OsGSK2-RNAi transgenic lines. n ≥ 40. F) Comparison of 3-d seedlings after 0 and 1 mg BL treatment based on GLA4 and NIL-gs10 background. BL, brassinolide. Scale bars, 1 cm. G) Statistics of coleoptile after 0 and 1 mg BL treatment based on GLA4 and NIL-gs10 background. n = 19. H) Lamina joint inclination comparison of GLA4 and NIL-gs10 after 0 and 1 mg BL treatment, n ≥ 4. As determined by Duncan's multiple-range test, lowercase letters indicate significant differences (P < 0.05). Values are given as the mean ± Sd. Student's t-test significant difference: *P < 0.05, **P < 0.01, and ***P < 0.001; ns, not significant.
Figure 6.
Figure 6.
Relationship between gs10 and other grain-size QTLs. A) Phenotypes of grain shape between different pyramiding lines. The pyramiding lines NIL-gs10/GL7, NIL-gs10/GW5, NIL-GL7/GW5, and NIL-gs10/GW5/GL7 were constructed through the combination between NIL-gs10, NIL-GW5, and NIL-GL7 (also referred to NIL-GW7); NIL-GW5, the near-isogenic line contains the GW5 allele in GLA4; NIL-GL7/GW7, the near-isogenic line has the GL7/GW7 allele in GLA4; Scale bar, 1 cm (for all panels). Comparison of GW B), grain length/GW C) and 1,000-grain weight D) between different pyramiding lines, n = 6. Values are given as the mean ± Sd. As determined by Duncan's multiple-range test, lowercase letters indicate significant differences (P < 0.05).
Figure 7.
Figure 7.
Pyramiding gs10 and GW5 could significantly improve rice grain appearance quality. A) The shape of milled rice of NIL-gs10, NIL-GW5, and NIL-GW5/gs10 and its recipient GLA4. Decreased chalkiness in milled rice of NIL-GW5/gs10 compared with those of GLA4. Statistics of the percentage of chalky grain B) and chalkiness degree C) between GLA4, NIL-gs10, NIL-GW5, and NIL-GW5/gs10; n = 6. Values are given as the mean ± Sd. Student's t-test significant difference: *P < 0.05 and ***P < 0.001; ns, not significant.
Figure 8.
Figure 8.
Natural variation of GS10 in rice population. A) Genetic diversity around the GS10 region. Red, green, and blue lines indicate nucleotide diversity (π) of all sites in O. rufipogon, O. indica, and O. japonica, respectively. The arrow indicates the position of GS10. B) A proposed working model of GS10 for regulating grain shape, plant architecture, and grain quality.

References

    1. Barkan A, Small I. Pentatricopeptide repeat proteins in plants. Annu Rev Plant Biol. 2014:65(1):415–442. 10.1146/annurev-arplant-050213-040159 - DOI - PubMed
    1. Che R, Tong H, Shi B, Liu Y, Fang S, Liu D, Xiao Y, Hu B, Liu L, Wang H, et al. . Control of grain size and rice yield by GL2-mediated brassinosteroid responses. Nat Plants. 2016:2(1): 15195. 10.1038/nplants.2015.195 - DOI - PubMed
    1. Clevers H, Nusse R. Wnt/beta-catenin signaling and disease. Cell. 2012:149(6): 1192–1205. 10.1016/j.cell.2012.05.012 - DOI - PubMed
    1. Coates JC. Armadillo repeat proteins: beyond the animal kingdom. Trends Cell Biol. 2003:13(9): 463–471. 10.1016/S0962-8924(03)00167-3 - DOI - PubMed
    1. Duan P, Xu J, Zeng D, Zhang B, Geng M, Zhang G, Huang K, Huang L, Xu R, Ge S, et al. . Natural variation in the promoter of GSE5 contributes to grain size diversity in rice. Mol Plant. 2017:10(5): 685–694. 10.1016/j.molp.2017.03.009 - DOI - PubMed

Publication types

Substances

LinkOut - more resources