. 2023 Feb;11(2):e006464.
doi: 10.1136/jitc-2022-006464.

Predictive biomarkers for PD-1/PD-L1 checkpoint inhibitor response in NSCLC: an analysis of clinical trial and real-world data

Affiliations

Predictive biomarkers for PD-1/PD-L1 checkpoint inhibitor response in NSCLC: an analysis of clinical trial and real-world data

WeiQing Venus So et al. J Immunother Cancer. 2023 Feb.

Abstract

Background: Many biomarkers have been proposed to be predictive of response to anti-programmed cell death protein-1 (PD-1)/anti-programmed death ligand-1 (PD-L1) checkpoint inhibitors (CPI). However, conflicting observations and lack of consensus call for an assessment of their clinical utility in a large data set. Using a combined data set of clinical trials and real-world data, we assessed the predictive and prognostic utility of biomarkers for clinical outcome of CPI in non-small cell lung cancer (NSCLC).

Methods: Retrospective cohort study using 24,152 patients selected from 71,850 patients with advanced NSCLC from electronic health records and 9 Roche atezolizumab trials. Patients were stratified into high and low biomarker groups. Correlation with treatment outcome in the different biomarker groups was investigated and compared between patients treated with CPI versus chemotherapy. Durable response was defined as having complete response/partial response without progression during the study period of 270 days.

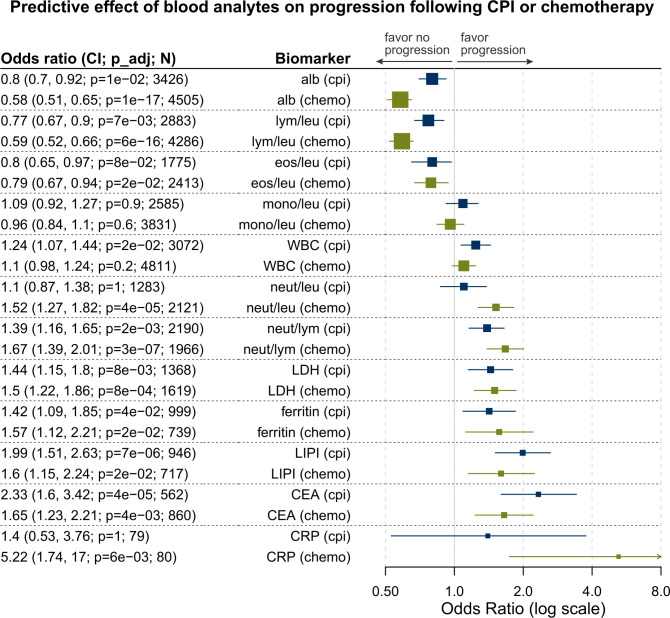
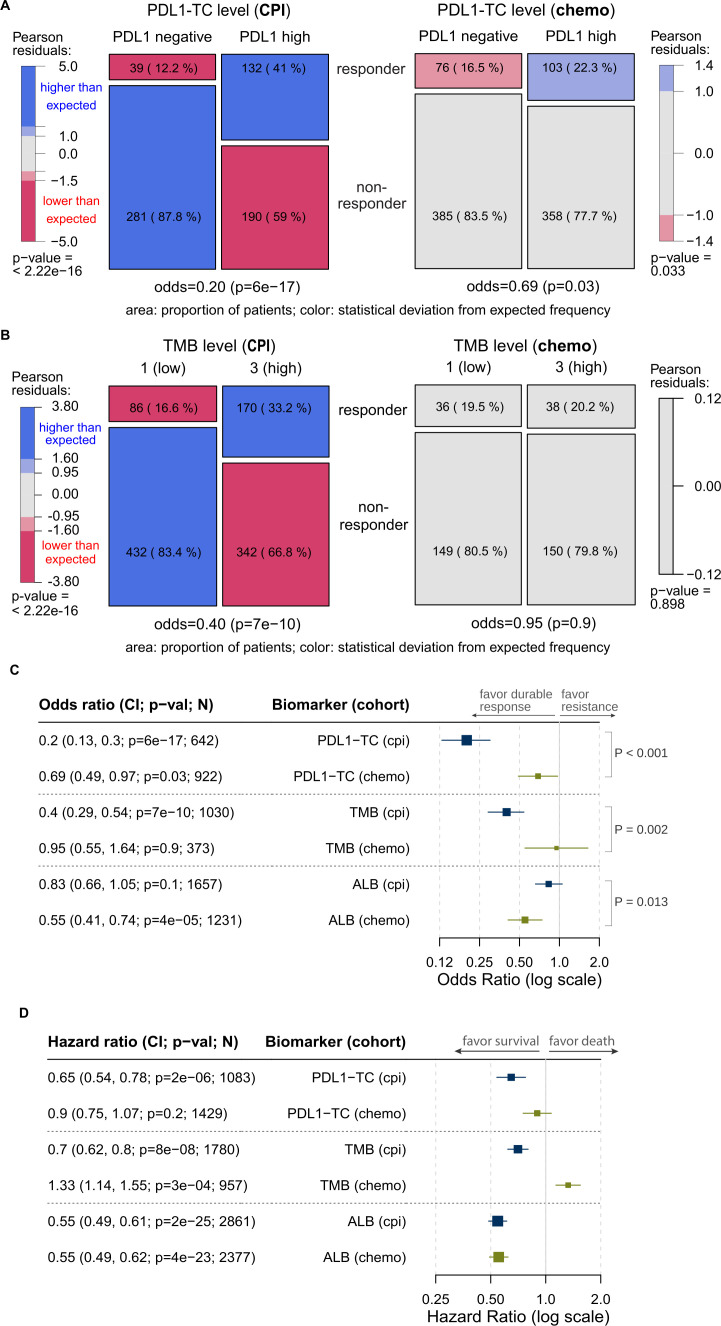
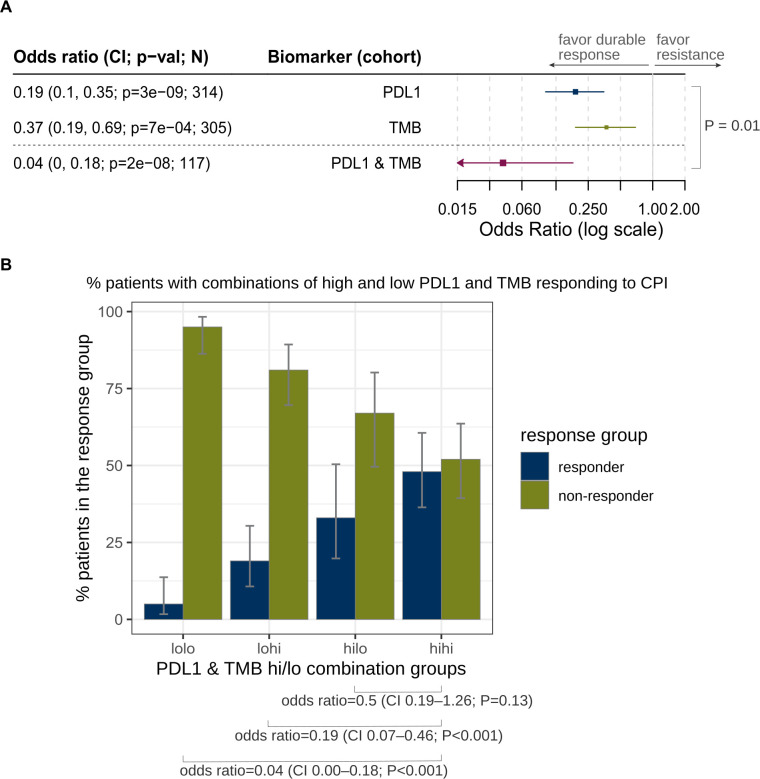
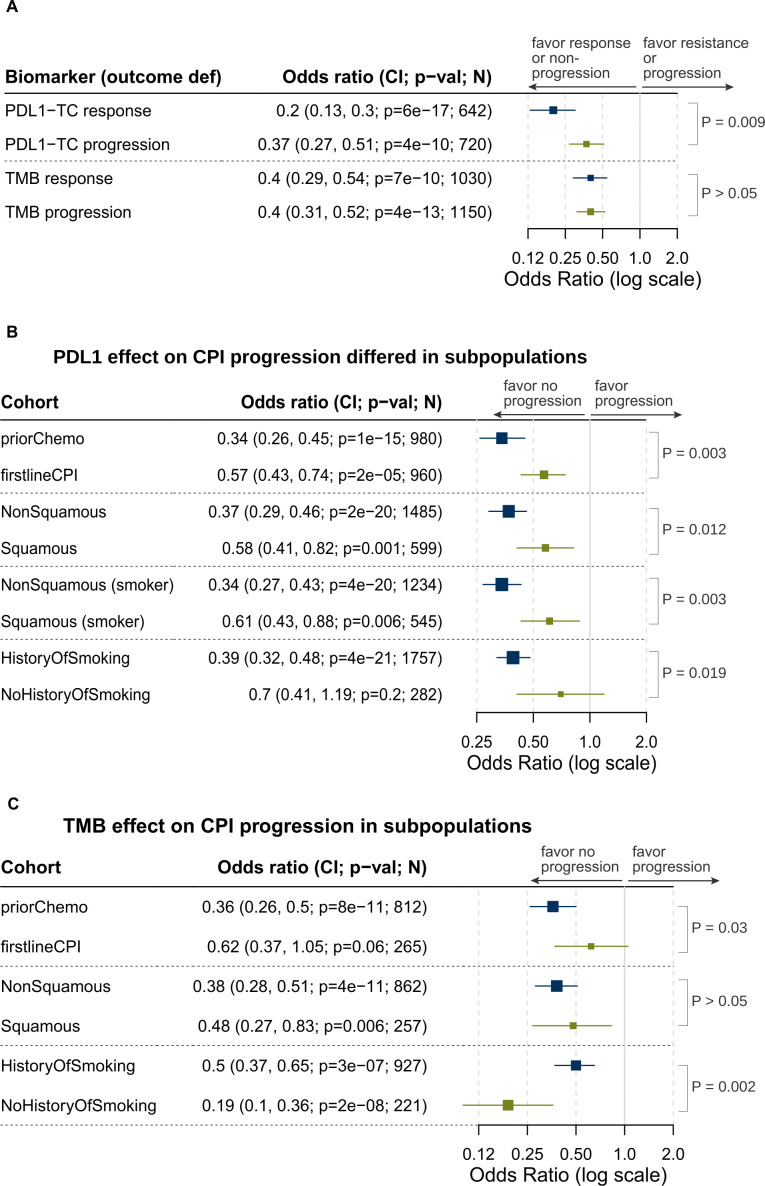
Results: Standard blood analytes (eg, albumin and lymphocyte) were just prognostic, having correlation with clinical outcome irrespective of treatment type. High expression of PD-L1 on tumors (≥50% tumor cell staining) were specifically associated with response to CPI (OR 0.20; 95% CI 0.13 to 0.30; p<0.001). The association was stronger in patients with non-squamous than squamous histology, with smoking history than non-smokers, and with prior chemotherapy than first-line CPI. Higher tumor mutational burden (TMB) (≥10.44 mut/Mb) was also specifically associated with durable response to CPI (OR=0.40; 95% CI 0.29 to 0.54; p<0.001). The combination of high TMB and PD-L1 expression was the strongest predictor of durable response to CPI (OR=0.04; 95% CI 0.00 to 0.18; p<0.001). There was no significant association between PD-L1 or TMB levels with response to chemotherapy, suggesting a CPI-specific predictive effect.

Conclusions: Standard blood analytes had just prognostic utility, whereas tumor PD-L1 and TMB specifically predicted response to CPI in NSCLC. The combined high TMB and PD-L1 expression was the strongest predictor of durable response. PD-L1 was also a stronger predictor in patients with non-squamous histology, smoking history or prior chemotherapy.

Keywords: Biomarkers, Tumor; Clinical Trials as Topic; Immunotherapy; Translational Medical Research.


Conflict of interest statement

Competing interests: None declared.

Figures

Figure 1
Figure 1
Patient selection and treatment outcome group definitions. (A) Patient selection for the study cohorts. Blue numbers in parentheses denote numbers of patients combined from the three data sources (CGDB, the nine in-house atezolizumab studies and FH database) at each step of patient selection and analysis. The numbers at the end of patient selection step with ‘baseline biomarker data’ show the numbers of patients with the most commonly available biomarker analyzed (white blood cell (WBC)). For the other biomarkers, the patient numbers are illustrated in each analysis figure. In each biomarker analysis, patients were stratified into high and low biomarker groups, and the correlation between biomarker levels and treatment outcome groups was studied. Patients with intermediate biomarker levels (eg, second tertile) were not analyzed. The biomarker high and low groups were balanced on baseline characteristics using propensity score-based SMRW method. Patients in the bottom ‘response’ analysis were also included in the ‘progression’ analysis since they had both response and progression outcome data. The ‘progression’ analysis included additional patients from the FH database because disease progression data is available. (B) Kaplan-Meier plot of overall survival of FH patients treated with CPI or chemotherapy with their first CPI or chemotherapy started during 2015 to February 2020 when the therapies were both used. Dotted vertical line indicates the cut-off used to exclude early deaths, when the two survival curves can be well differentiated. The two groups were balanced on their baseline characteristics using propensity score-based SMRW weights. (C) Treatment outcome group definitions. Each group is represented by a schematic patient journey. Same definition is used for CPI or chemotherapy, but CPI is used as an example for illustration. Patients were aligned on their first CPI treatment day (↓). Disease progression during the first 14 days following CPI initiation was excluded as recommended by Flatiron Health (grayed period). Example of disease progression (x) and/or tumor response events (⬤) are indicated on the journey. The analysis of response to CPI (blue box) used both tumor response and disease progression data. A durable response was defined as having a CR or PR within the study duration. The analysis of progression on CPI (yellow box) used only progression data. Progressors were defined as patients with a progression event during the study duration. Footnotes for figure 1A: *Patients who died within 18 weeks from treatment start were removed (see Methods and Discussion for rationale). £Under the durable outcome definition (figure 1C), durable response or clinical benefit requires the entire study duration (270 days in this study) to confirm the durability. ΨPatient characteristics are provided in table 1. #Number of patients with the most commonly available biomarker (WBC) from FH, CGDB and trials, respectively. §Analysis performed on patients using durable response definition in figure 1C. ¥Analysis performed on patients using durable clinical benefit definition in figure 1C. CGDB, Clinico-Genomic Database; CPI, checkpoint inhibitors; CR, complete response; FH, Flatiron Health; NSCLC, non-small cell lung cancer; PD, progressive disease; PR, partial response; SMRW, Standardized Mortality Ratio Weighting.
Figure 2
Figure 2
Prognostic effect of standard blood analytes. Forest plot of association of standard blood analytes with CPI progression in Flatiron Health patients. OR <1 indicates association of high biomarker levels (third tertile) with greater odds for no disease progression, compared with low biomarker expression (first tertile). OR >1 indicates the opposite and OR of 1 indicates no impact of the biomarker on clinical outcome. The groups of patients with high and low biomarker levels were balanced on their baseline characteristics using Standardized Mortality Ratio Weighting algorithm. P values were multiple testing corrected by the Holm method.CEA, carcinoembryonic antigen; CPI, checkpoint inhibitors; CRP, C-reactive protein; LDH, lactate dehydrogenase; LIPI, Lung Immune Prognostic Index; PWBC, white blood cell.
Figure 3
Figure 3
Predictive effect of PD-L1 and TMB for responses to CPI or chemotherapy in CGDB and atezolizumab trial patients. (A) Distribution of CPI (left plot) and chemotherapy (right plot) durable responders and non-responders among the PD-L1-high and PD-L1-negative patients. (B) Distribution of CPI (left plot) and chemotherapy (right plot) durable responders and non-responders among the TMB high and low patients. (C) Forest plot of association of baseline tumor PD-L1 and TMB, and blood albumin with response to CPI versus chemotherapy. The differences in each pair of CPI and chemo ORs were statistically significant (z-test). (D) Forest plot of association of baseline tumor PD-L1 and TMB, and blood albumin with overall survival. For A–D, the groups of patients with high and low biomarker levels were balanced on their baseline characteristics using Standardized Mortality Ratio Weighting algorithm, which outputs weights for each patient. For both A and B, the numbers in each of the cells of the mosaic plot indicate the weighted patient counts and percentages in the corresponding biomarker group. The areas indicate the proportion of the weighted patient counts in each of the four groups. Χ2 p value (under the color legend scale bar) indicates overall statistical significance of any association between PD-L1 or TMB levels and CPI response. Color indicates individual statistical significance associated with each cell. Blue indicates significantly higher patient numbers and red indicates significantly lower numbers than if the distribution was random. Color intensity indicates the extent of significance from expected (light and dark color correspond to confidence levels of 90% and 99%, respectively). The OR is from Fisher’s exact test of the weighted patient counts. For C and D, OR (C) or HR (D) <1 indicates association of high biomarker levels with greater odds for clinical response (C) or overall survival (D), compared with low biomarker level. OR/HR >1 indicates the opposite and ratio of 1 indicates no impact of the biomarker on clinical outcome. ALB, albumin; CGDB, Clinico-Genomic Database; CPI, checkpoint inhibitors; PD-L1, programmed death ligand-1; TC, tumor cells; TMB, tumor mutational burden.
Figure 4
Figure 4
Combined effect of tumor PD-L1 and TMB for responses to CPI. (A) Forest plot showing OR and 95% CI for individual and combined biomarker effects in patients with both PD-L1 and TMB data. The top two rows are patients with high versus low level of individual biomarkers. ORs <1 indicate association of high biomarker levels with greater odds for clinical response, compared with low biomarker levels. The combined PD-L1 and TMB patients (dual-high compared with dual-low) in the bottom row showed a much stronger predictive effect than each individual biomarker in the top two rows (OR 0.04 vs OR 0.2 and 0.4, respectively). The difference in the ORs is statistically significant (bootstrap p=0.01). All high and low biomarker patient groups in each analysis were balanced on their baseline characteristics using Standardized Mortality Ratio Weighting algorithm. (B) Bar chart shows the per cent of CPI durable responder/non-responder groups in each of the four combined high and low expression groups: first indicates PD-L1-TC (‘lo’=PD-L1 negative; ‘hi’=PD-L1 high) and second TMB (‘lo’=first tertile; ‘hi’=third tertile). Error bars indicate 95% confidence that the true proportion are within the intervals. ORs indicate the odds of being non-responding in patients who had both biomarkers high versus those with only one of the biomarkers high or both low. CPI, checkpoint inhibitors; PD-L1, programmed death ligand-1; TC, tumor cells; TMB, tumor mutational burden.
Figure 5
Figure 5
Factors influencing predictive effect of PD-L1 and TMB on progression following CPI therapy. (A) Confirmation of predictive effect of PD-L1 and TMB on disease progression outcome. Treatment outcome was defined using two different definitions: having response (CR and PR) versus having non-progression (equivalent to CR, PR and SD), as illustrated in figure 1C. Patients who had both response and progression data (in CGDB and clinical trials) were used for these comparisons. The forest plot shows the ORs of patient groups with high versus low biomarker levels, their odds of having either response or progression. Only PD-L1 levels showed a significant difference in the two ORs for the two outcome definitions (p=0.009). (B) Forest plot showing ORs comparing CPI progression in high PD-L1 versus negative PD-L1 in different subpopulations. Patients from all three data sources were used. The differences in each pairs of ORs were statistically significant (z-test ≤0.05). (C) Forest plot showing ORs comparing CPI progression in third tertile versus first tertile of TMB in different subpopulations. Patients from CGDB and atezolizumab trials who had TMB data were used. The prior therapy and analysis of smoking history showed significant difference in the two ORs (z-test p<0.05). For all the plots, higher ORs on the >1 side indicate stronger biomarker predictive effect on CPI progression. In each pair of analyses, the high and low biomarker level groups were balanced by their baseline characteristics using the Standardized Mortality Ratio Weighting algorithm. CGDB, Clinico-Genomic Database; CPI, checkpoint inhibitors; CR, complete response; PD-L1, programmed death ligand-1; PR, partial response; SD, stable disease; TMB, tumor mutational burden.

References

    1. Brahmer J, Reckamp KL, Baas P, et al. Nivolumab versus docetaxel in advanced squamous-cell non-small-cell lung cancer. N Engl J Med 2015;373:123–35. 10.1056/NEJMoa1504627 - DOI - PMC - PubMed
    1. Carbone DP, Reck M, Paz-Ares L, et al. First-Line nivolumab in stage IV or recurrent non-small-cell lung cancer. N Engl J Med 2017;376:2415–26. 10.1056/NEJMoa1613493 - DOI - PMC - PubMed
    1. Fehrenbacher L, Spira A, Ballinger M, et al. Atezolizumab versus docetaxel for patients with previously treated non-small-cell lung cancer (poplar): a multicentre, open-label, phase 2 randomised controlled trial. Lancet 2016;387:1837–46. 10.1016/S0140-6736(16)00587-0 - DOI - PubMed
    1. Horn L, Spigel DR, Vokes EE, et al. Nivolumab versus docetaxel in previously treated patients with advanced non-small-cell lung cancer: two-year outcomes from two randomized, open-label, phase III trials (checkmate 017 and checkmate 057). J Clin Oncol 2017;35:3924–33. 10.1200/JCO.2017.74.3062 - DOI - PMC - PubMed
    1. Rittmeyer A, Barlesi F, Waterkamp D, et al. Atezolizumab versus docetaxel in patients with previously treated non-small-cell lung cancer (oak): a phase 3, open-label, multicentre randomised controlled trial. Lancet 2017;389:255–65. 10.1016/S0140-6736(16)32517-X - DOI - PMC - PubMed

Publication types

MeSH terms

Substances