. 2023 Mar 17;10(3):ENEURO.0007-22.2023.
doi: 10.1523/ENEURO.0007-22.2023. Print 2023 Mar.

Synthetic Data Resource and Benchmarks for Time Cell Analysis and Detection Algorithms

Affiliations

Synthetic Data Resource and Benchmarks for Time Cell Analysis and Detection Algorithms

Kambadur G Ananthamurthy et al. eNeuro. .

Abstract

Hippocampal CA1 cells take part in reliable, time-locked activity sequences in tasks that involve an association between temporally separated stimuli, in a manner that tiles the interval between the stimuli. Such cells have been termed time cells. Here, we adopt a first-principles approach to comparing diverse analysis and detection algorithms for identifying time cells. We generated synthetic activity datasets using calcium signals recorded in vivo from the mouse hippocampus using two-photon (2-P) imaging, as template response waveforms. We assigned known, ground truth values to perturbations applied to perfect activity signals, including noise, calcium event width, timing imprecision, hit trial ratio and background (untuned) activity. We tested a range of published and new algorithms and their variants on this dataset. We find that most algorithms correctly classify over 80% of cells, but have different balances between true and false positives, and different sensitivity to the five categories of perturbation. Reassuringly, most methods are reasonably robust to perturbations, including background activity, and show good concordance in classification of time cells. The same algorithms were also used to analyze and identify time cells in experimental physiology datasets recorded in vivo and most show good concordance.


Conflict of interest statement

The authors declare no competing financial interests.

Figures
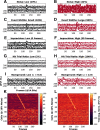
Figure 1.
Figure 1.
Key features of synthetic datasets. Left, Black panels, Low range of features. Right, Red panels, High range of features. A, Noise = 10%. B, Noise = 42%. C, Event width: 10th percentile +/− 1 SD. D, Event width 90th percentile +/1 SD. E, Imprecision at 0 frames FWHM. F, Imprecision at 50 frames FWHM. G, Hit trial ratio from 0% to 2%. H, Hit trial ratio from 0% to 100%. I, J, Background activity with the number of background spikes per background sampled from a Poisson distribution for with mean (λ), for I: λ = 0.5 (low), and J: λ = 2.0 (high). K, L, Trial-averaged Calcium traces from example synthetic datasets of 135 neurons, displayed as heatmap sorted by time of peak Ca signal. K, Baseline physiology synthetic data trial-average with 10% noise (low) and high background activity (λ = 2 to 3 events/trial). L, Same as K with 42% noise (high) and comparable background activity (λ = 2 to 3 events/trial). In both cases, 50% of the cells (top 67) are time cells and the remainder are not. Extended Data Figure 1-1 describes the most important parameters modulated for datasets in each of the three parameter regimes, “Unphysiological,” “Canonical,” and “Physiological,” along with the false positives and false negatives, for each of the 10 implemented algorithms.
Figure 2.
Figure 2.
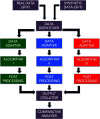
A schematic representation of the analysis pipeline. Physiology data as well as synthetic data were analyzed by 10 different implemented algorithms and the output was collated for comparative benchmarks.
Figure 3.
Figure 3.
Schematic representation of the implemented algorithms, involving four different scoring methods followed by a classification step (bootstrapping or Otsu’s automatic threshold) to have 10 complete time cell detection algorithms.
Figure 4.
Figure 4.
Base scores for different methods differ in their distributions but all have good predictive power. Scores for top (blue): time cells; bottom (red): other cells, across A, tiMean; B, tiBase; C, r2bBase; D, peqBase. E, Pairwise correlation coefficients between the distributions of analog scores (pooling time cells and other cells) by each of the four scoring methods. F, Receiver-operator characteristic (ROC) curves after generalized linear regression using the respective distributions of scores and comparisons with known ground truth. G, H, Trial-averaged calcium activity traces for cells classified as G, time cells; H, other cells.
Figure 5.
Figure 5.
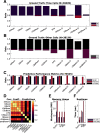
Good predictive performance by all algorithms. A, B, Classification performance of each of the 10 implemented detection algorithms. A, True positives (TP; purple), false positives (FP; red). B, True negatives (TN; black), false negatives (FN; purple). C, Predictive performance metrics [Recall = TP/(TP + FN), Precision = TP/(TP + FP), and F1 Score = Harmonic mean of Recall and Precision] to consolidate the confusion matrices. D, Pairwise correlation coefficients between the Boolean prediction lists by each of the 10 detection algorithms. Note that the first six methods correlate strongly. E, Average memory usage per dataset by the implemented algorithms on datasets with either 67 cells (purple) or 135 cells (red). F, Average runtimes per dataset by the implemented algorithms on datasets with either 67 cells (purple) or 135 cells (red).
Figure 6.
Figure 6.
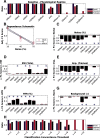
Physiological sensitivity analysis and concordance. A, Classification performance scores for all algorithms with the baseline physiology synthetic datasets (N = 6750 cells). The first five methods perform well. Peq does poorly by all measures when confronted with physiology-range activity variability. Otsu’s threshold method for score classification also does not work well for any method under physiological conditions. B, Dependence of F1 score on noise as a schematic. This has an overall negative slope (dashed line) which was used for panel C, TI-both. A similar calculation was performed for each method. Panels C–G, Parameters were systematically modulated one at a time with respect to baseline and the impact on classification score for each algorithm was estimated by computing the slope, using repeats over 10 datasets each with an independent random seed. Significant dependence on the perturbing parameter was determined by testing whether the slope differed from 0 at p < 0.01, indicated by asterisks using the MATLAB function coefTest(). Plotted here are bar graphs with mean and error as RMSE normalized by the square root of N (N = 10 datasets). C, Dependence on noise %. D, Dependence on event width percentiles. E, Dependence on imprecision frames. F, Dependence on hit trial ratio (HTR; %). G, Background activity (Poisson distribution mean, λ). H, Classification performance using concordance for a range of classification thresholds. Extended Data Figure 6-1 describes the three-point line plot dependency curves for the F1 score for each of the implemented algorithms against each of the five main parameters modulated, as the mean of N = 10 datasets for each case, with error bars as SD. Extended Data Figure 6-2 showcases the linear regression fits for the same, with 95% prediction intervals (PIs), used to estimate the slopes of the various dependency curves.
Figure 7.
Figure 7.
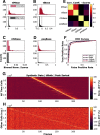
Analysis of experimental 2-P recordings of Ca2+ signals. A–D, Histograms of scores for physiologically recorded in vivo calcium activity from hippocampal CA1 cells (total N = 1759), by (A) tiMean, (B) tiBase, (C) r2bBase, and (D) peqBase. E, Pairwise correlation coefficients between the distributions of analog scores by the four scoring methods. F, Pairwise correlation coefficients between the Boolean prediction lists by the 10 detection algorithms. G, Numbers of positive class (time cell) predictions by each of the detection algorithms. H, I, Trial-averaged calcium activity traces for (H) time cells and (I) other cells. LED conditioned stimulus (CS) is presented at frame number 116, as seen by the bright band of the stimulus artifact. Most cells classified as time cells are active just after the stimulus. There is a characteristic broadening of the activity peak for classified time cells at longer intervals after the stimulus. Some of the cells at the top of panel H may be false positives because their tuning curve is very wide or because of picking up the stimulus transient. Similarly, some of the cells in the middle of panel I may be false negatives because of stringent cutoffs, although they appear to be responsive to the stimulus.
Figure 8.
Figure 8.
Spider plot summary. Relative sensitivity of the six best detection algorithms (tiMean, tiBoot, tiBoth, r2bMean, r2bBoth, and peq) to the five main parameters for data variability, noise (%), event widths (%ile), imprecision (frames), hit trial ratio (%), and background activity (λ). A perfect algorithm would have very small values (i.e., low sensitivity) for each of the parameters and, thus, occupy only the smallest pentagon in the middle. Note that even the maximal absolute value of sensitivity for most parameters (outer perimeter) is quite small, indicated in boxes at the points of the spider plot.

References

    1. Abbasi S, Maran S, Jaeger D (2020) A general method to generate artificial spike train populations matching recorded neurons. J Comput Neurosci 48:47–63. 10.1007/s10827-020-00741-w - DOI - PMC - PubMed
    1. Ahmed MS, Priestley JB, Castro A, Stefanini F, Solis Canales AS, Balough EM, Lavoie E, Mazzucato L, Fusi S, Losonczy A (2020) Hippocampal network reorganization underlies the formation of a temporal association memory. Neuron 107:283–291.e6. 10.1016/j.neuron.2020.04.013 - DOI - PMC - PubMed
    1. Aronov D, Tank DW (2014) Engagement of neural circuits underlying 2D spatial navigation in a rodent virtual reality system. Neuron 84:442–456. 10.1016/j.neuron.2014.08.042 - DOI - PMC - PubMed
    1. Bhalla US (2017) Synaptic input sequence discrimination on behavioral timescales mediated by reaction-diffusion chemistry in dendrites. Elife 6:e25827. 10.7554/eLife.25827 - DOI - PMC - PubMed
    1. Bhatia A, Moza S, Bhalla US (2021) Patterned optogenetic stimulation using a DMD projector. Methods Mol Biol 2191:173–188. 10.1007/978-1-0716-0830-2 - DOI - PubMed

Publication types

LinkOut - more resources