. 2023 Feb 23;10(1):111.
doi: 10.1038/s41597-023-02008-2.

Global Dam Tracker: A database of more than 35,000 dams with location, catchment, and attribute information

Affiliations

Global Dam Tracker: A database of more than 35,000 dams with location, catchment, and attribute information

Alice Tianbo Zhang et al. Sci Data. .

Abstract

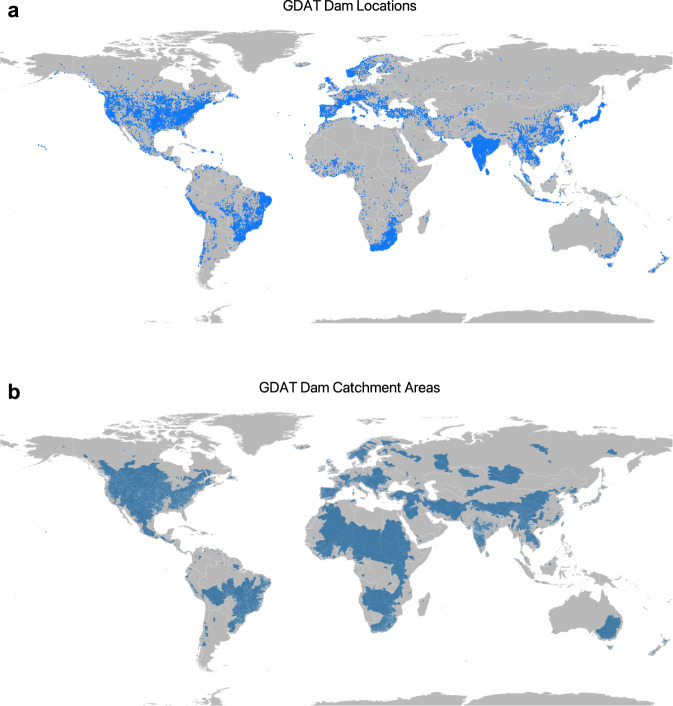
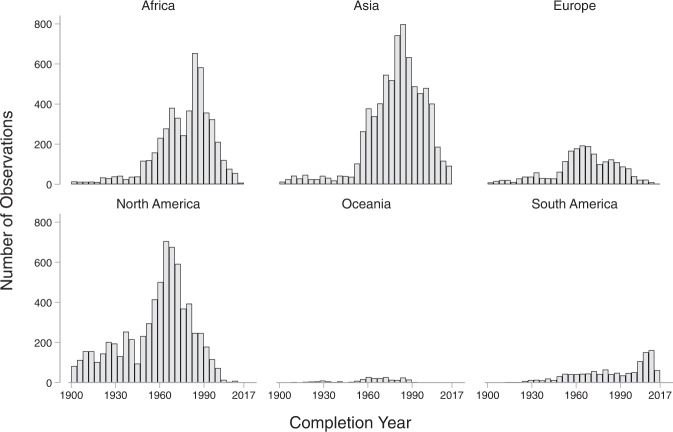
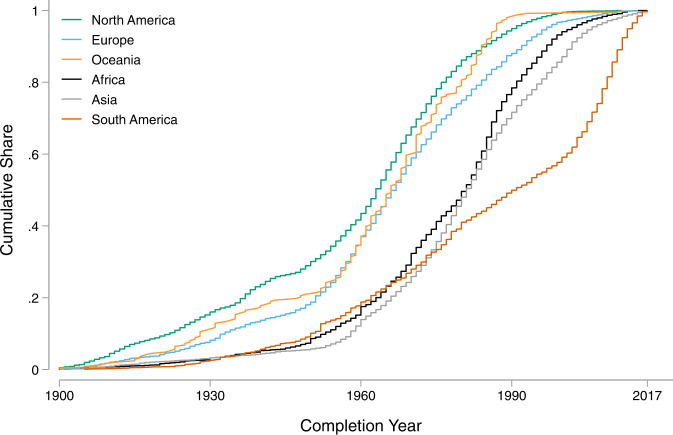
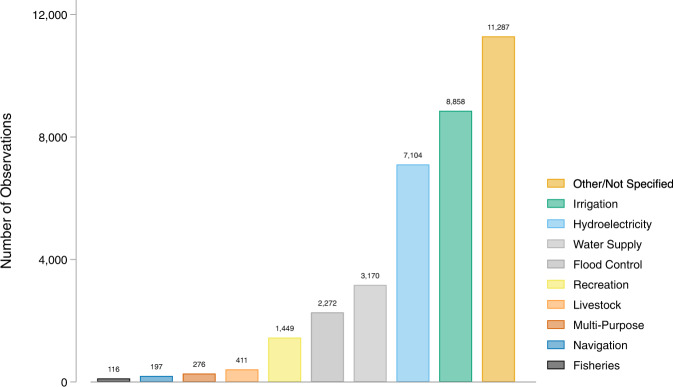
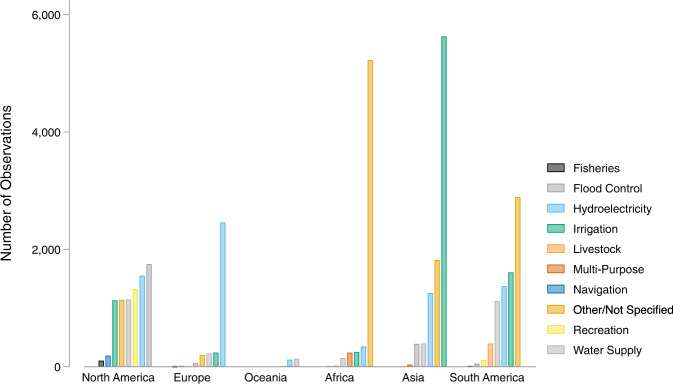
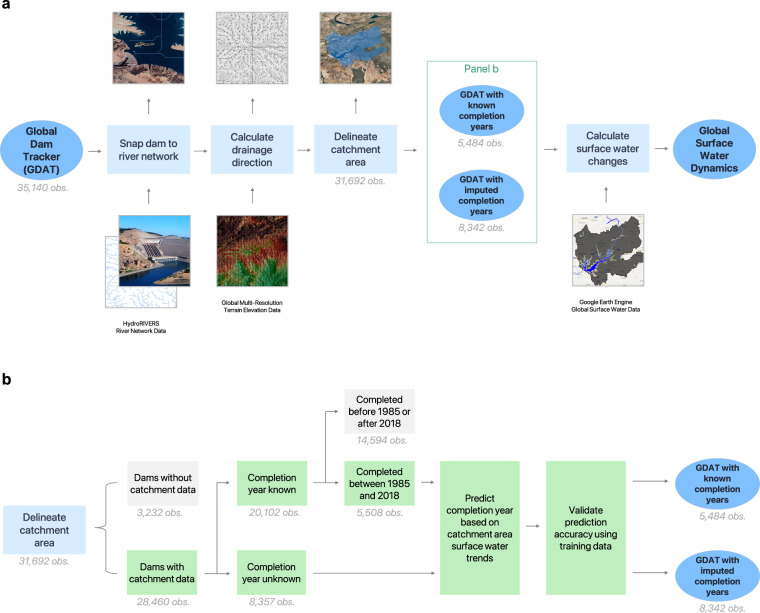
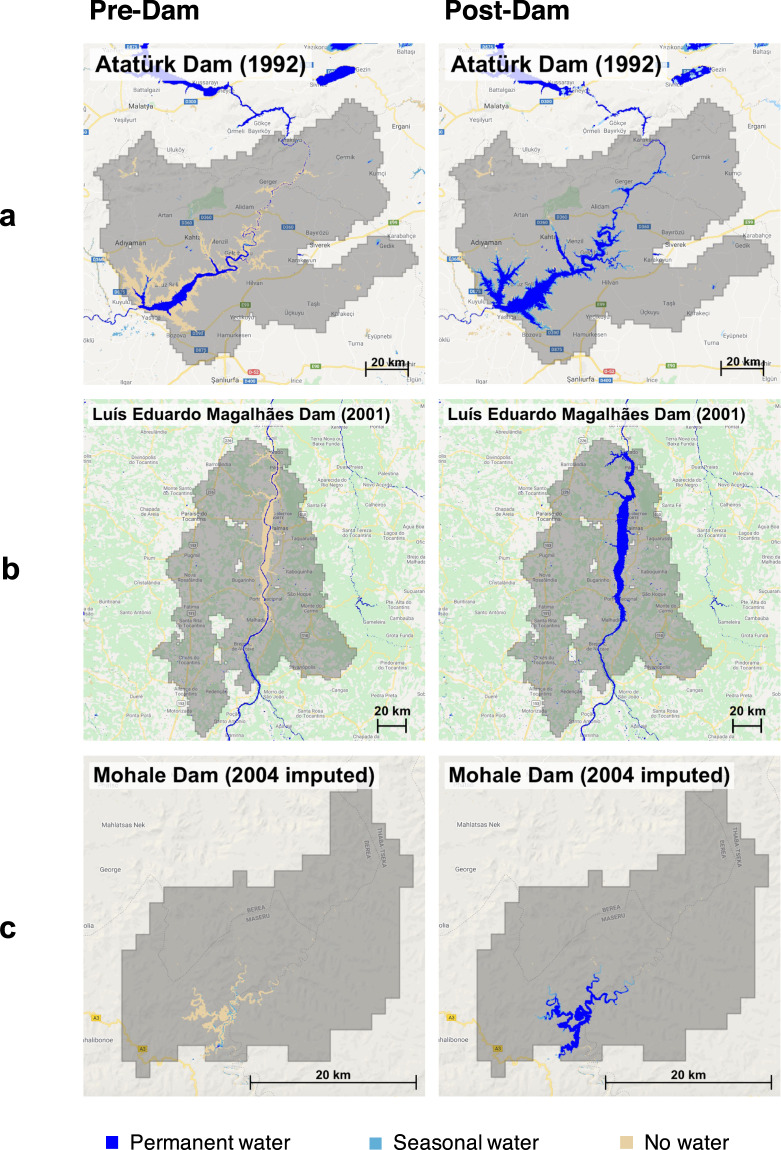
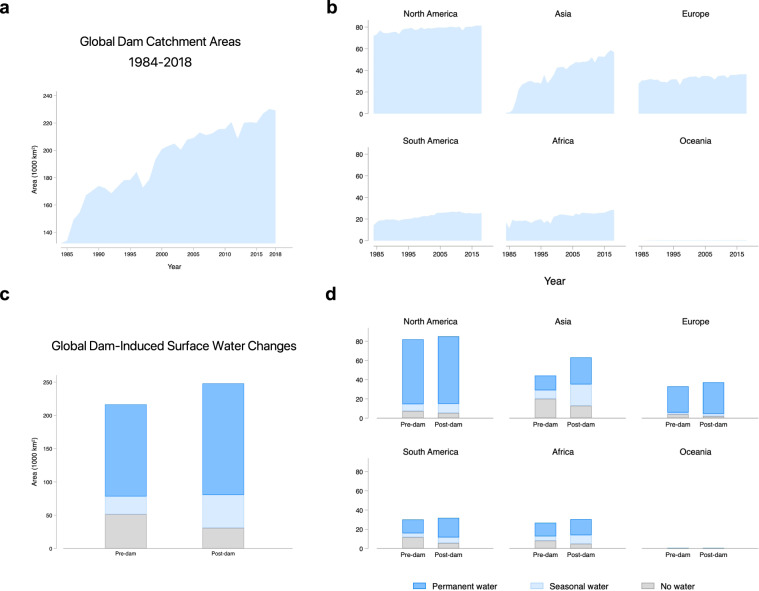
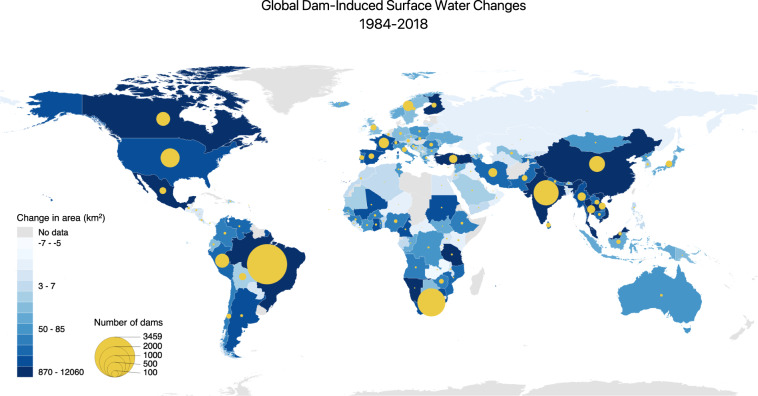
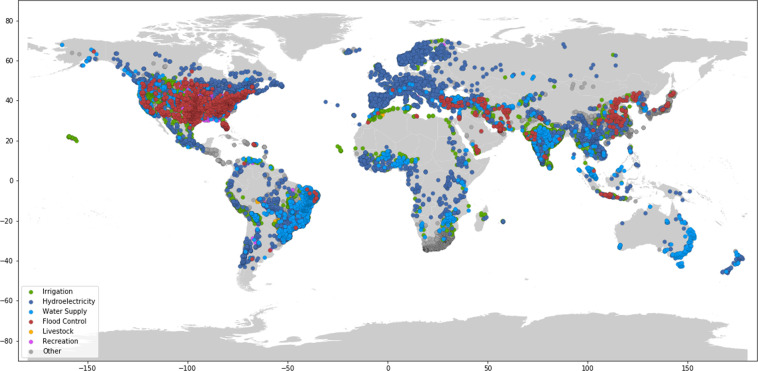
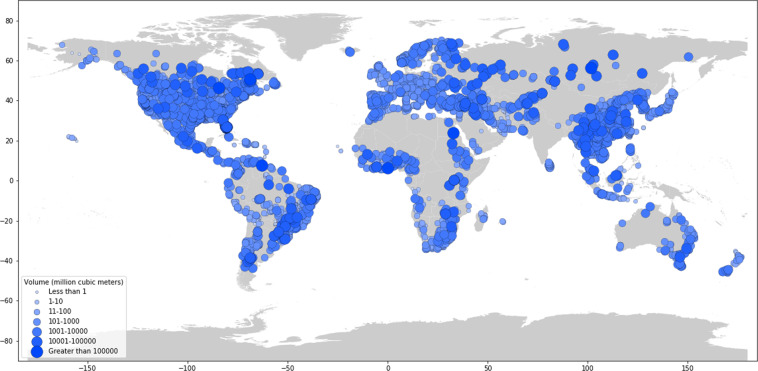
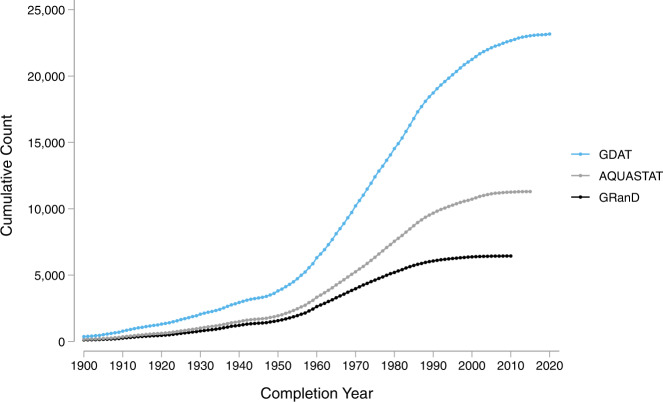
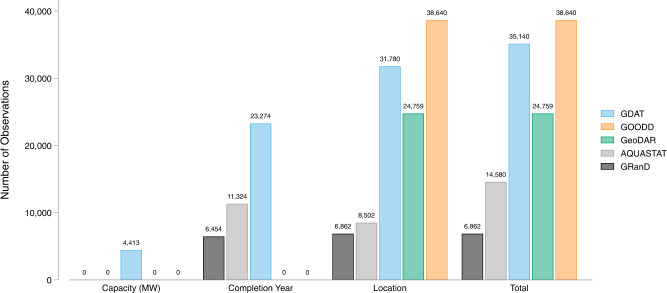
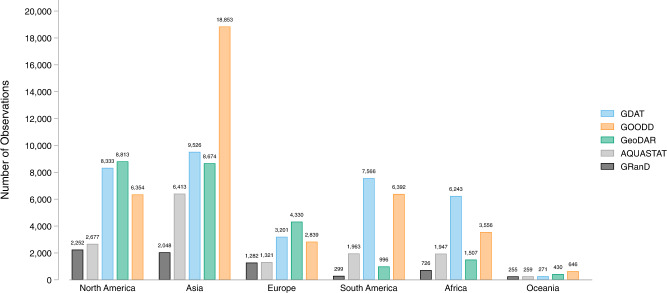
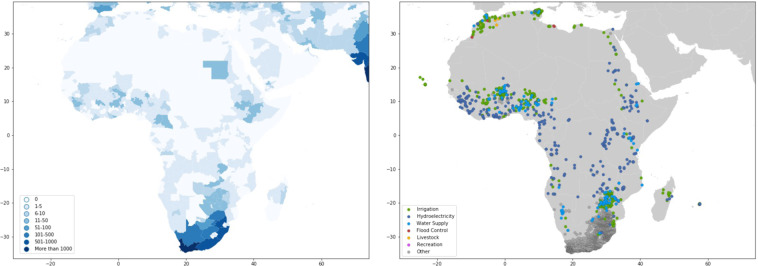
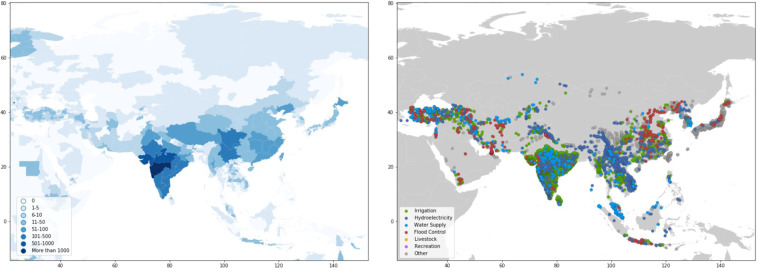
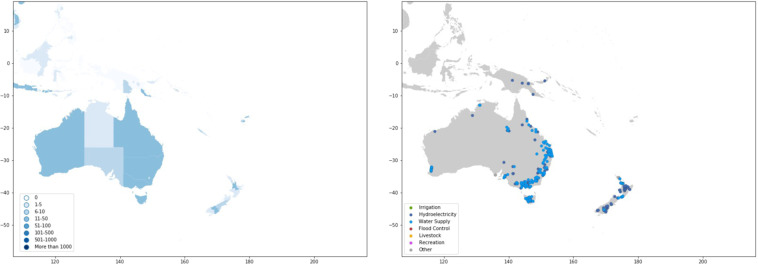
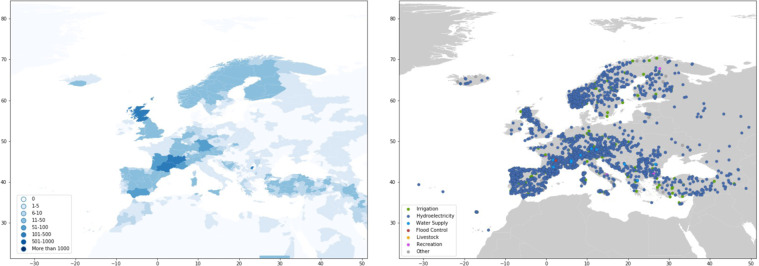
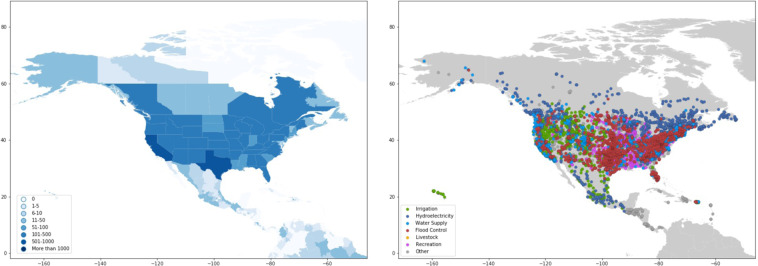
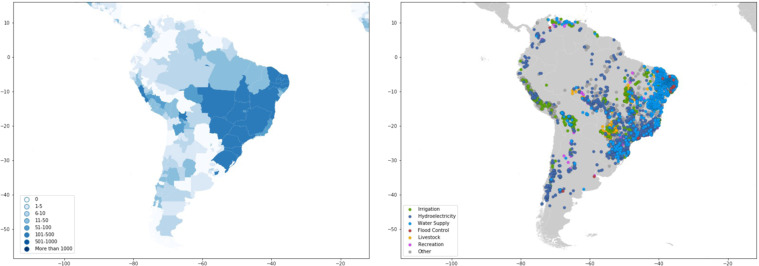
We present one of the most comprehensive geo-referenced global dam databases to date. The Global Dam Tracker (GDAT) contains 35,000 dams with cross-validated geo-coordinates, satellite-derived catchment areas, and detailed attribute information. Combining GDAT with fine-scaled satellite data spanning three decades, we demonstrate how GDAT improves upon existing databases to enable the inter-temporal analysis of the costs and benefits of dam construction on a global scale. Our findings show that over the past three decades, dams have contributed to a dramatic increase in global surface water coverage, especially in developing countries in Asia and South America. This is an important step toward a more systematic understanding of the worldwide impact of dams on local communities. By filling in the data gap, GDAT would help inform a more sustainable and equitable approach to energy access and economic development.


Conflict of interest statement

The authors declare no competing interests.

Figures

Fig. 1
Fig. 1
Map of dams in the Global Dam Tracker database. (a) Locations of all dams in the GDAT database, with each dam represented by a blue point. Large concentrations of dams can be found in the United States, Brazil, India, South Africa, Europe, and East and Southeast Asia. (b) The catchment area of dams delineated using drainage flow directions.
Fig. 2
Fig. 2
Distribution of dam completion year by continent.
Fig. 3
Fig. 3
Cumulative distribution of dam completion year by continent.
Fig. 4
Fig. 4
Distribution of main purpose of dams in GDAT – Overall.
Fig. 5
Fig. 5
Distribution of main purpose of dams in GDAT – By continent.
Fig. 6
Fig. 6
Conceptual diagram of the algorithm. We develop an algorithm to estimate the changes in global surface water from dam construction. (a) To calculate the difference in surface water coverage before and after dams are built, we snap each dam to a river network to correct for its location, calculate the drainage direction, and delineate its catchment area. (b) Procedures for imputing the completion years of dams when the information is missing. This allows the analysis of surface-water changes to be expanded beyond dams with known completion years.
Fig. 7
Fig. 7
Change in surface water coverage for three exemplary dams. Dam completion year in parenthesis. (a) Construction for Ataturk Dam in Turkey was completed in 1990 and the reservoir was filled in 1992. A comparison of the pre-dam (left) and post-dam (right) images show a clear increase in water pixels after the completion, a total increase of 983,482 km2. The pre-dam image exhibits a partially filled reservoir, demonstrating that large dams may take an extended time to fill. (b) Luis Eduardo Magalhaes Dam in Brazil was completed in 2001. The formerly free-flowing section of the river is visible in the pre-dam image, while the dam flooded an area of 660,130.5 km2. (c) Mohale Dam in Lesotho, with an imputed completion year of 2004, illustrates the logic behind our imputation procedure. The actual year of construction is 2002, and the dam was formally commissioned in 2003–4. After completion, the dam flooded an area of 15,884.5 km2.
Fig. 8
Fig. 8
Summary of changes in water coverage around global dam catchments between 1984 and 2018. (a) Global cumulative increase in water-covered area (seasonal + permanent) within dam catchments. (b) Cumulative increase by continent. (c) Cumulative increase by pixel category for pre- and post-dam periods, showing an increase in permanent- and seasonal-water pixels by around 50,000 km2 and a decrease in no-water pixels. (d) Dam-induced surface water changes by continent.
Fig. 9
Fig. 9
Surface water change in global dam catchments between 1984 and 2018 by country. The largest increase in surface water coverage are in developed and rapidly developing countries with significant dam counts, such as Brazil, Canada, China, India, the United States, Mexico, Turkey, and various Southeast Asian countries. The data captures changes in the median surface water pixel counts between pre- and post-construction periods within dam catchment areas. In addition to dam construction, a portion of the surface water changes in some countries, especially those in Asia, could be attributed to improvements in satellite data quality.
Fig. 10
Fig. 10
Map of Global Dam Tracker (GDAT) database – Global dams by location and main purpose.
Fig. 11
Fig. 11
Map of Global Dam Tracker (GDAT) database – Global dams by reservoir capacity.
Fig. 12
Fig. 12
Cumulative count of dams by completion year – GDAT vs. other databases.
Fig. 13
Fig. 13
Comparison between GDAT and other databases – Availability of dam attributes.
Fig. 14
Fig. 14
Comparison between GDAT and other databases – Dam count by continent.
Fig. 15
Fig. 15
Comparison between GDAT and GOODD catchment areas. GDAT covers a total catchment areas of 44.88 million km2, while GOODD covers a total of 46.77 million km2. Catchment areas from GDAT and GOODD have 32.85 million km2 of overlap.
Fig. 16
Fig. 16
GDAT Africa – Number and main purpose of dams by location. Many major river basins throughout Africa are heavily dammed, such as the Nile, Western African rivers (Niger, Volta, Senegal), and Southern African rivers (Zambezi, Limpopo). South Africa shows a particularly high concentration of dams, in part due to better data accessibility.
Fig. 17
Fig. 17
GDAT Asia – Number and main purpose of dams by location. For Asia, high concentrations of dams exist in major river basins such as the Mekong, Yangtze, Yellow, and Tigris/Euphrates, as well as in many regions such as the Indian subcontinent, Indochinese peninsula, Java, Japan, the Korean peninsula, and the Anatolian peninsula. Many of these regions are home to rapidly developing economies with a high population density.
Fig. 18
Fig. 18
GDAT Oceania – Number and main purpose of dams by location. On the Australian mainland, dams are mostly concentrated in the Eastern region, along the Great Dividing Range. Significant numbers of dams are also present in Tasmania, as well as on the islands of New Zealand.
Fig. 19
Fig. 19
GDAT Europe – Number and main purpose of dams by location. For Europe, the high frequency of hydroelectric dams is due to the large number of observations supplied by the World Resources Institute Global Power Plant database. Significant concentrations of dams are present in the Iberian peninsula, Southern France, the Alps, Scotland, and Southern Norway.
Fig. 20
Fig. 20
GDAT North America – Number and main purpose of dams by location. Data for the United States mainly come from USGS, with small dikes and non-dam structures removed from the database. In Canada, most dams are concentrated closer to the southern border, with Quebec having a high concentration of hydroelectric dams. Central Mexico also contains a high concentration of dams.
Fig. 21
Fig. 21
GDAT South America – Number and main purpose of dams by location. The Amazon basin is home to several large dams, while the highest concentration of dams can be found in the eastern and southeastern regions of the country. The Andes also contain many dams, particularly in Peru and central Chile.

References

    1. IEA. Renewables 2020. Tech. Rep., IEA (2020).
    1. IEA. Electricity Information: Overview. Tech. Rep., IEA (2021).
    1. Gernaat DEHJ, Bogaart PW, van Vuuren DP, Biemans H, Niessink R. High-resolution assessment of global technical and economic hydropower potential. Nature Energy. 2017;2:821–828. doi: 10.1038/s41560-017-0006-y. - DOI
    1. Zarfl C, Lumsdon AE, Berlekamp J, Tydecks L, Tockner K. A global boom in hydropower dam construction. Aquat. Sci. 2015;77:161–170. doi: 10.1007/s00027-014-0377-0. - DOI
    1. Couto TBA, Olden JD. Global proliferation of small hydropower plants - science and policy. Front. Ecol. Environ. 2018;16:91–100. doi: 10.1002/fee.1746. - DOI