. 2023 Feb 23;6(1):215.
doi: 10.1038/s42003-023-04571-1.

MacroH2A histone variants modulate enhancer activity to repress oncogenic programs and cellular reprogramming

Affiliations

MacroH2A histone variants modulate enhancer activity to repress oncogenic programs and cellular reprogramming

Wazim Mohammed Ismail et al. Commun Biol. .

Abstract

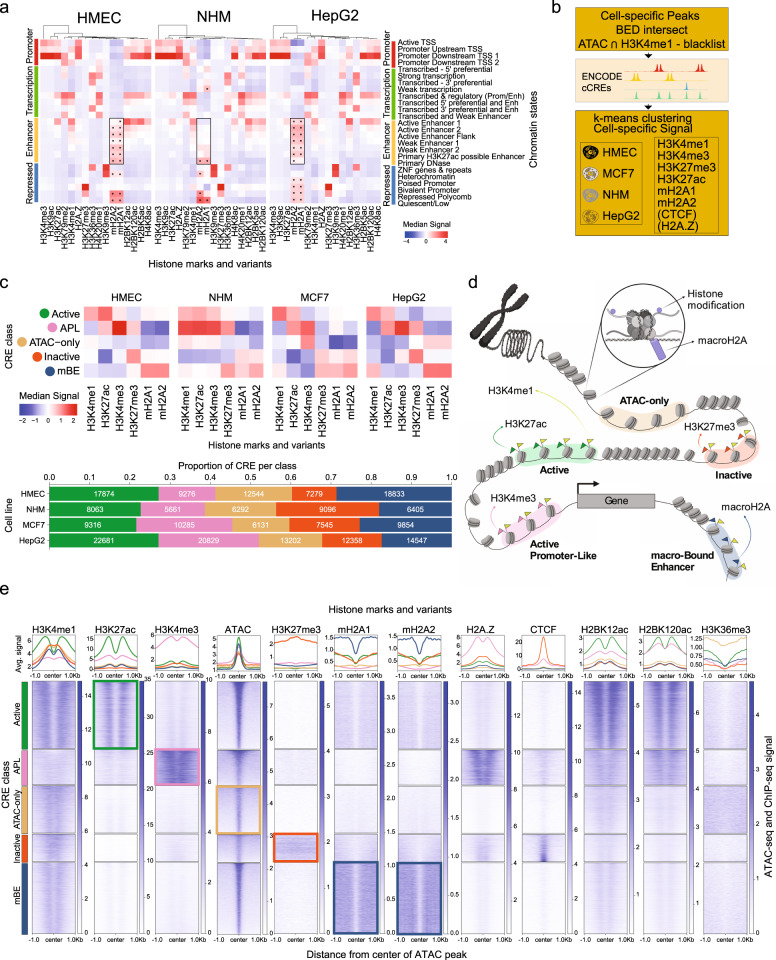
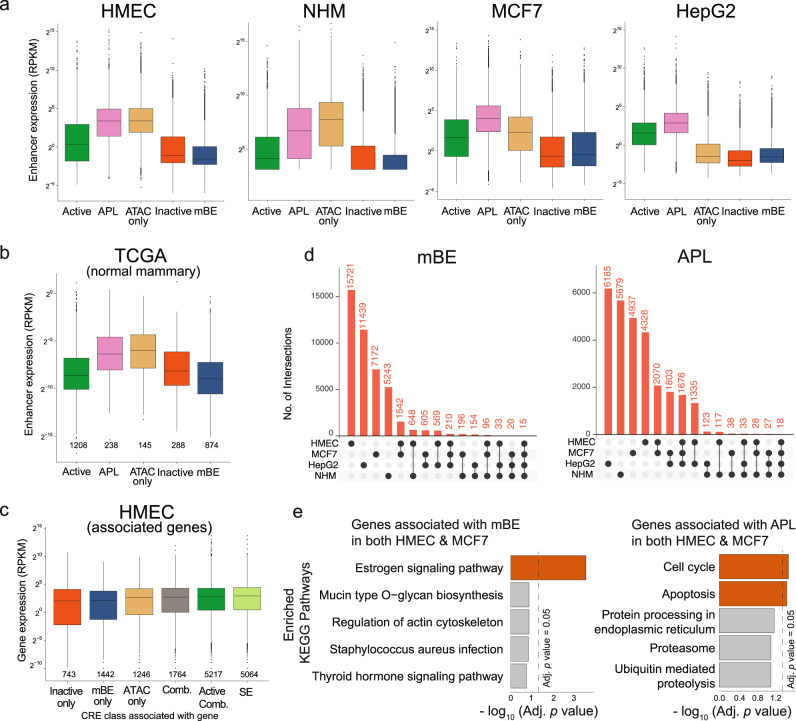
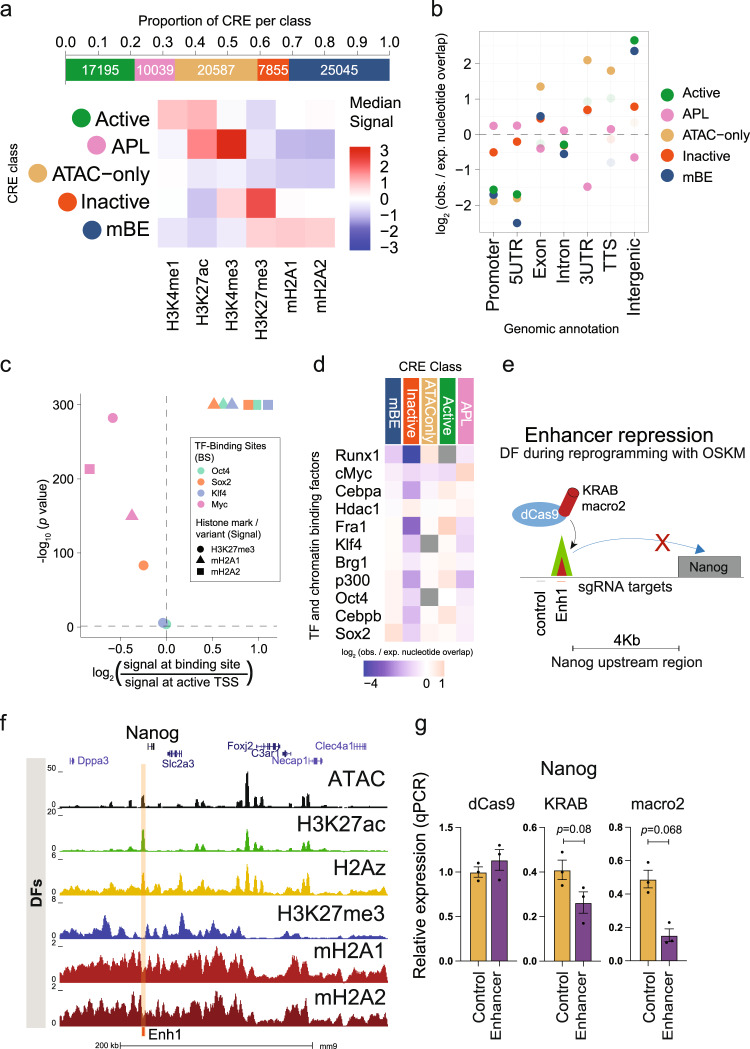
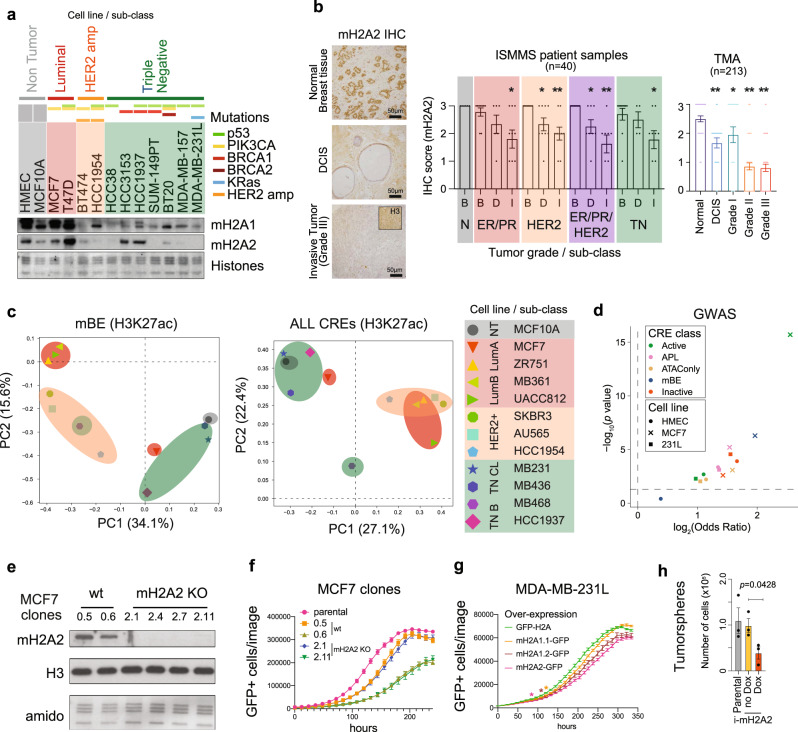
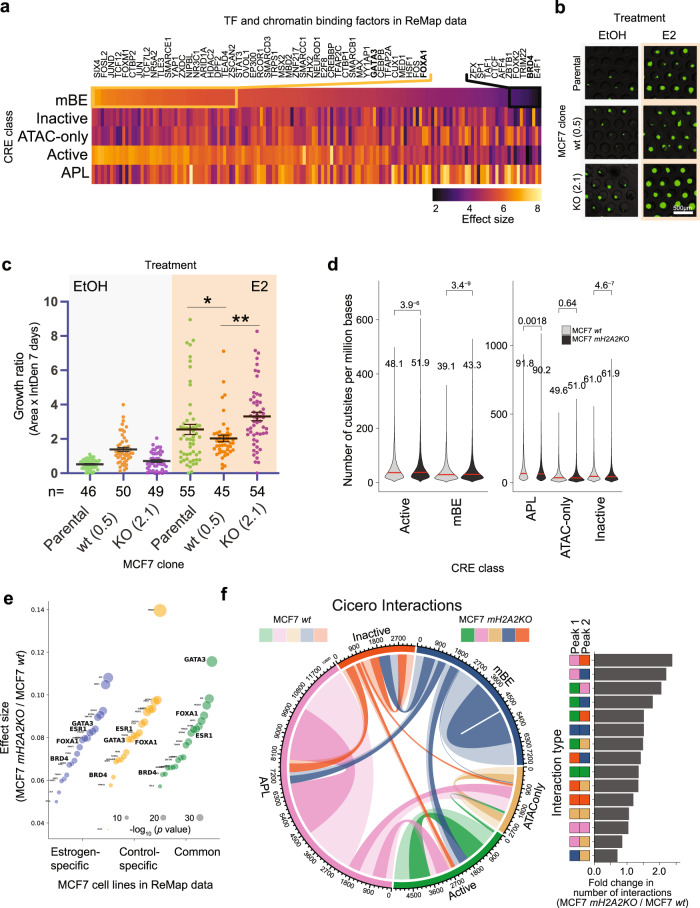
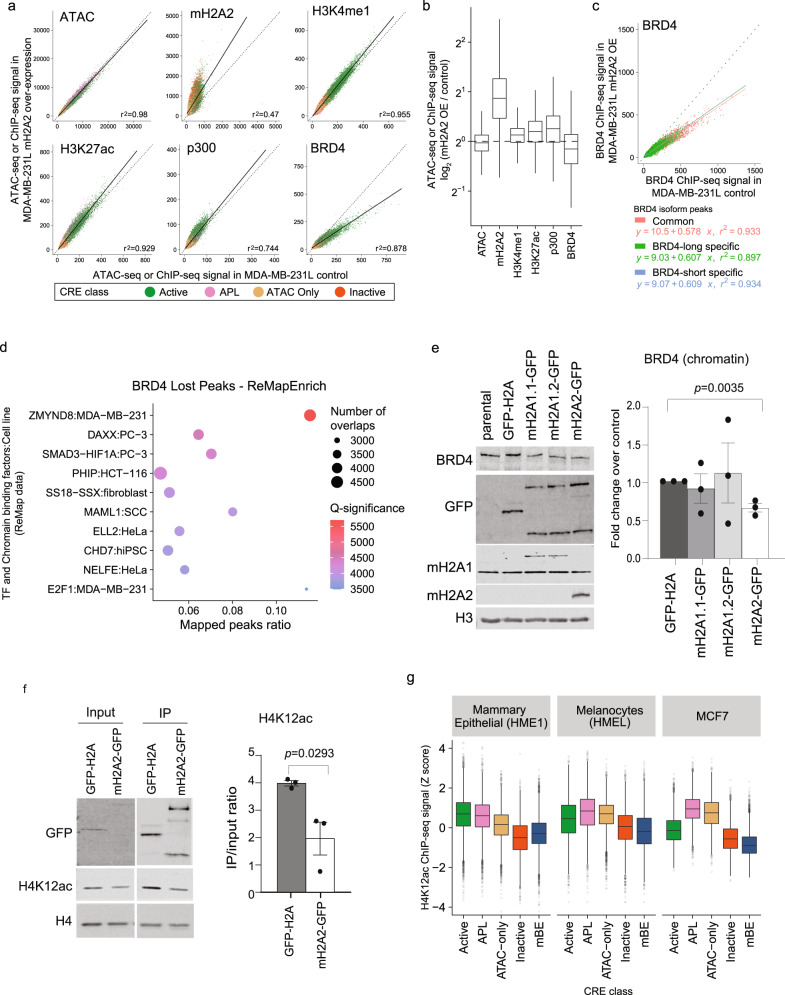
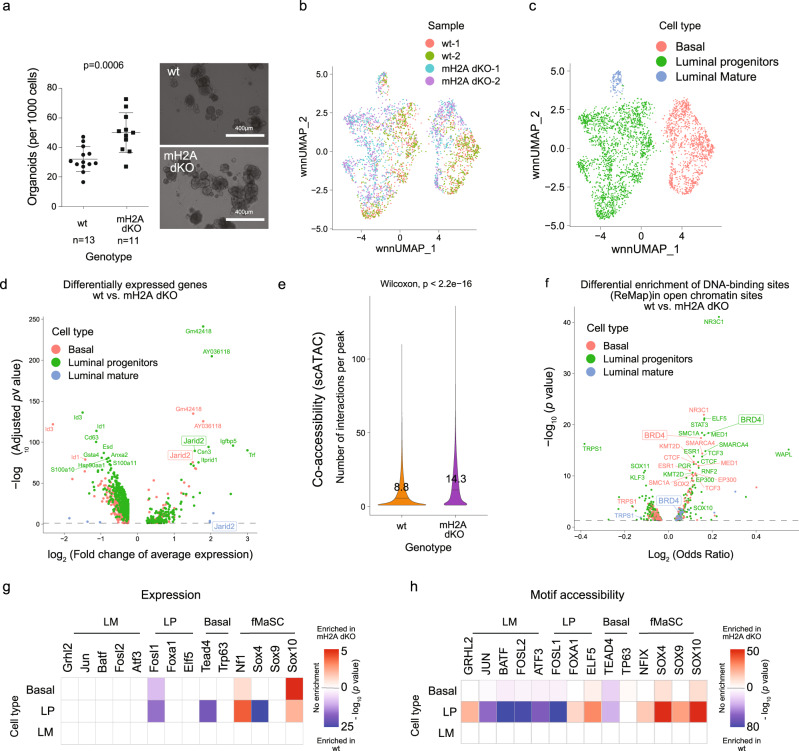
Considerable efforts have been made to characterize active enhancer elements, which can be annotated by accessible chromatin and H3 lysine 27 acetylation (H3K27ac). However, apart from poised enhancers that are observed in early stages of development and putative silencers, the functional significance of cis-regulatory elements lacking H3K27ac is poorly understood. Here we show that macroH2A histone variants mark a subset of enhancers in normal and cancer cells, which we coined 'macro-Bound Enhancers', that modulate enhancer activity. We find macroH2A variants localized at enhancer elements that are devoid of H3K27ac in a cell type-specific manner, indicating a role for macroH2A at inactive enhancers to maintain cell identity. In following, reactivation of macro-bound enhancers is associated with oncogenic programs in breast cancer and their repressive role is correlated with the activity of macroH2A2 as a negative regulator of BRD4 chromatin occupancy. Finally, through single cell epigenomic profiling of normal mammary stem cells derived from mice, we show that macroH2A deficiency facilitates increased activity of transcription factors associated with stem cell activity.


Conflict of interest statement

The authors declare no competing interests.

Figures

Fig. 1
Fig. 1. Characterization of macro-Bound Enhancers.
a Heatmaps showing median signal scores of 14 histone marks from the Roadmap reference human epigenomes (imputed ChIP-Seq signal tracks for E119, E059 and E118) and that of histone variants macroH2A.1 and macroH2A.2 (signal tracks from ChIP-Seq experiments), across all genomic regions in the 25-state chromatin models from Roadmap, built for human mammary epithelial cells (HMEC), normal human melanocytes (NHM) and the human hepatocellular carcinoma cell line (HepG2), respectively. All values are centered and scaled along the column direction. Median signal scores of macroH2A variants in the enhancer states are highlighted using a box. MacroH2A variants enrichments that are statistically significant (p < 0.05, one-sided Mann–Whitney U test with Bonferroni correction) are marked with an asterisk. b Outline of algorithm used to classify cell-specific cis-regulatory elements (CRE). c Heatmaps showing median Z scores of the log-normalized input-corrected ChIP-seq signal of 6 histone marks/variants used in classifying the CRE sites in each CRE class (top). Bar plot (bottom) shows the proportion of CRE classes in each cell type. d Illustration showing each CRE class with corresponding marks (histone modifications or variants). e Average signal profile (top) and heatmaps (bottom) of ATAC-seq signal scores, and ChIP-seq signal scores of histone marks and variants around open chromatin regions (defined by ATAC-seq) grouped by the five CRE classes in HMEC.
Fig. 2
Fig. 2. MacroH2A regulates enhancer activity.
a Expression levels at the CRE grouped by the five classes in human mammary epithelial cells (HMEC), normal human melanocytes (NHM), the breast cancer cell line (MCF7) and the human hepatocellular carcinoma cell line (HepG2) quantified by RNA-seq data from ENCODE reference epigenome for HMEC (total), MCF7 (poly-A) and HepG2 (total), and from Fontanals-Cirera et al. for NHM (total). The number of datapoints, n, equals the number of CRE per class shown in Fig. 1c. b Expression levels by RNA-seq from normal breast samples (averaged across 113 samples) from TCGA at enhancers that overlap the annotated CRE in HMEC. The number of datapoints, n, is shown below each box. c Expression levels by RNA-seq from Roadmap reference epigenome (E119) at protein-coding genes directly associated with the CRE from HMEC (associations obtained from GeneHancer) and super-enhancers (annotated using LILY). Inactive only, mBE only and ATAC only: genes associated with only Inactive, mBE or ATAC only classes of CRE respectively; Active Comb: genes associated with at least one Active CRE and possibly other combination of CRE classes; Comb: genes associated with all other combinations of CRE classes; SE: genes associated with those CRE identified as super-enhancers. The number of datapoints, n, is shown below each box. The expression data is represented as boxplots where the middle line represents the median, the lower and upper edges of the rectangle represent the first and third quartiles and the lower and upper whiskers represent the interquartile range (IQR) × 1.5. Outliers beyond the end of the whiskers are plotted individually. d Upset plots showing the intersection of mBE and APL (Active Promoter-Like) CRE loci between the four cell lines. e Top 5 most significant KEGG pathways sorted by Benjamini-Hochberg adjusted p-value of the minimum hypergeometric (mHG) test performed by Cistrome-GO on genes associated with mBE and APL (Active Promoter-Like) common in HMEC and MCF7.
Fig. 3
Fig. 3. MacroH2A is a negative modulator of enhancer activity.
a Proportion of CRE peaks in each CRE class (top) and heatmap (bottom) showing median Z scores of the log-normalized input-corrected ChIP-seq signal of the 6 histone marks/variants used in classifying the CRE peaks in each class in dermal fibroblasts (DF). b Genomic region enrichment of the CRE peaks in each class as calculated by GAT (enrichments that are statistically significant, Benjamini-Hochberg corrected p-value < 0.05, are shown in darker colors, and the rest in lighter colors). c Volcano plot showing the enrichment of the signals of macroH2A variants and H3K27me3 at the binding sites (BS) of Oct4, Sox2, Klf4 and cMyc (48 h after OSKM induction, binding sites data collected from Chronis et al.), relative to the signals at active TSS (AT) regions in dermal fibroblasts (Mann–Whitney U test). Active TSS (AT) regions are defined as 500 bp up- and downstream of the transcription start sites that have RPKM > 1 measured by RNA-seq experiments on dermal fibroblasts. d Enrichment of TF and chromatin binding factors after 48 h of OSKM expression, at CRE sites of DF cells as calculated by GAT, ranked by enrichment in mBE (enrichments that are not statistically significant, Benjamini-Hochberg corrected p-value > 0.05, are shown in gray). e Schematic of enhancer targeting in DF during reprogramming with OSKM using dCas9-KRAB and dCas9-macro2 and sgRNAs complementary to regions around the enhancer site. f UCSC genome browser snapshot of the Klf4 binding site upstream of the Nanog TSS in DF with open chromatin (ATAC-seq), H3K27me3, H3K27ac, H2A.Z, mH2A1 and mH2A2 data. g Nanog relative expression after 96 h of OSKM infection in DFs with dCas9, dCas9-KRAB or dCas9-macro2 (unpaired two tailed student’s t-test, p = 0.068) with sgRNAs targeting the enhancer site upstream of Nanog or control. Data are mean with SE (n = 3).
Fig. 4
Fig. 4. Reactivation of macro-Bound Enhancers associates with oncogenic programs.
a Immunoblot of chromatin extracts were probed for mH2A1 and mH2A2 across a panel of breast cancer cell lines including the three different major sub-types (Luminal, HER2 positive and triple negative), and non-tumorigenic cells (human mammary epithelial cells, HMEC; and immortalized mammary cells MCF10A). Mutational status defined above. Amido Black of core histones used as loading control. b Immunohistochemistry (IHC) from normal breast tissue, ductal carcinoma in situ (DCIS) and grade III invasive tumors for mH2A2. Histone H3 IHC was used as a control (top right). Quantification of mH2A2 scoring for TMA and ISMMS patient samples according to the tumor grade or sub-class (below). B – Benign tissue, D – DCIS, I – Invasive. Column bar represents mean and SE. Unpaired (two tailed) student’s t-test *p < 0.05, **p < 0.005. c Principal component analysis of H3K27ac ChIP-seq signal in HMEC macro-Bound enhancers (left) and all CREs (right) in 12 breast cancer cell lines from Franco et al.. d Volcano plot showing enrichment of breast cancer risk variants from GWAS studies (GWAS p-value < 5 × 10⁻⁸), in each CRE class in HMEC, MCF7 and 231 L cells, enrichment p-value and odds ratio calculated using GARFIELD. e Immunoblots for mH2A2 from chromatin extracts in MCF7 clones. H3 and histones (amido black) used as loading controls. f Proliferation of MCF7 clones (wild type and mH2A2 KO) transduced with H2A-GFP and analyzed by number of GFP cells using Incucyte. Data represented are mean with SE (n = 3). g Proliferation of MDA-MB-231L cells with over-expression of mH2A-GFP constructs (and H2A-GFP as control) determined by the number of GFP positive cells on Incucyte. Data are mean with SD (n = 9). Proliferation of cells over-expressing of mH2A1.1-GFP is significantly lower than control starting at 120 hours, mH2A1.2-GFP at 108 hours and mH2A2-GFP at 84 h (Two-way ANOVA with Dunnett’s multiple comparison test, *p < 0.05). h Tumorsphere formation assessed by number of cells upon mH2A2-GFP induction (Unpaired two tailed student’s t-test, p = 0.0428). Data represented are mean with SE (n = 3).
Fig. 5
Fig. 5. mH2A2 is a negative regulator of estrogen targets.
a Transcription factors and DNA-binding molecules whose binding sites as defined by ChIP-seq peaks from ReMap data for MCF7 cells are significantly enriched (Benjamini-Hotchberg corrected p-value < 0.05) at CRE sites from each CRE class of MCF7 cells (enrichment statistics computed using ReMapEnrich). Effect size is defined as the log (base 10) ratio between the observed and expected number of overlaps. Molecules are ranked by enrichment in mBE. b Representative images of MCF7 spheroids. Scale bar, 500 µm. c Growth ratio of MCF7 3D spheroids after treatment with EtOH and E2 (Estradiol) in microwells after 7 days. Scatter plot of area factored with GFP Intensity Density in individual spheroids. Horizontal bars signify mean values +/− SE (left). Unpaired (two-tailed) student’s t-test *p < 0.05, **p < 0.005. d Violin plots showing the number of cut sites (per million bases) overlapping the five classes of CRE in MCF7 wt and mH2A2KO clones. The number of datapoints, n, equals the number of CRE per class shown in Fig. 1c. e Cohen’s effect size distributions of TF binding sites in mH2A2KO cells compared to wt MCF7 cells, grouped by binding sites found in estrogen- or control-specific cell lines (or both). f Circos chord diagram (left) showing the distribution of interactions between CREs that belong to each pair of CRE classes in MCF7 wt and mH2A2KO cells. Interactions were predicted using Cicero on scATAC-seq data using a threshold of co-accessibility score > 0.1. The width of each chord represents the number of interactions between CRE of each pair of classes. Lighter colors are used to represent wt counts and darker colors to represent mH2A2KO counts. The fold change of number of interactions per interaction type in mH2A2KO over those in wt are shown as a bar plot (right).
Fig. 6
Fig. 6. mH2A2 is a negative regulator of BRD4.
a Scatter plot of input-corrected ChIP-seq signals for mH2A2, H3K4me1, H3K27ac, p300 and BRD4, and ATAC-seq after over-expression of mH2A2 against control over-expression (GFP-H2A) at all CRE (Active, n = 16341; APL, 5194; ATAC-only, 13921; Inactive, 14875 peaks) in MDA-MB-231L cells. APL, Active Promoter-Like. The linear regression line (solid line) is shown along with the line y = x for reference. b Boxplots showing the log2 fold change of input-corrected ChIP-seq signals of each histone mark, histone variant or DNA binding protein in a in mH2A2 over-expression over control over-expression. c Scatter plot of input-corrected ChIP-seq signals for BRD4 after over-expression of mH2A2 against control over-expression (GFP-H2A) at CUT&RUN peaks that are specific to short (n = 2151) and long (n = 27684) isoforms of BRD4, and those that were common to both (n = 21836) (CUT&RUN peaks from Wu et al.) in MDA-MB-231L cells. The linear regression lines for each set of peaks are shown as solid lines along with the line y = x for reference. d Top 10 significantly enriched DNA-binding molecules whose binding sites as defined by ChIP-seq peaks from ReMap are enriched in peaks that lost BRD4 (fold change < 0.5) on over-expression of mH2A2 in MDA-MB-231L cells (enrichment statistics computed using ReMapEnrich). e Immunoblots from chromatin extracts in MDA-MB-231L cells with over-expression of mH2A1-GFP and mH2A2-GFP constructs (and H2A-GFP as control) probed for BRD4, GFP and histone H3 (loading control). Fold change quantification over control (H2A-GFP) after H3 normalization (right). Data represented are mean with SE, n = 3 (t-test). f Representative immunoblots from chromatin extracts in MDA-MB-231L cells with over-expression of mH2A2-GFP and H2A-GFP after MNase immunoprecipitation. Extracts were probed for GFP, H4 and H4K12ac. Quantification of IP over input ration (right). Data represented are mean with SE, n = 3 (t-test). g Boxplots showing the Z scores of the log-normalized input-corrected ChIP-seq signal of histone mark H4K12ac in mammary epithelial cells, melanocytes and MCF7 breast cancer cells. The number of datapoints, n, equals the number of CRE per class shown in Fig. 1c. In all boxplots, the middle line represents the median, the lower and upper edges of the rectangle represent the first and third quartiles and the lower and upper whiskers represent the interquartile range (IQR) × 1.5.
Fig. 7
Fig. 7. Loss of mH2A histone variants in MaSC reveals a proto-oncogenic signature associated with increased Sox10 activity.
a Number of organoids per 100 cells plated from wt and mH2A dKO mouse mammary epithelial cells after 7 days in culture. Data are mean with SD (p = 0.0006, unpaired t-test). b Weighted nearest neighbor (WNN) UMAP plot—combining single cell gene expression and single cell ATAC-seq signals, of mammary stem cells from wild type (n = 1558) and mH2A double KO (n = 1558) (two replicates each). c WNN UMAP plot showing three cell types (Basal, n = 1113; Luminal progenitors, n = 1891; Luminal Mature, n = 112) identified after clustering by graph-based clustering of the combined scRNA-seq and scATAC-seq signals and identifying the cell-types using markers. d Volcano plot showing differentially expressed genes in each cell type tested (separately) using Mann–Whitney U test with Bonferroni correction. e Violin plot showing the number of interactions per open chromatin region in wt (n = 199052) and mH2AdKO (n = 217727) with interactions (co-accessibility score > 0.1) predicted from the scATAC-seq data using Cicero. Mean and p-values shown were obtained by comparing means using Mann–Whitney U test. f Volcano plot showing the differential enrichment of ChIP-seq peaks of DNA binding proteins from ReMap in open chromatin regions in each cell type tested using Fisher’s exact test. Open chromatin regions per cell type were chosen as peaks that had a non-zero number of cut-sites in at least 10% of the cells of that cell type. g Heatmap showing the enrichment of gene expression of transcription factors in each cell-type (enrichment represented by −log10 (p-value) from Mann–Whitney U test with Bonferroni correction on gene expression). h Heatmap showing the motif enrichment of transcription factors in each cell-type (enrichment represented by -log10 (p-value) from Mann–Whitney U test with Bonferroni correction on chromVAR motif enrichment scores). LP luminal progenitors, ER estrogen, fMaSC fetal mammary stem cells, LM luminal mature.

Similar articles

Cited by

References

    1. Levine M. Transcriptional enhancers in animal development and evolution. Curr. Biol. 2010;20:R754–R763. doi: 10.1016/j.cub.2010.06.070. - DOI - PMC - PubMed
    1. Creyghton MP, et al. Histone H3K27ac separates active from poised enhancers and predicts developmental state. Proc. Natl Acad. Sci. USA. 2010;107:21931–21936. doi: 10.1073/pnas.1016071107. - DOI - PMC - PubMed
    1. Calo E, Wysocka J. Modification of enhancer chromatin: what, how, and why? Mol. Cell. 2013;49:825–837. doi: 10.1016/j.molcel.2013.01.038. - DOI - PMC - PubMed
    1. Shlyueva D, et al. Hormone-responsive enhancer-activity maps reveal predictive motifs, indirect repression, and targeting of closed chromatin. Mol. Cell. 2014;54:180–192. doi: 10.1016/j.molcel.2014.02.026. - DOI - PubMed
    1. Dorighi KM, et al. Mll3 and Mll4 facilitate enhancer RNA synthesis and transcription from promoters independently of H3K4 monomethylation. Mol. Cell. 2017;66:568–576 e4. doi: 10.1016/j.molcel.2017.04.018. - DOI - PMC - PubMed

Publication types