. 2023 Feb 23;13(1):3188.
doi: 10.1038/s41598-023-30329-0.

Influence of surface carbon on the performance of cesiated p-GaN photocathodes with high quantum efficiency

Affiliations

Influence of surface carbon on the performance of cesiated p-GaN photocathodes with high quantum efficiency

Jana Schaber et al. Sci Rep. .

Abstract

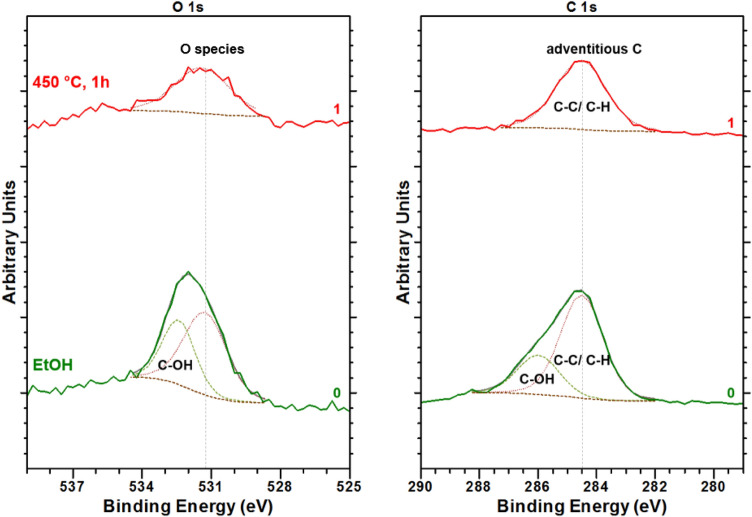
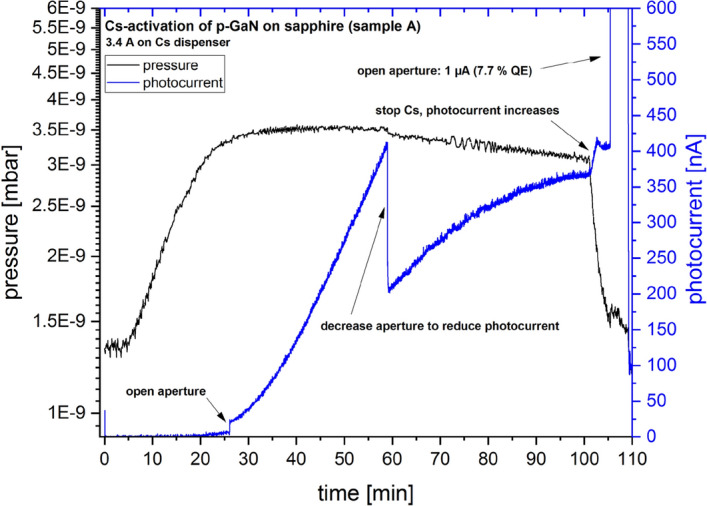
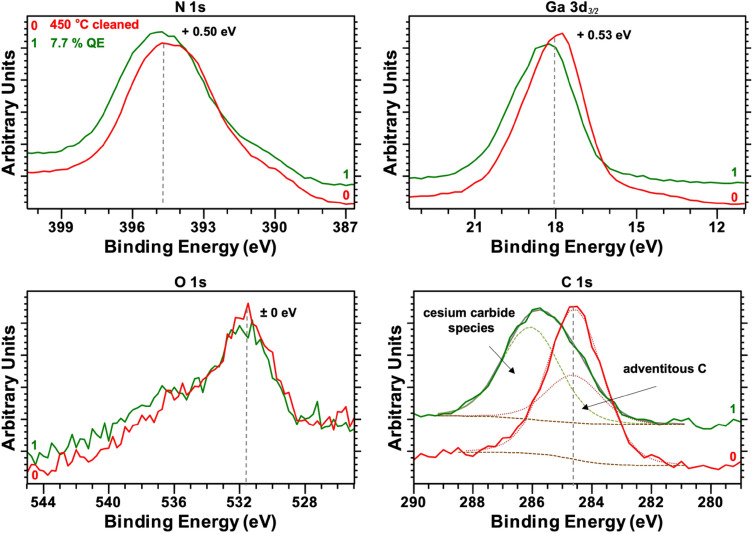
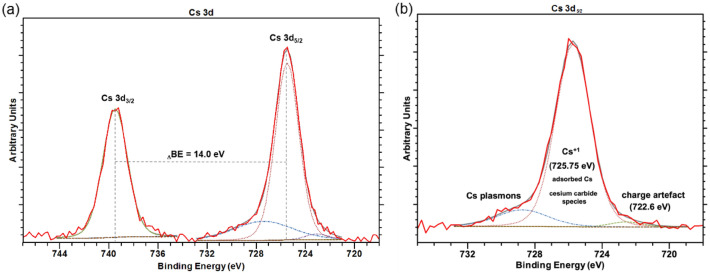
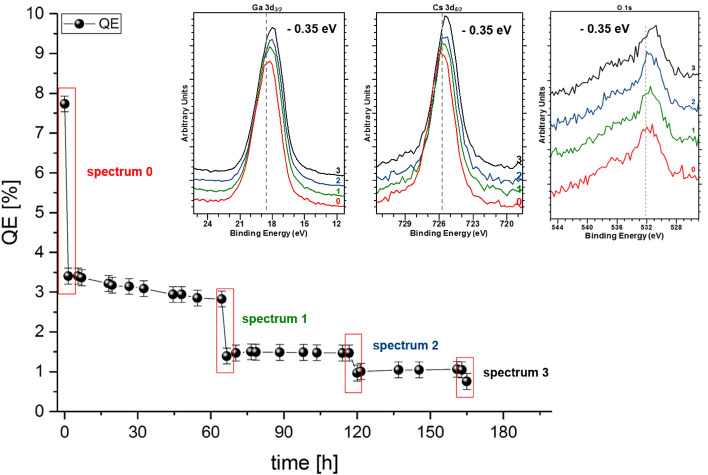
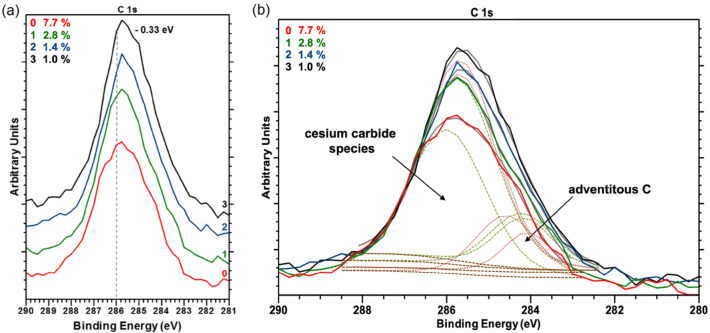
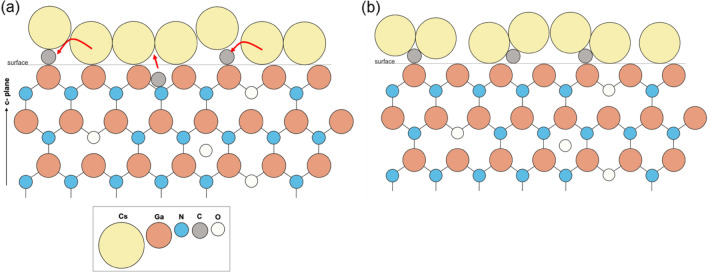
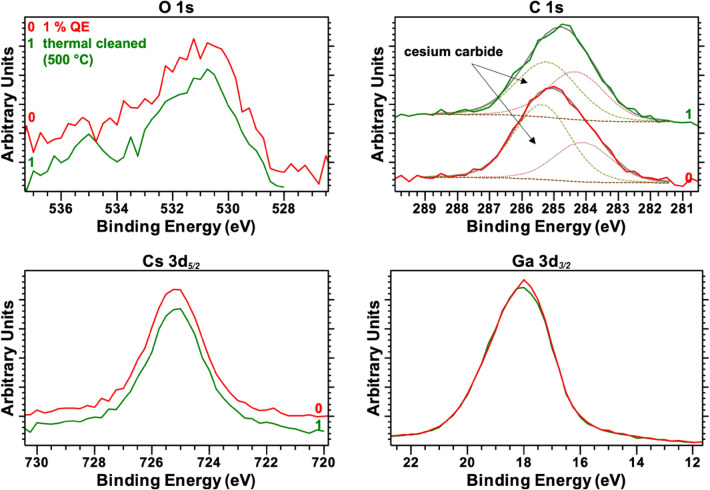
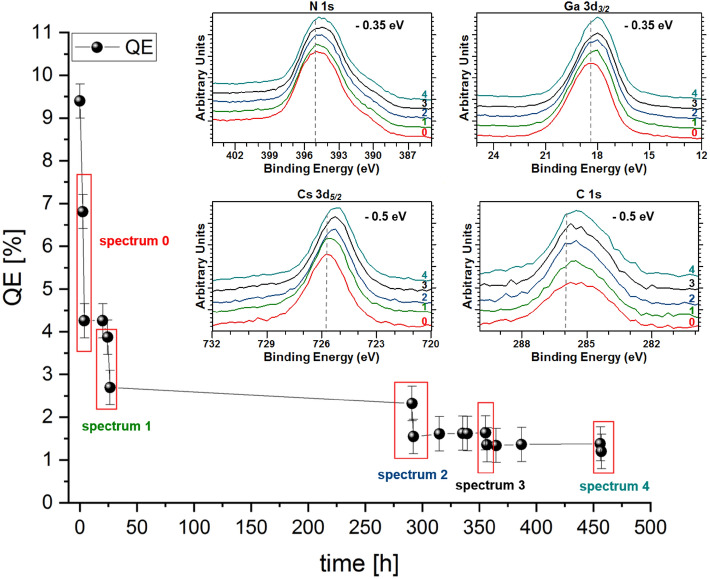
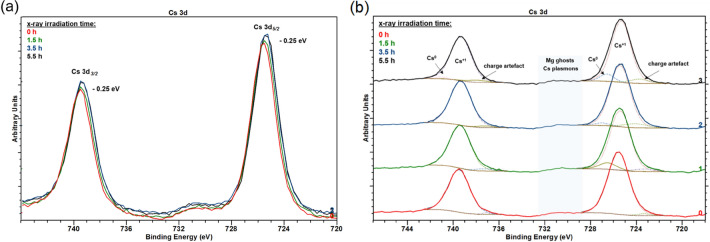
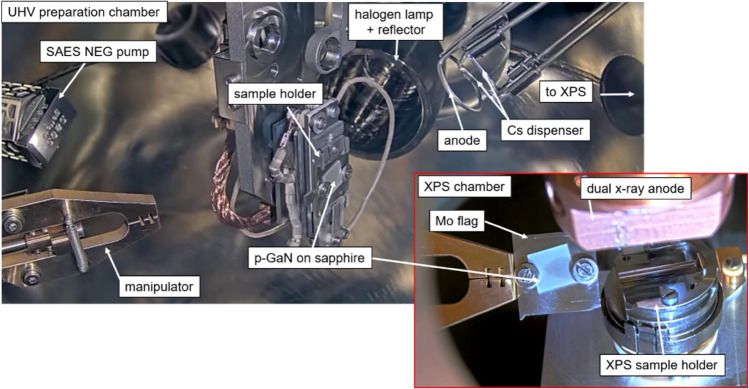
This study shows residual surface carbon's influence on photocathodes' quantum efficiency based on p-GaN grown on sapphire by metal organic chemical vapor deposition. An X-ray photoelectron spectrometer (XPS) built in an ultrahigh vacuum system allowed the in-situ monitoring of the photocathode surface beginning immediately after their cleaning and throughout the activation and degradation processes. An atomically clean surface is necessary to achieve a negative electron affinity, which is the main prerequisite for high quantum efficiency. The p-GaN samples were cleaned with ethanol and underwent a sub-sequential thermal vacuum cleaning. Although carbon and oxygen contaminations are expected to be undesired impurities from the metal organic chemical vapor deposition, which remained on the surface, p-GaN could still form a negative electron affinity surface when exclusively activated with cesium. After the activation with cesium, a shift to a higher binding energy of the photoemission peaks was observed, and a new species, a so-called cesium carbide, was formed, growing over time. The XPS data elucidated the critical role of these cesium carbide species in photocathode degradation. The X-ray damage to the p-GaN:Cs photocathodes, especially the influence on the cesium, was additionally discussed.


Conflict of interest statement

The authors declare no competing interests.

Figures

Figure 1
Figure 1
O 1 s and C 1 s photoelectron spectra for the p-GaN surface cleaned with EtOH (line 0) and after thermal cleaning at 450 °C (line 1). Dashed lines represent the peak fitting of the photoemission peaks.
Figure 2
Figure 2
In-situ photocurrent (blue curve) and vacuum value (black curve, in logarithmic scale) during the Cs activation of the p-GaN surface (sample A).
Figure 3
Figure 3
Ga 3d3/2, N 1 s, O 1 s, and C 1 s photoelectron spectra for the p-GaN surface after thermal cleaning at 450 °C (line 0) and after Cs activation with 7.7% QE (line 1). Dashed lines represent the peak fitting in the C 1 s spectra.
Figure 4
Figure 4
(a) Cs 3d photoemission spectrum of the activated p-GaN surface, showing the spin–orbit splitting at 14 eV and (b) Cs 3d5/2 photoemission spectrum of the adsorbed Cs on the p-GaN surface, with the peak fitting showing three components. The dashed lines represent the peak fitting.
Figure 5
Figure 5
The QE decay of the p-GaN:Cs photocathode (sample A) and the Ga 3d3/2, Cs 3d5/2, and O 1 s photoemission spectra at different times during its decay.
Figure 6
Figure 6
(a) Stacked C 1 s photoemission spectra showing the shift to lower BE along with the degradation of the p-GaN:Cs photocathode (sample A) and (b) the same C 1 s photoemission spectra (normalized to their background) showing the evolution of the cesium carbide (CsxCy) species with peak fittings (dashed lines) along with the degradation.
Figure 7
Figure 7
(a) The surface model of a freshly prepared p-GaN:Cs photocathode. The surface C attracts a part of the Cs and (b) the surface model of an aged p-GaN:Cs photocathode showing the formation of CsxCy.
Figure 8
Figure 8
The Ga 3d3/2, Cs 3d5/2, O 1 s, and C 1 s photoelectron spectra of the p-GaN:Cs surface before (line 0) and after (line 1) renewed thermal cleaning at 500 °C. Dashed lines represent the peak fitting in the C 1 s spectra.
Figure 9
Figure 9
The QE decay curve of the reactivated p-GaN:Cs photocathode (sample A) with the corresponding N 1 s, Ga 3d3/2, Cs 3d5/2, and C 1 s photoemission spectra, taken at different points in the decay curve.
Figure 10
Figure 10
(a) Cs 3d photoelectron spectra for p-GaN:Cs surface (sample D) influenced by the X-ray’s irradiation time and (b) the same Cs 3d spectra of sample D, stacked and with peak fittings (dashed lines).
Figure 11
Figure 11
The interior of the UHV preparation chamber (showing a sample holder, a halogen lamp with reflector, a steel ring anode, and Cs dispensers) and the XPS analysis chamber connected to the preparation chamber.

References

    1. Akasaki, I., Amano, H. & Nakamura, S. Efficient blue light-emitting diodes leading to bright and energy-saving white light sources. R. Swed. Acad. Sci. 5005 (2014).
    1. Gibney E. Blue LED wins physics Nobel. Nature. 2014;514(7521):152–153. doi: 10.1038/514152a. - DOI - PubMed
    1. Pearton S, Kuo C. GaN and related materials for device applications. MRS Bull. 1997;22:17–21. doi: 10.1557/S0883769400032516. - DOI
    1. Kovalev S, et al. Electrical tunability of terahertz nonlinearity in graphene. Sci. Adv. 2021;7:1–10. doi: 10.1126/sciadv.abf9809. - DOI - PMC - PubMed
    1. Asakura K, Gaffney KJ, Milne C, Yabashi M. XFELs: Cutting edge X-Ray light for chemical and material sciences. Phys. Chem. Chem. Phys. 2020;22:2612–2614. doi: 10.1039/c9cp90304f. - DOI - PubMed