Clinical Trial
. 2023 Mar;29(3):615-622.
doi: 10.1038/s41591-022-02141-2. Epub 2023 Feb 23.

Vorasidenib and ivosidenib in IDH1-mutant low-grade glioma: a randomized, perioperative phase 1 trial

Affiliations
Clinical Trial

Vorasidenib and ivosidenib in IDH1-mutant low-grade glioma: a randomized, perioperative phase 1 trial

Ingo K Mellinghoff et al. Nat Med. 2023 Mar.

Erratum in

Abstract

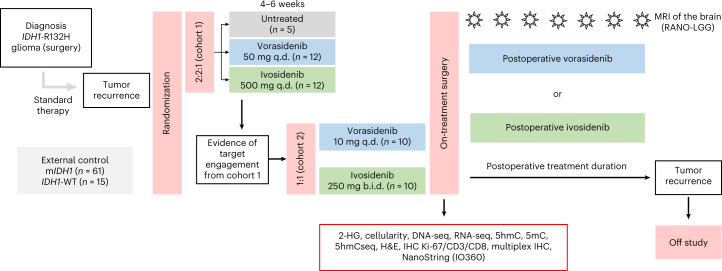
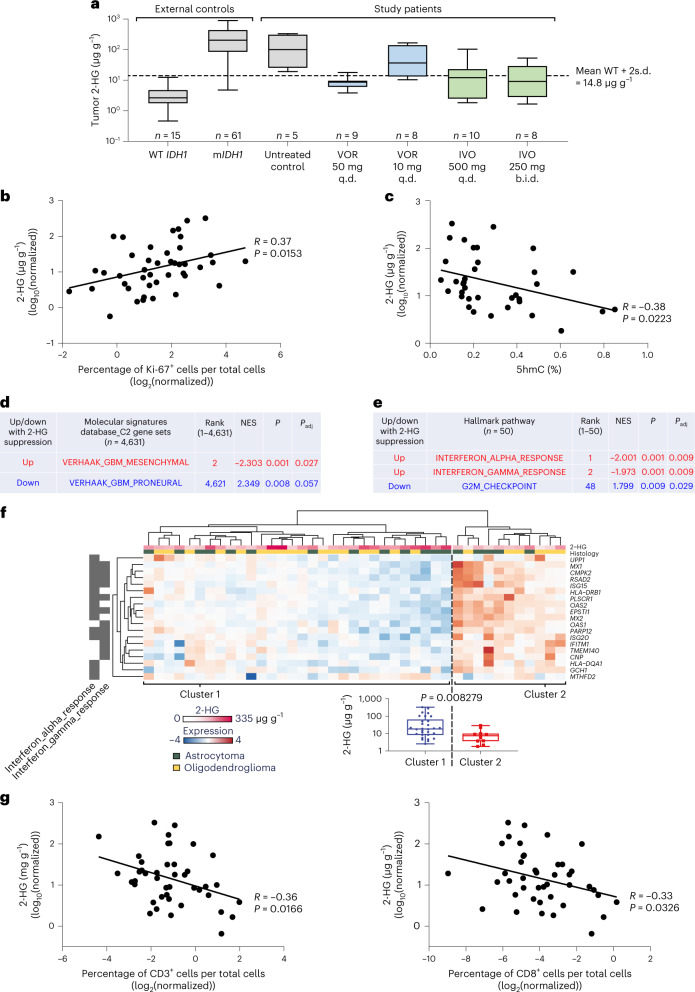
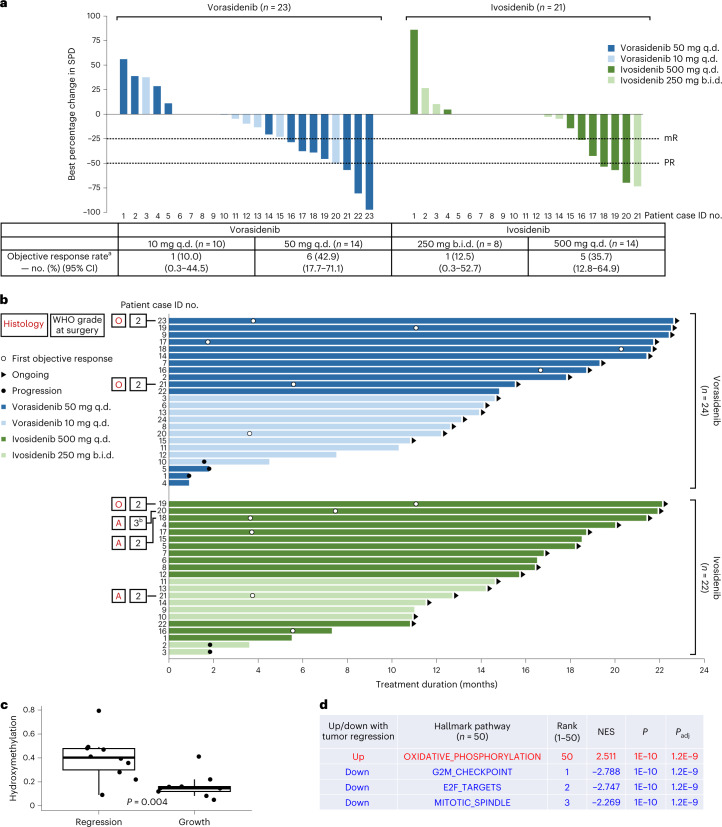
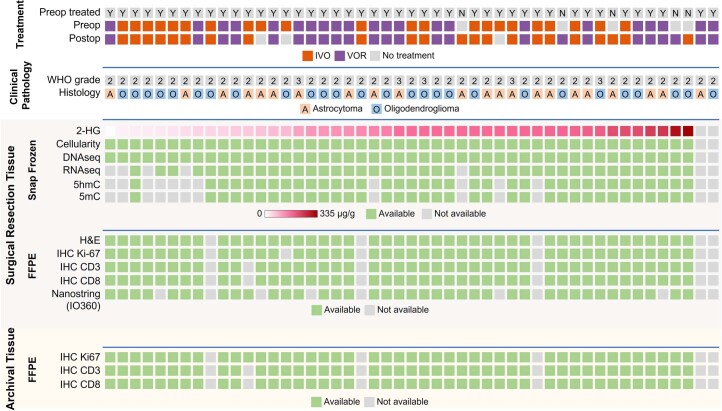
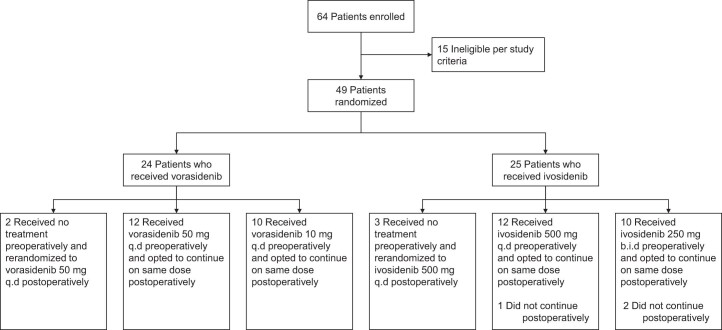
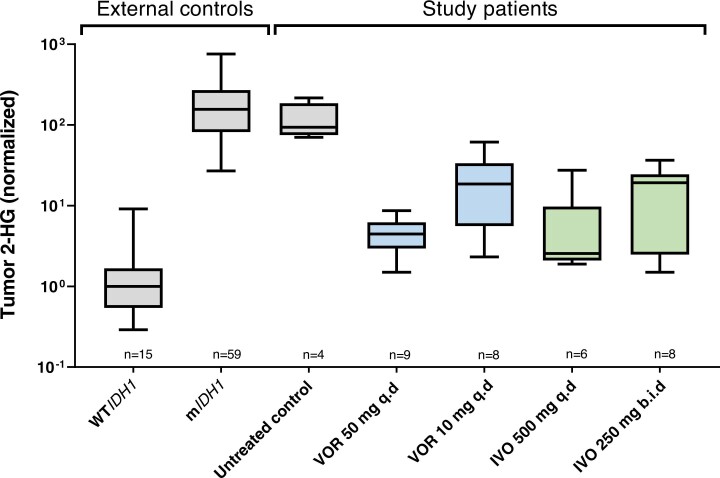
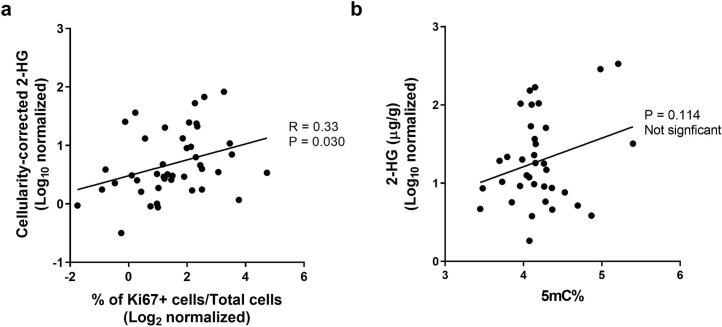
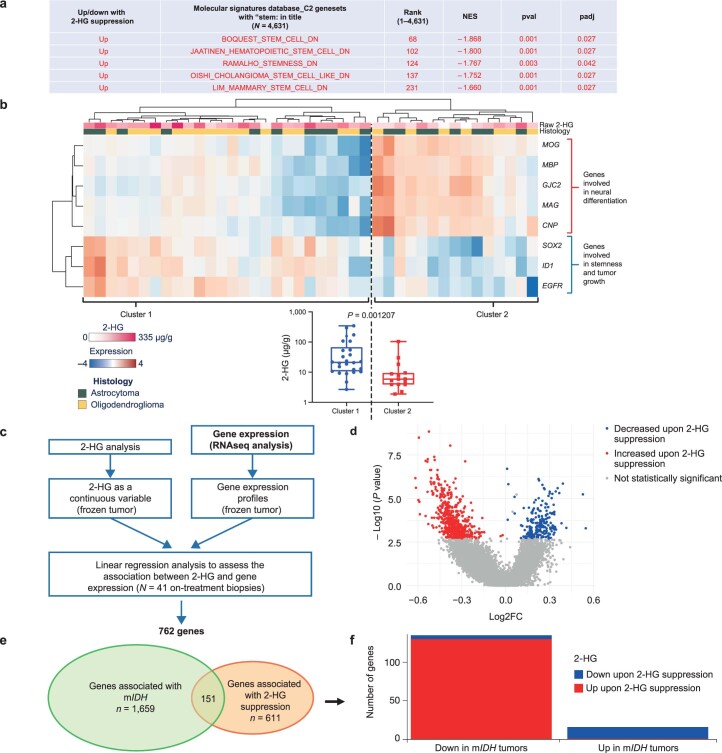
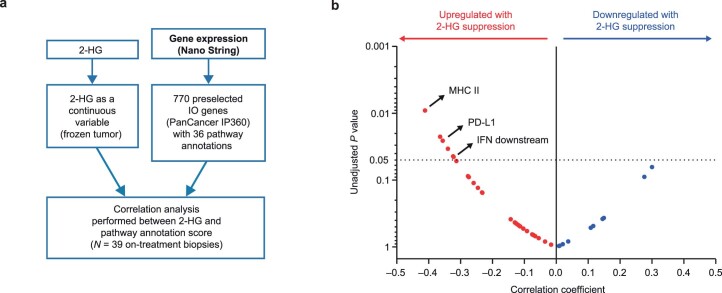
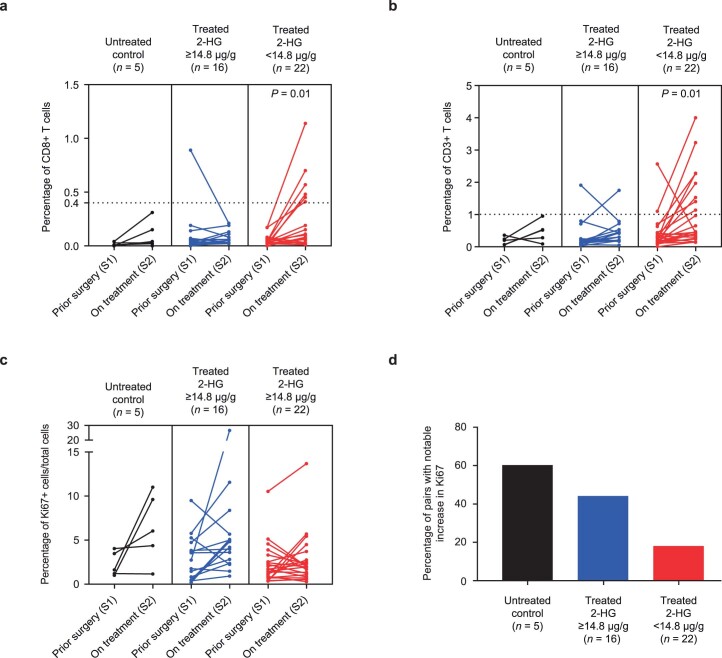
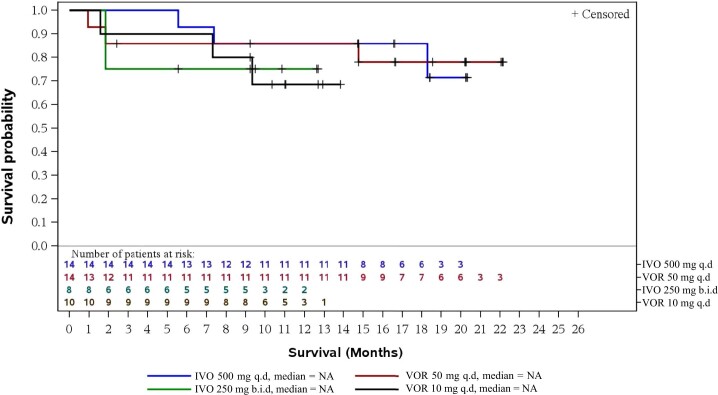
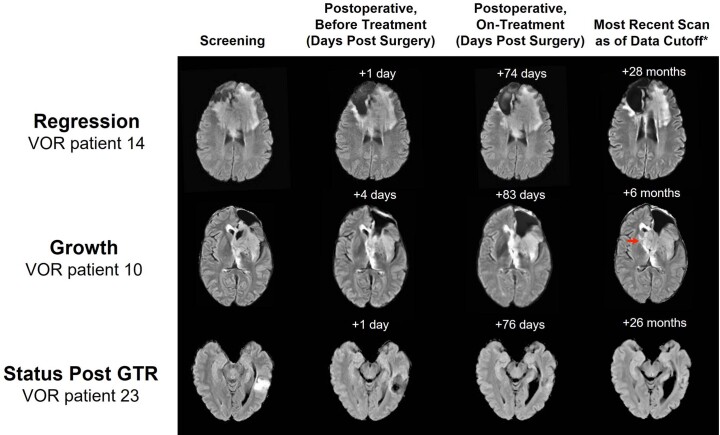
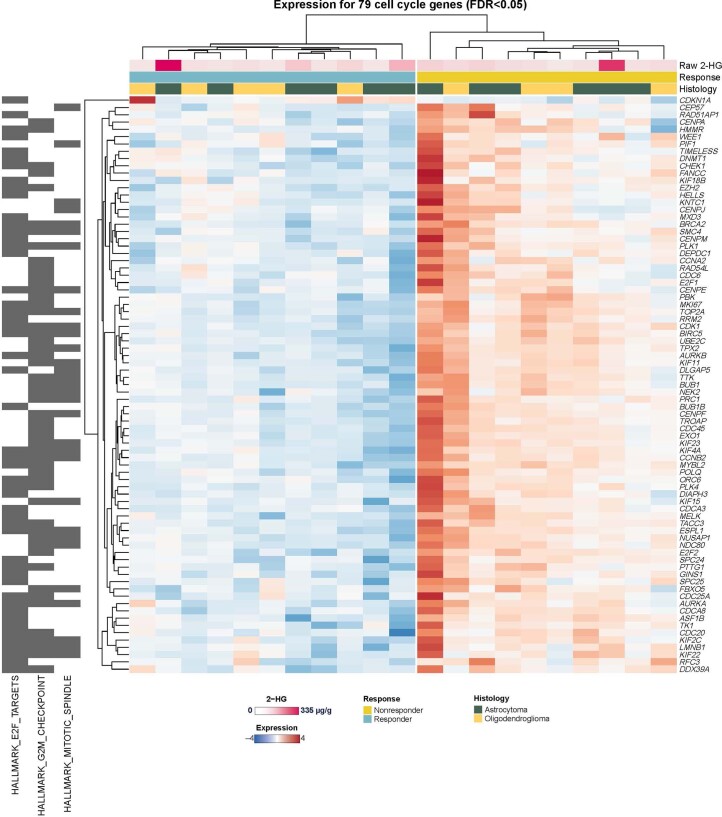
Vorasidenib and ivosidenib inhibit mutant forms of isocitrate dehydrogenase (mIDH) and have shown preliminary clinical activity against mIDH glioma. We evaluated both agents in a perioperative phase 1 trial to explore the mechanism of action in recurrent low-grade glioma (IGG) and select a molecule for phase 3 testing. Primary end-point was concentration of D-2-hydroxyglutarate (2-HG), the metabolic product of mIDH enzymes, measured in tumor tissue from 49 patients with mIDH1-R132H nonenhancing gliomas following randomized treatment with vorasidenib (50 mg or 10 mg once daily, q.d.), ivosidenib (500 mg q.d. or 250 mg twice daily) or no treatment before surgery. Tumor 2-HG concentrations were reduced by 92.6% (95% credible interval (CrI), 76.1-97.6) and 91.1% (95% CrI, 72.0-97.0) in patients treated with vorasidenib 50 mg q.d. and ivosidenib 500 mg q.d., respectively. Both agents were well tolerated and follow-up is ongoing. In exploratory analyses, 2-HG reduction was associated with increased DNA 5-hydroxymethylcytosine, reversal of 'proneural' and 'stemness' gene expression signatures, decreased tumor cell proliferation and immune cell activation. Vorasidenib, which showed brain penetrance and more consistent 2-HG suppression than ivosidenib, was advanced to phase 3 testing in patients with mIDH LGGs. Funded by Agios Pharmaceuticals, Inc. and Servier Pharmaceuticals LLC; ClinicalTrials.gov number NCT03343197.


Conflict of interest statement

The clinical trial was supported by Agios Pharmaceuticals, Inc. Servier Pharmaceuticals LLC completed the acquisition of Agios’ oncology business. I.K.M. reports serving as a consultant for Agios Pharmaceuticals, Black Diamond Therapeutics, Debiopharm Group, Puma Biotechnology, Servier Pharmaceuticals LLC, Voyager Therapeutics, DC Europa Ltd, Kazia Therapeutics, Novartis, Cardinal Health, Roche, Vigeo Therapeutics and Samus Therapeutics. M.L. reports employment with and stock ownership at Agios Pharmaceuticals Inc. and employment with Servier Pharmaceuticals LLC during the conduct of the study. P.Y.W. reports research support from AstraZeneca/MedImmune, Beigene, Celgene, Chimerix, Eli Lily, Genentech/Roche, Kazia, MediciNova, Merck, Novartis, Nuvation Bio, Servier Pharmaceuticals LLC, Vascular Biogenics and VBI Vaccines; and serving on an advisory board for AstraZeneca, Bayer, Black Diamond, Boehringer Ingelheim, Boston Pharmaceuticals, Celularity, Chimerix, Day One Bio, Genenta, GlaxoSmithKline, Karyopharm, Merck, Mundipharma, Novartis, Novocure, Nuvation Bio, Prelude Therapeutics, Sapience, Servier Pharmaceuticals LLC, Sagimet, Vascular Biogenics and VBI Vaccines. J.W.T. reports involvement as a principal investigator and involved in data collection and analysis, and manuscript preparation for clinical trials with BMS, Navio and AbbVie within the last five years. K.B.P. reports research support from Servier Pharmaceuticals LLC. B.M.E. reports serving as a consultant for MedQIA and Servier Pharmaceuticals LLC. K.L. reports employment with and stock ownership at Agios Pharmaceuticals Inc. during the conduct of the study. A.T. reports employment with and stock ownership at Agios Pharmaceuticals Inc. and employment with Servier Pharmaceuticals LLC. S. Choe reports employment with and stock ownership at Agios Pharmaceuticals Inc. and employment with Servier Pharmaceuticals LLC. Y.T. reports employment with and stock ownership at Agios Pharmaceuticals Inc. and employment with Servier Pharmaceuticals LLC during the conduct of the study. S.S. reports employment with and stock ownership at Agios Pharmaceuticals Inc. and employment with Servier Pharmaceuticals LLC. S.S.P. reports employment with and stock ownership at Agios Pharmaceuticals Inc. and employment with Servier Pharmaceuticals LLC. I.H. reports employment with and stock ownership at Agios Pharmaceuticals Inc. and employment with Servier Pharmaceuticals LLC. L.S. reports employment with and stock ownership at Agios Pharmaceuticals Inc. and employment with Servier Pharmaceuticals LLC. J.L.C. reports serving as a consultant for Agios Pharmaceuticals Inc. and Servier Pharmaceuticals LLC. T.F.C. reports being a cofounder, major stock holder, consultant and board member of Katmai Pharmaceuticals, and membership of the board, and paid consultancy for the 501c3 Global Coalition for Adaptive Research; holding stock in Chimerix and receiving milestone payments and possible future royalties; membership of the scientific advisory boards for Break Through Cancer and Cure Brain Cancer Foundation; providing paid consulting services to Sagimet, Clinical Care Options, Ideology Health, Servier, Jubilant, Immvira, Gan & Lee, BrainStorm, Katmai, Sapience, Inovio, Vigeo Therapeutics, DNATrix, Tyme, SDP, Novartis, Roche, Kintara, Bayer, Merck, Boehringer Ingelheim, VBL, Amgen, Kiyatec, Odonate Therapeutics QED, Medefield, Pascal Biosciences, Bayer, Tocagen, Karyopharm, GW Pharma, Abbvie, VBI, Deciphera, VBL, Agios, Genocea, Celgene, Puma, Lilly, BMS, Cortice, Wellcome Trust, Novocure, Novogen, Boston Biomedical, Sunovion, Human Longevity, Insys, ProNai, Pfizer, Notable labs, Medqia Trizel, Medscape; contracts with UCLA for the Brain Tumor Program with Oncovir, Merck, Oncoceutics, Novartis, Amgen, Abbvie, DNAtrix, Beigene, BMS, AstraZeneca, Kazia, Agios, Boston Biomedical, Deciphera, Tocagen, Orbus, AstraZeneca, Karyopharm; and the Regents of the University of California (T.F.C.’s employer) have licensed intellectual property co-invented by T.F.C. to Katmai Pharmaceuticals. No disclosures were reported by the other authors.

Figures

Fig. 1
Fig. 1. Study design.
An overview of the study design is shown. All patients could opt to receive the study drug postoperatively. After surgery, patients in the untreated control group were re-randomized 1:1 to either vorasidenib 50 mg q.d. or ivosidenib 500 mg q.d. Based on the PD and pharmacokinetic results of cohort 1, alternative dose regimens of vorasidenib and/or ivosidenib were to be tested in cohort 2.
Fig. 2
Fig. 2. Tumor 2-HG concentration and associated molecular changes.
a, 2-HG concentrations in external control and evaluable on-study resected tumor samples. Horizontal lines denote median values; boxes denote the 25th to 75th percentiles and the whiskers go from the smallest to the largest values. Colors indicate dose cohorts represented in Fig. 1. b, The percentage of Ki-67+ cells from on-treatment tumor samples in association with 2-HG. c, Levels of DNA hydroxymethylation from on-treatment tumor samples in association with 2-HG. The percentage of 5hmC was calculated as the ratio 5hmC:cytosine. d,e, Modulation of selected molecular pathways on 2-HG suppression. P values are adjusted for multiplicity as described in Methods. f, An unsupervised clustering of 2-HG–associated genes in the IFN-α/γ response pathways. Box plot: the horizontal lines denote median values, the boxes denote 25th to 75th percentiles and the whiskers go from the smallest to the largest values (n = 30 for cluster 1 and n = 11 for cluster 2; two-sided P value generated with Student’s t-test). g, The densities of CD3+ and CD8+ T cells from on-treatment tumor samples in association with 2-HG. For b, c and g, two-sided P values are simple linear regressions. IVO, ivosidenib; VOR, vorasidenib.
Fig. 3
Fig. 3. Postoperative tumor response assessment and treatment duration.
a, The best percentage change in SPD compared with postoperative baseline MRI and the overall ORRs by assigned treatment. Eleven patients had an on-study gross total resection without residual disease and were considered to have best response of stable disease as long as disease progression had not been documented. Patient 22 in the vorasidenib group had a >50% reduction in tumor size compared with baseline that was not confirmed and was therefore categorized as stable disease. Two patients were not included in the plot (patient 24 in the vorasidenib group and patient 22 in the ivosidenib group) owing to changes in selected target lesions measured at one or more postoperative time points that affected best percentage change assessment. aComplete response, PR or mR. b, Postoperative treatment duration by treatment group. The histology at the time of initial diagnosis and the WHO grade based on pathology of the on-study resected tumor are provided for six patients who achieved a PR after postoperative treatment with vorasidenib (n = 2) or ivosidenib (n = 4), according to the investigator’s assessment of response using RANO-LGG. bThe tumor grade for this patient changed from grade 2 at screening to grade 3 at surgery. c, On-treatment DNA hydroxymethylation levels in the tumor regression (n = 12) and tumor growth (n = 9) groups. Box plot: the horizontal lines denote the 25th, 50th and 75th percentiles and the upper/lower whiskers extend from the hinge to the largest/smallest value that is within 1.5 × the interquartile range from the hinge; the two-sided P value was generated using Student’s t-test. d, Modulation of selected molecular pathways comparing the tumor regression and tumor growth groups; P values adjusted for multiplicity as described in Methods. A, astrocytoma; O, oligodendroglioma; SPD, sum of products of tumor lesion diameters.
Extended Data Fig. 1
Extended Data Fig. 1. Overview of biospecimen analysis.
2-HG denotes D-2-hydroxyglutarate, 5hmC 5-hydroxymethylcytosine, 5mC 5-methylcytosine, DNAseq DNA sequencing, FFPE formalin-fixed paraffin embedded, H&E hematoxylin and eosin, IHC, immunohistochemistry; IVO, ivosidenib; Postop, postoperative; Preop, preoperative; RNAseq, RNA sequencing; VOR, vorasidenib; WHO, World Health Organization.
Extended Data Fig. 2
Extended Data Fig. 2. Trial profile.
B.i.d. denotes twice daily, and q.d. once daily.
Extended Data Fig. 3
Extended Data Fig. 3. Normalized tumor 2-HG.
Concentrations of 2-HG in resected tumor tissue were normalized for tumor cellularity as determined by hematoxylin and eosin staining, where available. Normalized 2-HG was calculated as 2-HG divided by the density of mIDH cells, where density of mIDH cells was calculated as the cellularity (number of total cells/mm2) × IDH VAF × 2. Samples with unavailable VAF data were excluded. Horizontal lines denote median values; boxes denote 25th to 75th percentiles; whiskers go from the smallest to the largest values. 2-HG denotes D-2-hydroxyglutarate; b.i.d., twice daily; IDH, isocitrate dehydrogenase; IVO, ivosidenib; mIDH, mutant isocitrate dehydrogenase; q.d., once daily; VAF, variant allele frequency; VOR, vorasidenib; WT, wild type.
Extended Data Fig. 4
Extended Data Fig. 4. Correlation between 2-HG tumor concentrations and Ki-67 and DNA 5mC content.
a,b, Simple linear regression of the percentage of Ki-67+ cells from on-treatment tumor samples in association with cellularity-corrected 2-HG (a) or percentage of 5mC content of DNA in association with tumor 2-HG (b). Cellularity-corrected 2-HG = 2-HG/cellularity.
Extended Data Fig. 5
Extended Data Fig. 5. Gene expression analysis of frozen tissue samples.
a, Modulation of top stemness-related pathways associated with cellular differentiation in the central nervous system upon 2-HG suppression. ‘DN’ indicates that genes in these pathways are downregulated in stem cells. Padj is P value adjusted for multiple comparisons as described in the Methods: if padj<0.05, the pathway is significantly associated with 2-HG suppression. b, Unsupervised clustering of 2-HG–associated genes involved in neuronal differentiation and stemness (N = 41). Box plot: horizontal lines denote median values, boxes denote 25th to 75th percentiles, whiskers go from the smallest to the largest values; two-sided P value generated with Student’s t test. c, Methodology for the determination of genes associated with 2-HG suppression. d, Volcano plot highlighting genes associated with 2-HG suppression. e, Venn diagram between genes associated with IDH mutations derived by comparing wild-type IDH and mIDH low-grade glioma in The Cancer Genome Atlas dataset and genes associated with 2-HG suppression as shown in Extended Data Fig. 5a. f, Plot of the 151 overlapping genes derived from Panel a. Note that the majority of genes that are downregulated in mIDH tumors (left bar) are upregulated upon 2-HG suppression and vice versa (right bar). 2-HG denotes D-2-hydroxyglutarate; FC, fold change; IDH1, isocitrate dehydrogenase; mIDH1, mutant isocitrate dehydrogenase; NES, normalized enrichment score; padj, adjusted P value pval, P value; RNAseq, RNA sequencing.
Extended Data Fig. 6
Extended Data Fig. 6. Examination of formalin-fixed paraffin-embedded tumor tissue from surgical samples and association with 2-HG suppression.
a, The methodology for the determination of the Nanostring IO360 pathways associated with 2-HG suppression. b, Volcano plot highlighting selected pathways (gene expression analyzed using nSolver 4.0 and normalized to control genes, P values unadjusted) associated with 2-HG suppression. 2-HG denotes D-2-hydroxyglutarate, IFN interferon, MHC II major histocompatibility complex class II, and PD-L1 programmed death-ligand 1.
Extended Data Fig. 7
Extended Data Fig. 7. Analysis of CD3 + and CD8 + T Cells, and Ki-67+ cells, in matched surgery 1 (archival)/surgery 2 (on treatment) pairs.
a–c, Patient-matched tumor-infiltrating CD8 + (panel a) and CD3 + (panel b) T-cell densities (Student’s two-sided t test), and Ki-67–positive cells (panel c) comparing prior surgery and on-treatment tumors. The upper 95% confidence interval of the 2-HG concentrations in wild-type isocitrate dehydrogenase tumors is 14.8 µg/g, as shown in Fig. 2a. On-treatment tumors with 2-HG levels less than 14.8 µg/g are categorized as tumors with more complete 2-HG suppression. d, Notable increase refers to an increase of % of Ki67+ cells by more than 2. 2-HG denotes D-2-hydroxyglutarate, S1 matched-pair analysis from surgery 1 (archival tumor tissue from prior surgery), and S2 matched-pair analysis from surgery 2 (on-treatment surgery).
Extended Data Fig. 8
Extended Data Fig. 8. Kaplan-Meier plot of progression-free survival (post-surgery), efficacy analysis set, as of April 29, 2020.
B.i.d. denotes twice daily, IVO ivosidenib, q.d. once daily, and VOR vorasidenib.
Extended Data Fig. 9
Extended Data Fig. 9. Exploratory analysis of molecular changes in resected tumors and clinical response.
*As of April 29, 2020. GTR denotes gross total resection, and VOR vorasidenib.
Extended Data Fig. 10
Extended Data Fig. 10. Unsupervised clustering of tumor response–associated genes in hallmark cell cycle–related pathways.
2-HG denotes D-2-hydroxyglutarate, and FDR false discovery rate.

References

    1. van den Bent MJ, Smits M, Kros JM, Chang SM. Diffuse infiltrating oligodendroglioma and astrocytoma. J. Clin. Oncol. 2017;35:2394–2401. doi: 10.1200/JCO.2017.72.6737. - DOI - PubMed
    1. Wen PY, et al. Glioblastoma in adults: a Society for Neuro-Oncology (SNO) and European Society of Neuro-Oncology (EANO) consensus review on current management and future directions. Neuro-Oncology. 2020;22:1073–1113. doi: 10.1093/neuonc/noaa106. - DOI - PMC - PubMed
    1. Louis DN, et al. The 2016 World Health Organization classification of tumors of the central nervous system: a summary. Acta Neuropathol. 2016;131:803–820. doi: 10.1007/s00401-016-1545-1. - DOI - PubMed
    1. Hardee ME, Zagzag D. Mechanisms of glioma-associated neovascularization. Am. J. Pathol. 2012;181:1126–1141. doi: 10.1016/j.ajpath.2012.06.030. - DOI - PMC - PubMed
    1. Claus EB, et al. Survival and low-grade glioma: the emergence of genetic information. Neurosurg. Focus. 2015;38:E6. doi: 10.3171/2014.10.FOCUS12367. - DOI - PMC - PubMed

Publication types

Associated data