. 2023 Feb 23;13(1):3186.
doi: 10.1038/s41598-023-29850-z.

Induction of primordial germ cell-like cells from common marmoset embryonic stem cells by inhibition of WNT and retinoic acid signaling

Affiliations

Induction of primordial germ cell-like cells from common marmoset embryonic stem cells by inhibition of WNT and retinoic acid signaling

Mayumi Shono et al. Sci Rep. .

Abstract

Reconstitution of the germ cell lineage using pluripotent stem cells provides a unique platform to deepen our understanding of the mechanisms underlying germ cell development and to produce functional gametes for reproduction. This study aimed to establish a culture system that induces a robust number of primordial germ cell-like cells (PGCLCs) from common marmoset (Callithrix jacchus) embryonic stem cells. The robust induction was achieved by not only activation of the conserved PGC-inducing signals, WNT and BMP4, but also temporal inhibitions of WNT and retinoic acid signals, which prevent mesodermal and neural differentiation, respectively, during PGCLC differentiation. Many of the gene expression and differentiation properties of common marmoset PGCLCs were similar to those of human PGCLCs, making this culture system a reliable and useful primate model. Finally, we identified PDPN and KIT as surface marker proteins by which PGCLCs can be isolated from embryonic stem cells without genetic manipulation. This study will expand the opportunities for research on germ cell development and production of functional gametes to the common marmoset.


Conflict of interest statement

The authors declare no competing interests.

Figures
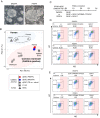
Figure 1
Figure 1
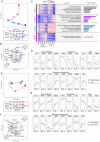
Induction of BTNG-positive cells by exogenous SOX17 expression with BMP4. (A) Morphology of cjESCs cultured on MEF in DK20FA and PESFA. Scale bar, 200 μm. (B) PCA of the gene expression profiles of pluripotent cell populations in common marmosets and humans. The genes used for the PCA were 839 ortholog genes annotated in both the common marmosets and humans, out of 886 differentially expressed genes between human naïve and primed ESCs. The transcriptome profiles of common marmoset blastocysts, epiblasts and naïve ESCs were used. (C) A schematic time course for PGCLC induction with or without exogenous SOX17 expression and BMP4. (D) FACS analysis of BTNG-positive cell induction with overexpression of transcription factors (TFs) and BLSE at day 4. (E) FACS analysis of BTNG-positive cell induction with overexpression of TFs and LSE at day 4.
Figure 2
Figure 2
Dissection of molecular pathways downstream of SOX17 and BMP4. (A) Differentiation trajectories during the induction of BTNG-positive cells with SOX17 + BLSE and BLSE alone. Shown are PCA plots of cjESCs and cells at 12, 24, 48, or 96 h of culture under the condition indicated. In this series of analyses, cjESCs were maintained under the DK20FA condition. (B) A scatterplot of the Z scores of the genes for the PC1 and 2 axes. The scatterplot was made using the Z scores of the genes for the PC1 and 2 axes shown in (A). Genes with > 2.5 SDs (695 genes) are shown. (C) Heatmap and GO analyses of genes contributing to each PC. The heatmap shows the expression level of genes categorized in the Z score plot in (B). Representative GO terms for each gene group and their p-values are shown at the right. (D) Expression dynamics of representative genes during the induction of BTNG-positive cells with SOX17 + BLSE and BLSE alone. The graphs show the expression levels of genes involved in PGC specification, pluripotency, epithelial-mesenchymal transition (EMT) and mesoderm differentiation during the induction of BTNG-positive cells. Each plot is based on duplicated RNA-seq analyses. The mean values are connected by the line. (E) Differentiation trajectories during the induction of BTNG-positive cells with SOX17 + BLSE and SOX17 + LSE. (F) A scatterplot of the Z scores of the genes for the PC1 and 2 axes. The scatterplot was made using the Z scores of the genes for the PC1 and 2 axes shown in (E). Genes with > 2.5 SDs (651 genes) are shown. (G) Expression dynamics of representative genes during the induction of BTNG-positive cells with SOX17 + BLSE and SOX17 + LSE. Details are the same as in (D). The analyses in this figure were performed using the common genes between marmosets and humans (15,755 genes).
Figure 3
Figure 3
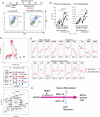
Efficient induction of BTNG-positive cells in the presence of IWR1. (A) Enhanced induction of BTNG-positive cells with IWR1. Shown are the schematic time course of the BTNG-positive cell induction with IWR1 (top) and a representative FACS plot of cells at day 4 of induction (bottom). (B) Further enhancement of the BTNG-positive cell induction with the preculture period and IWR1. Shown are a schematic time course of the BTNG-positive cell induction with the preculture period and IWR1 (top) and a representative FACS plot of cells at day 4 of induction (bottom). (C) Differentiation trajectories during the induction of BTNG-positive cells with BLSE + IWR1. Shown are PCA plots of cjESCs and cells at 12, 24, 48, or 96 h of culture under the condition indicated. The differentiation trajectories under the conditions with SOX17 + BLSE and BLSE alone were the same as in Fig. 2A. (D) Expression dynamics of representative genes during the BTNG-positive cell inductions with BLSE + IWR1, SOX17 + BLSE and BLSE alone. Graphs show the expression levels of genes involved in PGC specification, pluripotency, EMT and mesodermal differentiation. Each plot is based on duplicated RNA-seq analyses. The mean values are connected by a line. The analyses in this figure were performed using the common genes between marmosets and humans (15,755 genes).
Figure 4
Figure 4
A robust induction of BTNG-positive cells with IWR1 and BMS493. (A) A robust induction of BTNG-positive cells with BLSE + IWR1 + BMS. The top panel shows the schematic time course of the BTNG-positive cell induction with IWR1 and BMS493 after preculture, and the bottom panel is a representative FACS plot of cells at day 4 of induction. (B) The numbers of cells in the induction of BTNG-positive cells. Shown are the numbers of BTNG-positive cells (left) and total cells per aggregate (right). The plots were based on experiments repeated 4 times. Each line traces values obtained in a separate series of experiments. (C) Comparison of the differentiation trajectories under the BLSE + IWR1 + BMS condition. The top plot shows the PCA of cjESCs and derivatives cultured under the condition shown below. The bottom scatterplot shows the Z scores of the genes for the PC1 and 2 axes. Genes with > 2.5 SDs (690 genes) are shown. (D) Expression dynamics of representative genes during the induction of BTNG-positive cells under the BLSE + IWR1 + BMS condition in comparison with those of representative genes during the induction of BTNG-positive cells with BLSE + IWR1. Graphs show the expression levels of genes involved in PGC specification, pluripotency, EMT and mesodermal differentiation. Each plot is based on duplicated RNA-seq analyses. The mean values are connected by a line. The analysis was performed using the common genes between marmosets and humans (15,755 genes). (E) A schematic diagram of signaling effects on the differentiation from cjESCs to BTNG-positive cells.
Figure 5
Figure 5
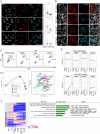
Epigenetic and differentiation properties of BTNG-positive cells. (A) Immunofluorescence analyses of representative epigenetic markers in BTNG-positive cells. Images show the results of immunofluorescence analysis of H3K9me2, H3K27me3 and 5-methyl cytosine (5mC) with DAPI in SOX17-positive cells at day 4 of culture under the BLSE + IWR1 condition. Plots on the right show relative fluorescence intensities, in comparison to those in cjESCs, as determined using Image J software. The average fluorescence intensity of cjESCs was set as 1. ***P < 0.001 (using Welch’s t test). NS, not significant. Scale bar, 20 μm. (B) Expression of DDX4 in the reaggregations with mouse gonadal somatic cells. Images show the results of immunofluorescence analysis of DDX4 with DAPI in BT-positive cells at days 20, 40, 70, and 90 of culture in the xenogeneic reconstituted ovaries. Scale bar, 20 μm. (C) FACS analysis of BTNG-positive cells in the xenogeneic reconstituted ovaries. (D) Differentiation trajectories of BTNG-positive cells in the xenogeneic reconstituted ovaries. Shown are PCA plots of cjESCs before or after the preculture, BTNG-positive cells at day 6 of induction, and BTNG-positive cells in the xenogeneic reconstituted ovaries at the day indicated. The scatterplot at right shows the Z-normalized loading scores of the genes contributing to the PC1 and PC2 axes. Genes with a radius > 2.5SDs are shown (887 genes), and are colored according to the gene classification in (F). The key genes are annotated in the plot. (E) Expression dynamics of representative genes in BTNG-positive cells cultured in the xenogeneic reconstituted ovaries. Each plot is based on duplicated RNA-seq analyses. The mean values are connected by a line. (F) Heatmap and GO analyses of genes upregulated in the xenogeneic reconstituted ovaries. The heatmap shows the expression levels of 887 genes highly contributing to the PC1 and PC2 axes, which are shown in (D). The genes were sorted by unsupervised hierarchical clustering, which provided 5 clusters according to the expression dynamics. Representative GO enrichments with p values and key genes in the cluster (green) characterized by gene expression upregulated in the xenogeneic reconstituted ovaries are shown. The colors at the left correspond to those in the Z score plot in (D). The analysis was performed using the common genes between marmosets and humans (15,755 genes).
Figure 6
Figure 6
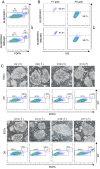
Induction and isolation of cjPGCLCs from non-reporter cjESC lines. (A) Isolation of non-reporter cjPGCLCs with surface marker proteins. FACS plots show the expression of PDPN and KIT in cells at day 6 of culture under a BLSE + IWR1 or BLSE + IWR1 + BMS condition. Note that a separable cell population was observed in the double-positive fraction. (B) Validation of cells double-positive for PDPN and KIT. FACS plots show BTNG expression in the cell populations gated in P1 and P2, as shown in (A). Note that more than 90% of cells double-positive for PDPN and KIT are positive for BTNG. (C) Induction of cjPGCLCs from multiple cjESC lines. The images show the morphology of each cjESC line cultured on MEF in PESFA. FACS plots below the images show the expression of PDPN and KIT in cells at day 6 of culture under the BLSE + IWR1 + BMS condition. Scale bar, 200 μm.

Similar articles

Cited by

References

    1. Saitou M, Yamaji M. Germ cell specification in mice: Signaling, transcription regulation, and epigenetic consequences. Reproduction. 2010;139:931–942. doi: 10.1530/REP-10-0043. - DOI - PubMed
    1. Tang WW, Kobayashi T, Irie N, Dietmann S, Surani MA. Specification and epigenetic programming of the human germ line. Nat. Rev. Genet. 2016;17:585–600. doi: 10.1038/nrg.2016.88. - DOI - PubMed
    1. Lee HJ, Hore TA, Reik W. Reprogramming the methylome: Erasing memory and creating diversity. Cell Stem Cell. 2014;14:710–719. doi: 10.1016/j.stem.2014.05.008. - DOI - PMC - PubMed
    1. Lawson KA, et al. Bmp4 is required for the generation of primordial germ cells in the mouse embryo. Genes Dev. 1999;13:424–436. doi: 10.1101/gad.13.4.424. - DOI - PMC - PubMed
    1. Liu P, et al. Requirement for Wnt3 in vertebrate axis formation. Nat. Genet. 1999;22:361–365. doi: 10.1038/11932. - DOI - PubMed

Publication types