. 2023 Mar;55(3):389-398.
doi: 10.1038/s41588-023-01327-9. Epub 2023 Feb 23.

Network expansion of genetic associations defines a pleiotropy map of human cell biology

Affiliations

Network expansion of genetic associations defines a pleiotropy map of human cell biology

Inigo Barrio-Hernandez et al. Nat Genet. 2023 Mar.

Abstract

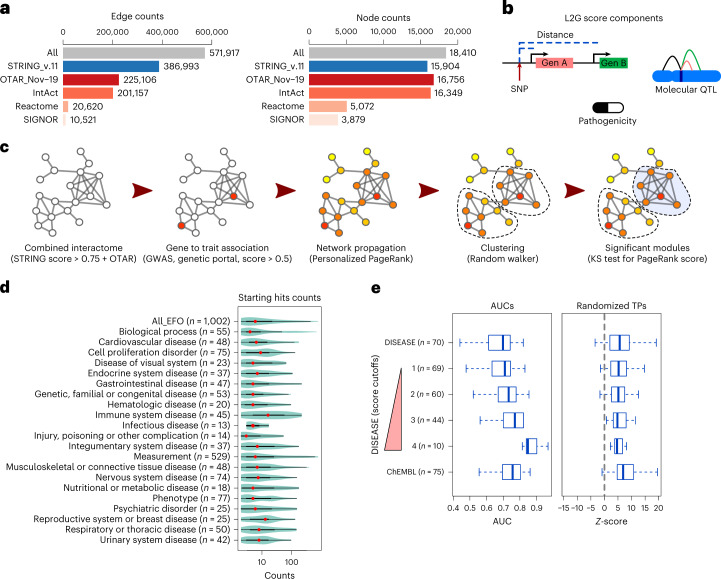
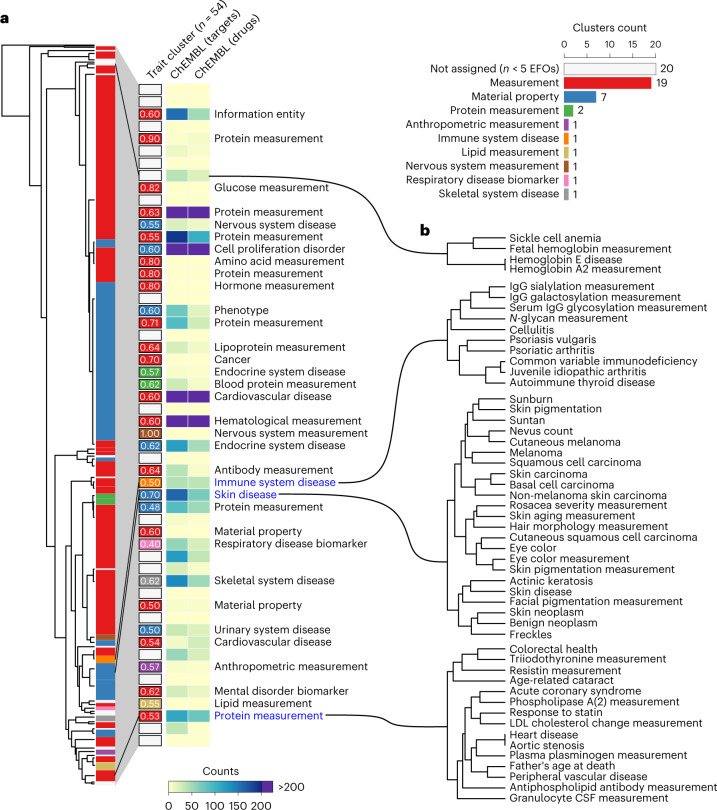
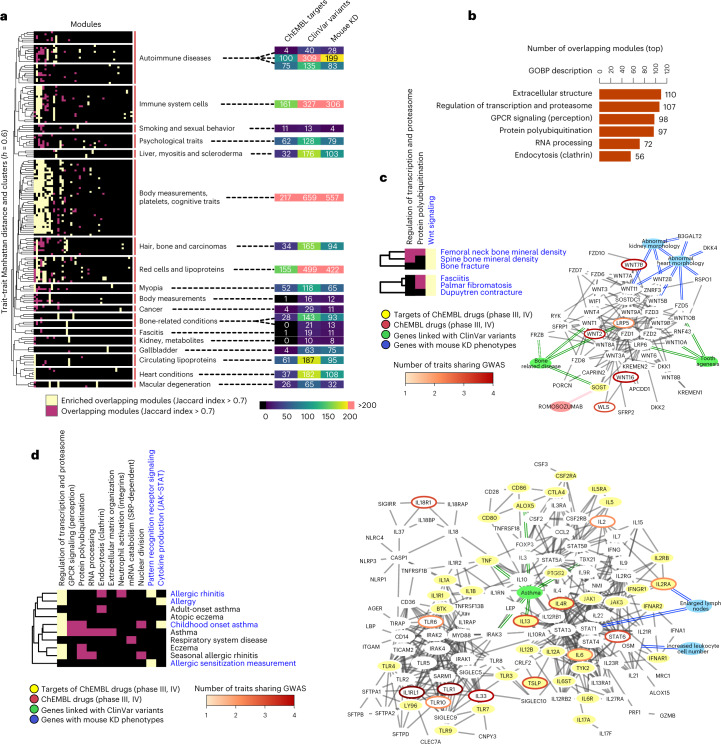
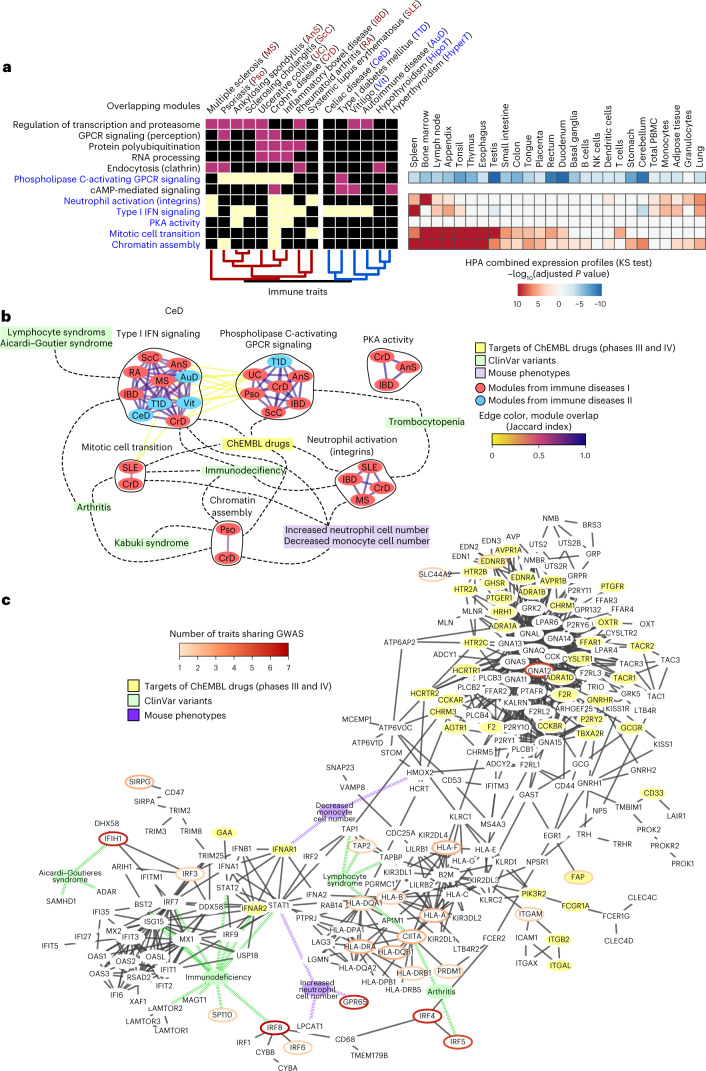
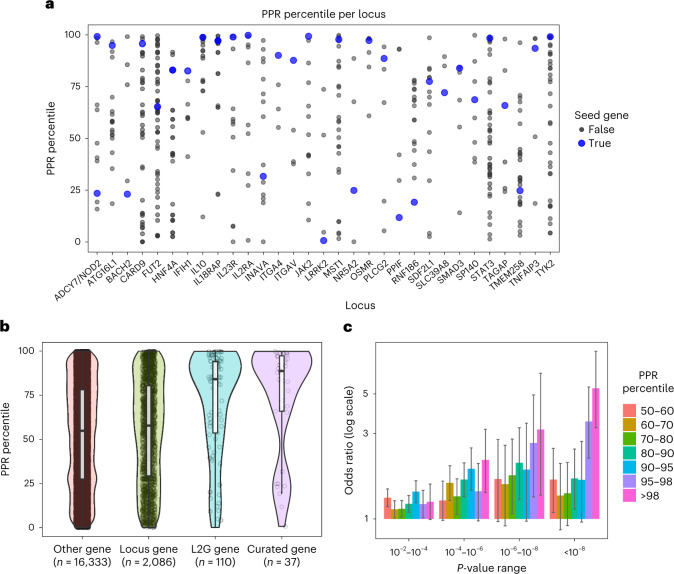
Interacting proteins tend to have similar functions, influencing the same organismal traits. Interaction networks can be used to expand the list of candidate trait-associated genes from genome-wide association studies. Here, we performed network-based expansion of trait-associated genes for 1,002 human traits showing that this recovers known disease genes or drug targets. The similarity of network expansion scores identifies groups of traits likely to share an underlying genetic and biological process. We identified 73 pleiotropic gene modules linked to multiple traits, enriched in genes involved in processes such as protein ubiquitination and RNA processing. In contrast to gene deletion studies, pleiotropy as defined here captures specifically multicellular-related processes. We show examples of modules linked to human diseases enriched in genes with known pathogenic variants that can be used to map targets of approved drugs for repurposing. Finally, we illustrate the use of network expansion scores to study genes at inflammatory bowel disease genome-wide association study loci, and implicate inflammatory bowel disease-relevant genes with strong functional and genetic support.


Conflict of interest statement

C.A.A. has received consultancy fees from Genomics PLC and BridgeBio Inc. G.B. is an employee of GSK. The remaining authors declare no competing interests.

Figures

Fig. 1
Fig. 1. Implementation and benchmarking of network-based augmentation of GWAS.
a, Edge and node counts of the combined interactome and its components. OTAR is the Open Targets combined physical protein interaction network that is provided via a Neo4j Graph Database. b, Graphic representation of some L2G components: SNP-to-gene distance, data from QTLs and variant effect predictions. The integration of information into the L2G score has been described previously. c, Graphical representation of the network-based approach: network propagation of the initial input, clustering using a random walker to find gene communities and scoring of modules using the distribution of PageRank score. KS, Kolmogorov–Smirnov. d, Number of starting genes linked to traits, grouped in therapeutic areas. In the violin plot, the red dots represent the median, the limits of the thick line correspond to quartiles 1 and 3 (25% and 75% of the distribution) and the limits of the thin line are 1.5× the interquartile range. e, Benchmarking of the method, using as a starting signal genes from the Open Targets Genetics portal with a L2G score >0.5. AUC values are calculated using as positive hits the DISEASE database, with increasing cutoff values for its gene-to-trait score (Methods), as well as clinical trials data from the ChEMBL database (clinical phase II or higher). We also re-calculated the AUC values and determined Z-scores reflecting the deviation in AUCs relative to those observed after randomization of the list of true positives (TPs). In the boxplots, the middle lines represent the median, the limits of the box are quartiles 1 and 3 and the whiskers represent 1.5× the interquartile range.
Fig. 2
Fig. 2. Trait–trait genetic and functional similarities determined from network expansion of GWAS data.
a, Tree showing the Manhattan distance between all traits, using the full PPR score. Hierarchical clustering was performed using a cutoff of h = 1, leading to 54 clusters, colored depending on the predominant EFO ancestry term. The right-hand panel is a barplot showing the 54 clusters with the frequencies for the predominant EFO ancestry terms and a heatmap showing the counts for ChEMBL targets and drugs. The text label next to each cluster corresponds to the second most predominant EFO terms that, on average, label 35% of the traits within the clusters that have a text label. b, Examples of traits grouped using the Manhattan distance, extracted from the tree in a. CSF, colony-stimulating factor; Ig, immunolglobulin; LDL, low-density lipoprotein.
Fig. 3
Fig. 3. Multitrait gene module associations for studies of shared biological processes and drug-repurposing opportunities.
a, Heatmap showing the overlap between gene modules across traits. Traits were clustered using hierarchical clustering (Methods) and subgroups were defined by a cutoff of 0.6 average correlation coefficient. A module was considered the same across different traits when most genes are in common (Jaccard index > 0.7). Significant trait–module relations are marked in yellow or pink, with yellow indicating modules overrepresented in one of the subgroups of traits (one-sided Fisher’s exact test, adjusted P < 0.05) and pink otherwise. The heatmap in the right-hand panel shows the number of genes in modules from each subgroup of traits that are drug targets (phase III or higher, ChEMBL database), linked with clinical variants (ClinVar database) or with mouse KO phenotypes (International Mouse Phenotyping Consortium database). b, Barplot showing the number of traits linked with the top six most pleiotropic gene modules. The GOBP description is based on the results of a GOBP enrichment test (Methods). c, Simplified heatmap of the clusters in a concerning bone-related and fasciitis traits. The represented network includes genes from the modules indicated in blue letters and the represented interactions have been filtered for visualization (Methods). Blue nodes, relevant mouse KO phenotypes; green nodes, diseases with clinical variants enriched in this gene module; red nodes, drugs in clinical trials. Genes linked to blue, green or yellow nodes have the linked mouse phenotypes, clinical variants in the linked disease or are targets of the linked drug. Genes that are the targets of drugs in clinical trials have yellow nodes. GWAS-linked genes (L2G score > 0.5) have borders colored in an orange to red gradient (count of GWAS-linked traits). d, Simplified heatmap of one the clusters in a concerning allergic reactions (node and edge color code are the same as in c). In this case, two modules were merged to build the interaction network in the right-hand panel. mRNA, messenger RNA; SRP, signal recognition particle.
Fig. 4
Fig. 4. Gene module analysis of autoimmune diseases.
a, Heatmap showing the overlap between gene modules across traits (color-coded as in Fig. 3a,c,d). The GOBP description is based on the results of a GOBP enrichment test (one-sided Fisher’s exact test, BH adjustment, Methods). The heatmap in the right-hand panel shows the gene set enrichment analysis carried out on the expression data from different tissues extracted from Human Protein Atlas (HPA) for the gene modules in blue (two-sided Kolmogorov–Smirnov test, Methods). After BH adjustment for multiple testing, the P value of the test was log transformed and given a positive value if the median distribution for the foreground was higher than the background and a negative value if it was lower. b, Shared modules as a network, nodes are gene modules associated with different immune-related traits colored blue or red for the two trait subgroups; edges represent a high degree of overlap at the gene level (Jaccard index > 0.7). Gene modules linked to different traits are given in black circles. Gene modules are linked with the yellow node ‘ChEMBL-drugs’ when they contain targets for drugs in clinical trials (phases III and IV, ChEMBL); linked with green nodes when they are enriched in genes with clinical variants for a given disease; and linked with purple nodes when they are enriched for the corresponding KO phenotypes (one-sided Fisher’s exact test, adjusted P < 0.05). c, Network corresponding to genes found in gene modules enriched for Type I interferon (INF) signaling, phospholipase C-activating GPCR signaling, neutrophil activation (integrins) and protein kinase A (PKA) activity. Edge filtering, node and edge colors are the same as in Fig. 3c,d.
Fig. 5
Fig. 5. An IBD-specific network is enriched for likely causal genes.
a, Curated IBD seed genes (N = 37) tend to have a higher network propagation score (PPR percentile) than other genes within 200 kb at the same loci. b, Genes selected by high Open Targets L2G score also tend to have high PRR percentile, highlighting network evidence as complementary to typical locus features. In the boxplots, the middle lines represents the median, the limits of the box are quartiles 1 and 3 and the whiskers represents 1.5× the interquartile range. c, Genome-wide, genes with low P-value SNPs within 10 kb are enriched for high PPR percentile (one-sided Fisher’s exact test). Data are presented as the mean ± s.d.

References

    1. Oti M, Brunner HG. The modular nature of genetic diseases. Clin. Genet. 2007;71:1–11. doi: 10.1111/j.1399-0004.2006.00708.x. - DOI - PubMed
    1. Carter H, Hofree M, Ideker T. Genotype to phenotype via network analysis. Curr. Opin. Genet. Dev. 2013;23:611–621. doi: 10.1016/j.gde.2013.10.003. - DOI - PMC - PubMed
    1. Oti M, Snel B, Huynen MA, Brunner HG. Predicting disease genes using protein–protein interactions. J. Med. Genet. 2006;43:691–698. doi: 10.1136/jmg.2006.041376. - DOI - PMC - PubMed
    1. Franke L, et al. Reconstruction of a functional human gene network, with an application for prioritizing positional candidate genes. Am. J. Hum. Genet. 2006;78:1011–1025. doi: 10.1086/504300. - DOI - PMC - PubMed
    1. Vanunu O, Magger O, Ruppin E, Shlomi T, Sharan R. Associating genes and protein complexes with disease via network propagation. PLoS Comput. Biol. 2010;6:e1000641. doi: 10.1371/journal.pcbi.1000641. - DOI - PMC - PubMed

Publication types