. 2023 Nov;41(11):1582-1592.
doi: 10.1038/s41587-023-01683-1. Epub 2023 Feb 23.

Retrospective analysis of enhancer activity and transcriptome history

Affiliations

Retrospective analysis of enhancer activity and transcriptome history

Ruben Boers et al. Nat Biotechnol. 2023 Nov.

Abstract

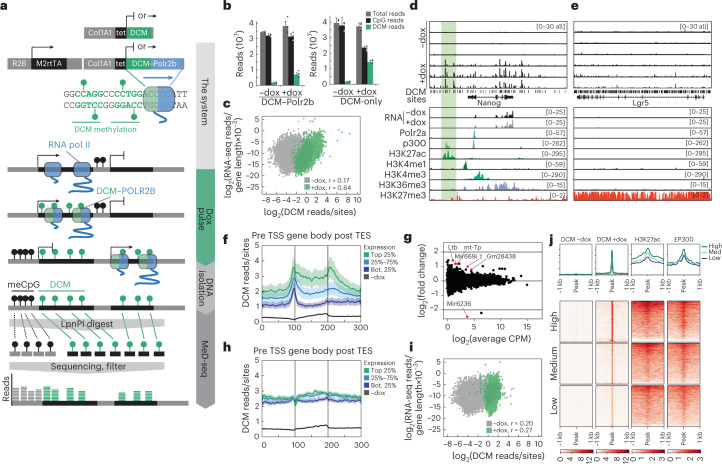
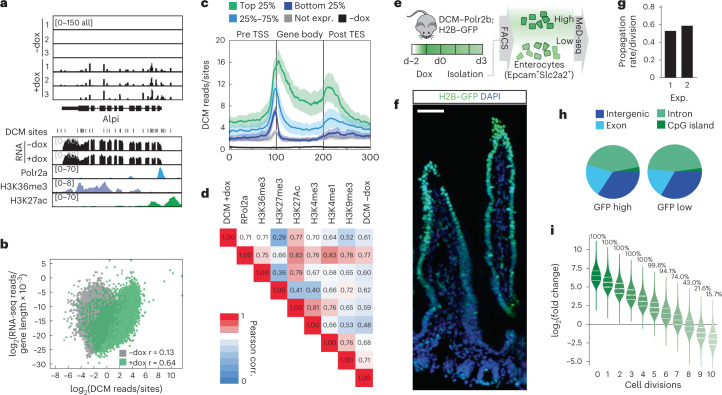
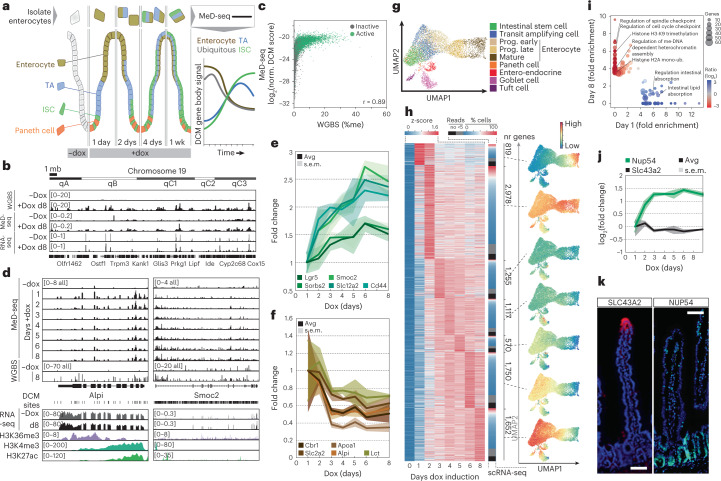
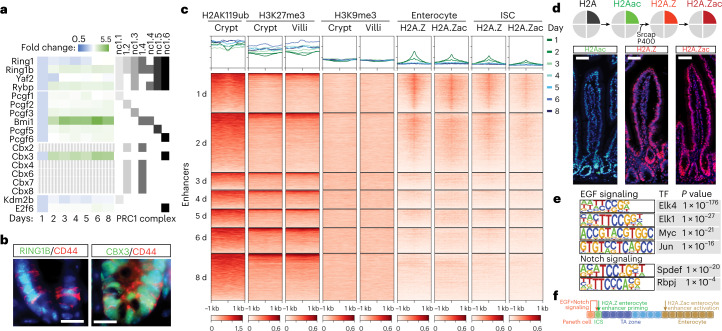
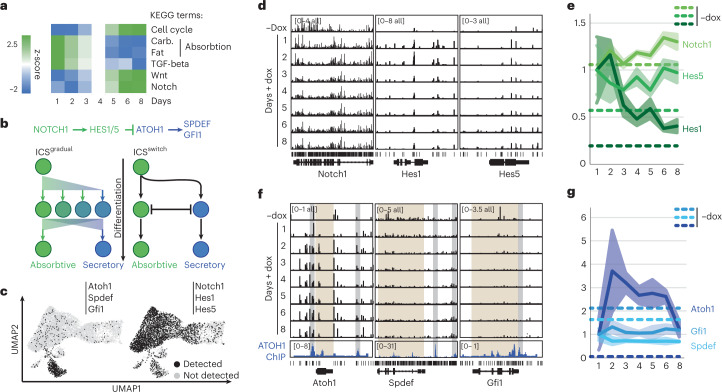
Cell state changes in development and disease are controlled by gene regulatory networks, the dynamics of which are difficult to track in real time. In this study, we used an inducible DCM-RNA polymerase subunit b fusion protein which labels active genes and enhancers with a bacterial methylation mark that does not affect gene transcription and is propagated in S-phase. This DCM-RNA polymerase fusion protein enables transcribed genes and active enhancers to be tagged and then examined at later stages of development or differentiation. We apply this DCM-time machine (DCM-TM) technology to study intestinal homeostasis, revealing rapid and coordinated activation of enhancers and nearby genes during enterocyte differentiation. We provide new insights in absorptive-secretory lineage decision-making in intestinal stem cell (ISC) differentiation and show that ISCs retain a unique chromatin landscape required to maintain ISC identity and delineate future expression of differentiation-associated genes. DCM-TM has wide applicability in tracking cell states, providing new insights in the regulatory networks underlying cell state changes.


Conflict of interest statement

The authors declare no conflicts of interest except for R.B., J.B., W.F.J.v.I. and J.G. who report being shareholders in Methylomics B.V., a commercial company that applies MeD-seq to develop methylation markers for cancer staging.

Figures

Fig. 1
Fig. 1. DCM-TM in ESCs.
a, Overview of the DCM-TM and MeD-seq pipelines. b, Induction of DCM labeling measured 5 days after the start of dox treatment in DCM–Polr2b and DCM-only transgenic ESC lines (average with s.e.m. plotted, n = 3 per condition). c, Scatter plot displaying RNA-seq gene expression level in relation to DCM read count per gene before (gray) and after (green) dox induction of DCM–Polr2b ESCs. Pearson correlation coefficient is denoted as r (d,e). Genome browser view of DCM-specific MeD-seq reads (n = 3), RNA-seq (±dox, average of n = 3) and ChIP-seq tracks (ENCODE) in the Nanog (d, enhancer indicated in green) and Lgr5 (e) loci. f, Gene meta-analysis showing distribution of DCM reads of expressed genes split in three clusters based on expression level (top 25%, 25–75% and bottom 25%) in DCM–Polr2b ESCs after 5 days of dox treatment (average plotted with ± s.e.m.). g, RNA-seq analysis comparing average gene expression values before and 5 days after dox induction (genes indicated in red show significant expression change). h, Gene meta-analysis as in f for DCM-only ESCs after 5 days of dox treatment (average plotted with ± s.e.m.). i, Scatter plot displaying RNA-seq gene expression level in relation to DCM read count per gene before (gray) and after (green) dox induction of DCM-only ESCs. j, Heat map showing ChIP-seq overlap (H3K27ac and EP300) with 1-kb regions around enhancer DMRs, which are split in three clusters based on the signal in +dox (second panel). Each profile plot has the same y-axis range as its corresponding heat map.
Fig. 2
Fig. 2. DCM labeling and propagation in the small intestine.
a, Genome browser view of Alpi locus showing DCM-specific MeD-seq reads before and after 1 day of dox treatment (n = 3). RNA-seq (±dox, average of n = 3), POLR2A, H3K36me3 and H3K27ac ChIP-seq tracks from ENCODE are shown below. b, Scatter plot displaying RNA-seq gene expression level in relation to DCM read count per gene before (gray) and after (green) 10 days of dox induction in epithelium of jejunum. c, Gene meta-analysis showing distribution of DCM reads in the top 25%, 25–75% and bottom 25% expressed genes after 3 days of dox treatment (average plotted with ± s.e.m.). d, Pearson correlation analysis comparing DCM and ChIP-seq read count distribution. e, Experimental setup; mice received dox for 2 days with isolation of H2B-GFPhigh and H2B-GFPlow and EPCAM+/SLC2A2+ cells after a 3-day chase through FACS analysis, followed by DNA isolation and MeD-seq. f, Immunocytochemistry detecting H2B-GFP (FITC) and DNA (DAPI) in jejunum of a mouse 3 days after an IP dox pulse (representative image shown from n ≥ 5 replicates; scale bar, 50 µm) g, Calculated DCM propagation rate in two independent experiments. h, Relative distribution of DCM reads in intergenic, exonic, intronic and CpG island sequences in GFPhigh and GFPlow cell fractions. i, In silico prediction of DCM labeling levels after each cell division. The fold change between the simulated diluted +dox sample and background levels (−dox) are plotted. The percentage above each violin indicates the percentage of genes that can still be detected based on their estimated fold change.
Fig. 3
Fig. 3. DCM–Polr2b labeling reveals gene activity maps from ISC to enterocyte.
a, Overview of experimental procedure; mice are labeled with dox and sacrificed at different timepoints to isolate EPCAM+/SLC2A2+ enterocytes that are subjected to MeD-seq. ISC, TA, enterocyte and ubiquitously expressed genes are expected to display different dynamic behavior in time. b, Genome browser view of chromosome 19 showing WGBS (n = 1), MeD-seq (average of n = 3) and RNA-seq (average of n = 3) read count distribution on untreated and 8-day dox-treated enterocytes. c, Correlation plot of DCM gene body labeling comparing MeD-seq and WGBS. Genes that are significantly detected using MeD-seq are highlighted in green. d, Genome browser view of the average normalized MeD-seq DCM (average of n = 3), WGBS (n = 1), RNA-seq (average of n = 3) and ChIP-seq (H3K36me3, H3K4me3 and H3K27ac) reads in the Smoc2 and Alpi loci at different timepoints after the start of dox treatment. e,f, DCM labeling (fold change in DCM reads relative to total and normalized to t = 1 day) of ISCs (e) and enterocyte-specific genes (f). g, UMAP of jejunum scRNA-seq data showing clusters annotated as specific cell types. h, DCM labeling of all significantly labeled genes (negative (t = 0) samples compared to all days after the start of dox treatment) clustered according to the maximum DCM signal. For each cluster, the capture by scRNA-seq is shown as the number of genes without reads (black), expressed in five cells with fewer than five reads (gray) and, when expressed, the percentage of cells with signal (blue to red), and average expression of clustered genes is plotted in the UMAP shown in g. i, Top 200 normalized fold-enriched GO terms for each set of genes peaking at day 1 and day 8. Circle size represents gene number per GO term, and color bar displays the ratio of gene count between day 1 and day 8. j,k, DCM labeling (j) and validation by immunocytochemistry (k) of SLC43A2 and NUP54 expression (FITC; DNA is DAPI stained; representative image shown from n ≥ 5 (NUP54) or n = 3 (SLC43A2) replicates; scale bars, 50 μm).
Fig. 4
Fig. 4. Temporal changes in TF and enhancer activity from ISC to enterocyte.
a, Percentage of H3K27ac peaks that are labeled by DCM (that is, peaks with ≥1 significant DCM site <750 bp from peak). Random control based on 100 sets of reshuffled H3K27ac peaks is added to show expected random overlap (n = 1 calculation for all, n = 100 calculations on randomized data as control, mean ± s.d.). b, Left panels display genome browser view showing DCM labeling of enterocyte-specific (Fabp1) and ISC-specific (Olfm4) genes with nearby enhancers (marked in blue) showing coordinated behavior in time (average of n = 3). Right panels show the profiles over time for each gene and of the closest significantly labeled DCM sites (average plotted with ± s.e.m.). c, Heat map of DCM labeling of enhancers (z-scores of mean-normalized DCM reads). d, Heat map showing H3K27ac ChIP-seq and ATAC-seq overlap with the regions around enhancer DMRs peaking at different days of dox induction. Each profile plot has the same y-axis range as its corresponding heat map. e, Correlation between gene peak day and peak day of closeby enhancers (z-score of proportion of enhancers per day). f, Heat map showing TF motif dynamics observed in intergenic DCM DMRs in time (left) and combined analysis of motif enrichment and DCM gene body labeling dynamics of TFs displaying a positive correlation in time (right).
Fig. 5
Fig. 5. H2A.Z is recruited to enterocyte-specific enhancers in ISCs.
a, Temporal behavior of DCM methylation (normalized to t = 1 day) of members of different PRC1 complexes (genes indicated in dashed gray do not accumulate DCM signal above background). b, Immunofluorescence detection of RING1B (FITC), CBX3 (FITC) and CD44 (Texas Red) in the intestinal crypt (DNA = DAPI; representative image shown from n ≥ 5 replicates; scale bars, 16 μm). c, Heat map showing H2A119ub, H3K27me3 and H3K9me3 ChIP-seq and H2A.Z and H2A.Zac CUT&RUN overlap in indicated cell types with the regions around enhancer DMRs peaking at different days of dox induction. Enhancers were ordered according to H3K27ac and ATAC-seq enrichment (Fig. 4d). Each profile plot has the same y-axis range as its corresponding heat map. d, Top diagram shows sequential changes from H2A modifications and variant replacement. Bottom panels show immunocytochemistry detecting H2Aac (FITC), H2A.Z and H2A.Zac (both Texas Red) (DNA = DAPI; representative image shown from n ≥5 replicates; scale bars, 50 μm). e, HOMER motif analysis on H2A.Z enhancer peaks present in enterocytes revealing motif enrichment for TFs downstream of EGF and Notch signaling (P values calculated using a hypergeometric distribution). f, Model depicting timing of H2A.Z incorporation and acetylation of enterocyte-specific enhancers.
Fig. 6
Fig. 6. Notch signaling in absorptive versus secretory cell fate decision.
a, KEGG pathway enrichment analysis at different timepoints after the start of dox treatment. b, Notch signaling pathway in ISC differentiation toward absorptive and secretory lineage; two possible mechanisms involving a gradual change or an on/off switch in Notch signaling are shown. c, Cells expressing at least one of following three genes—Atoh1, Spdef and Gfi1 (left) or Notch1, Hes1 and Hes5 (right)—in scRNA-seq are shown in UMAP of Fig. 4g. d,e, Genome browser view of MeD-seq DCM reads (average of n = 3) in Notch1 and its target genes Hes1 and Hes5 and quantification of DCM signal normalized to day 1 (dashed lines represent −dox signal per gene, average plotted with ± s.e.m.). f,g, As in e,f but now for Atoh1, Spdef and Gfi1 (average plotted with ± s.e.m.). Bottom tracks in f show ATOH1 ChIP-seq signal from Atoh1 GFP+ cells from the small intestine (ATOH1-targeted regulatory regions are indicated in gray and gene bodies in brown).

References

    1. Bradner JE, Hnisz D, Young RA. Transcriptional addiction in cancer. Cell. 2017;168:629–643. doi: 10.1016/j.cell.2016.12.013. - DOI - PMC - PubMed
    1. Lee TI, Young RA. Transcriptional regulation and its misregulation in disease. Cell. 2013;152:1237–1251. doi: 10.1016/j.cell.2013.02.014. - DOI - PMC - PubMed
    1. Stadhouders R, Filion GJ, Graf T. Transcription factors and 3D genome conformation in cell-fate decisions. Nature. 2019;569:345–354. doi: 10.1038/s41586-019-1182-7. - DOI - PubMed
    1. Alemany A, Florescu M, Baron CS, Peterson-Maduro J, van Oudenaarden A. Whole-organism clone tracing using single-cell sequencing. Nature. 2018;556:108–112. doi: 10.1038/nature25969. - DOI - PubMed
    1. Bowling S, et al. An engineered CRISPR–Cas9 mouse line for simultaneous readout of lineage histories and gene expression profiles in single cells. Cell. 2020;181:1693–1694. doi: 10.1016/j.cell.2020.06.018. - DOI - PMC - PubMed

MeSH terms