. 2023 Nov;41(11):1567-1581.
doi: 10.1038/s41587-023-01680-4. Epub 2023 Feb 23.

Engineered human hepatocyte organoids enable CRISPR-based target discovery and drug screening for steatosis

Affiliations

Engineered human hepatocyte organoids enable CRISPR-based target discovery and drug screening for steatosis

Delilah Hendriks et al. Nat Biotechnol. 2023 Nov.

Abstract

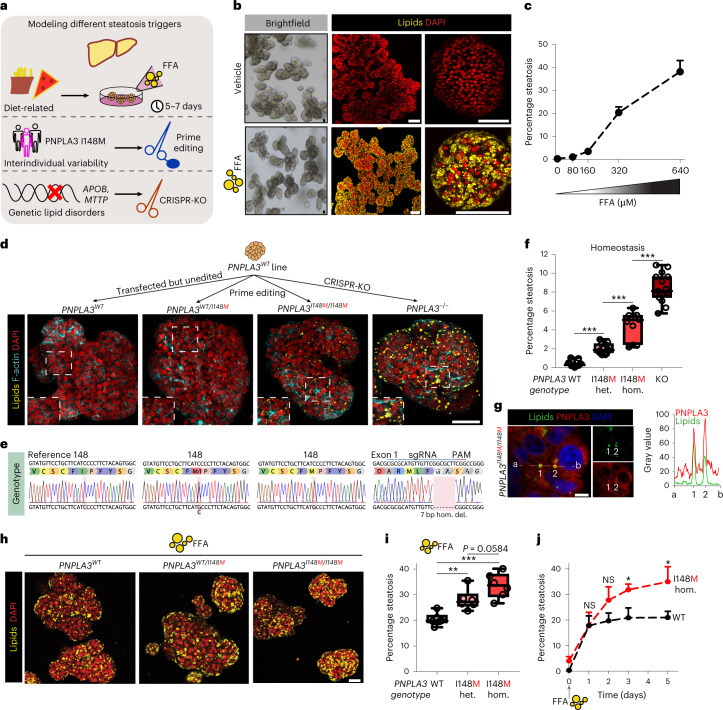
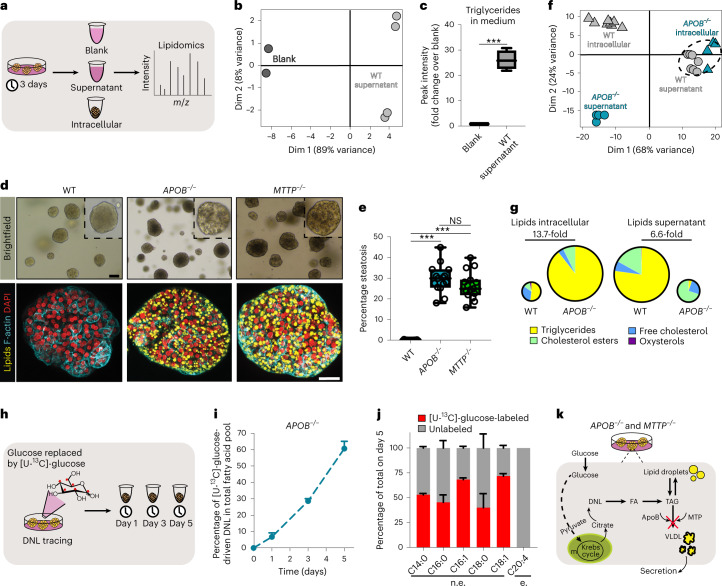
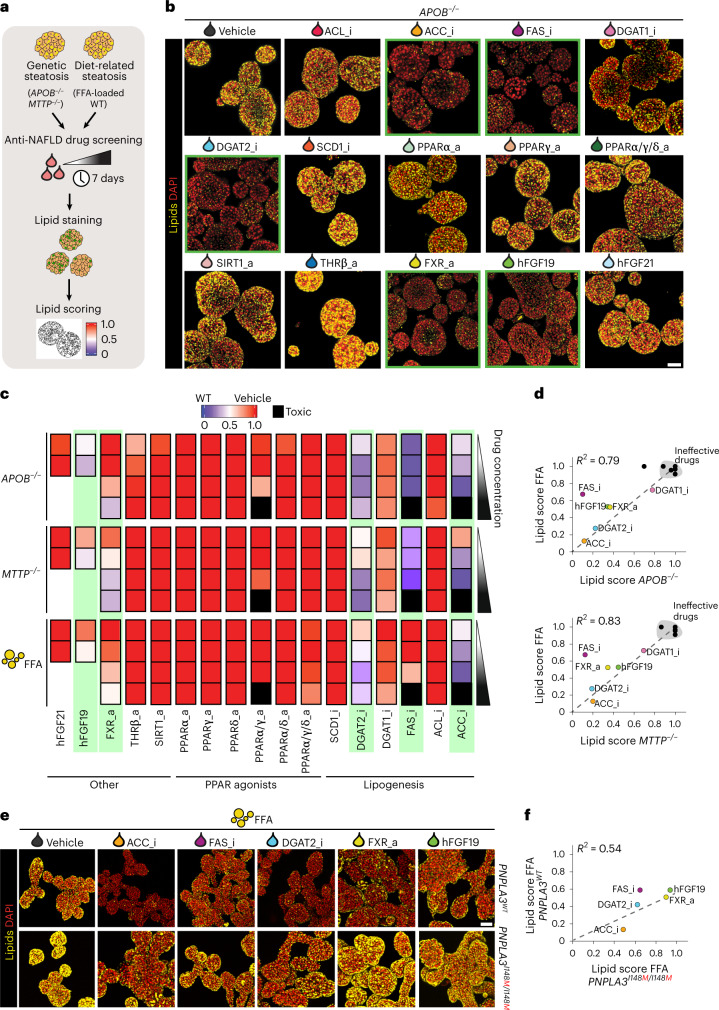
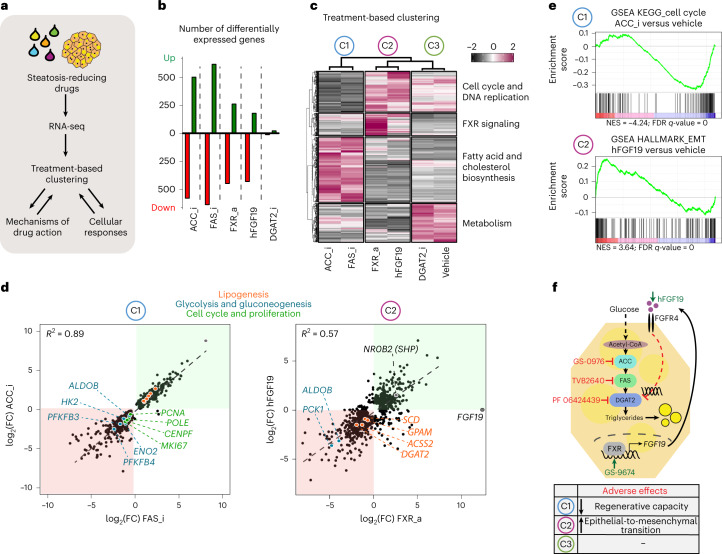
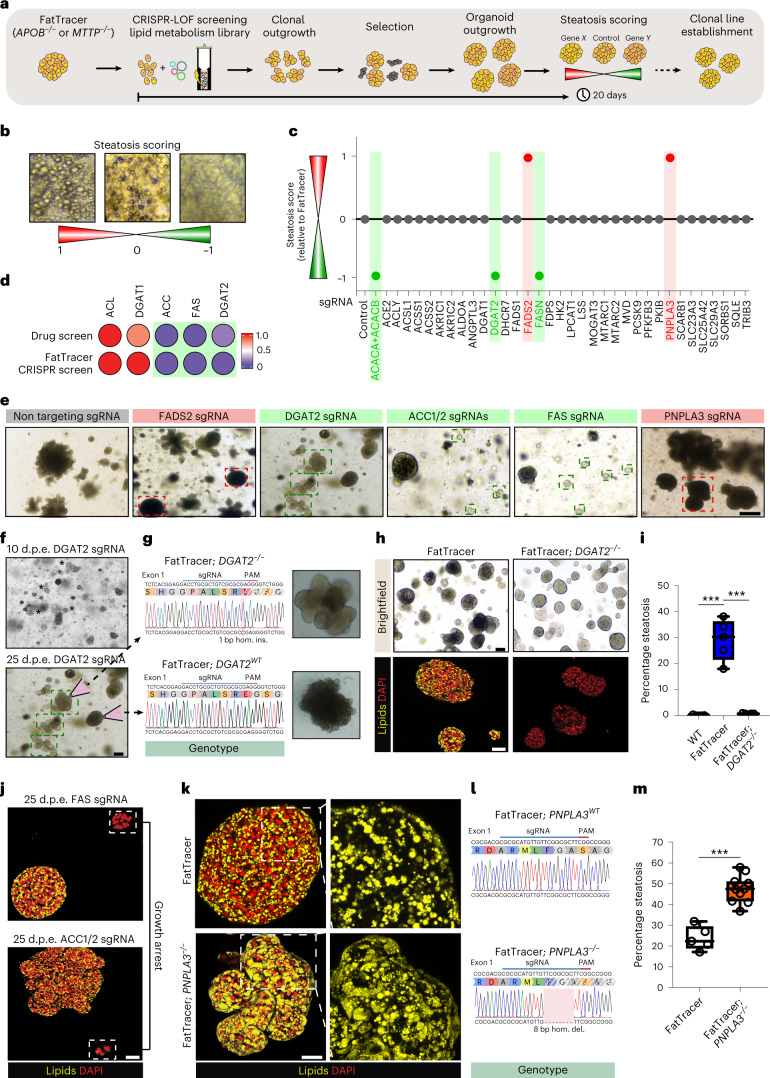
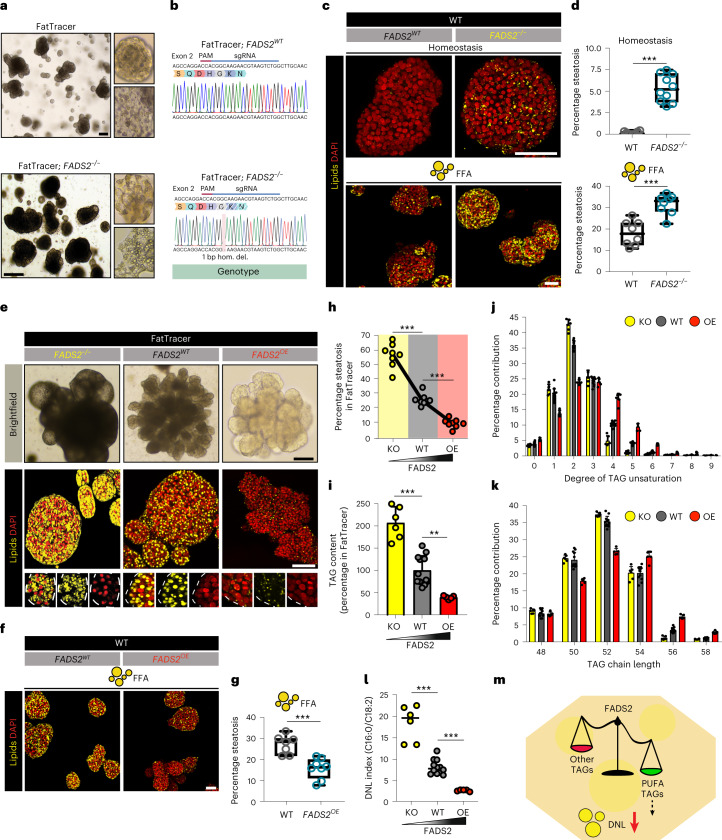
The lack of registered drugs for nonalcoholic fatty liver disease (NAFLD) is partly due to the paucity of human-relevant models for target discovery and compound screening. Here we use human fetal hepatocyte organoids to model the first stage of NAFLD, steatosis, representing three different triggers: free fatty acid loading, interindividual genetic variability (PNPLA3 I148M) and monogenic lipid disorders (APOB and MTTP mutations). Screening of drug candidates revealed compounds effective at resolving steatosis. Mechanistic evaluation of effective drugs uncovered repression of de novo lipogenesis as the convergent molecular pathway. We present FatTracer, a CRISPR screening platform to identify steatosis modulators and putative targets using APOB-/- and MTTP-/- organoids. From a screen targeting 35 genes implicated in lipid metabolism and/or NAFLD risk, FADS2 (fatty acid desaturase 2) emerged as an important determinant of hepatic steatosis. Enhancement of FADS2 expression increases polyunsaturated fatty acid abundancy which, in turn, reduces de novo lipogenesis. These organoid models facilitate study of steatosis etiology and drug targets.


Conflict of interest statement

H.C. is inventor of several patents related to organoid technology; his full disclosure is given at https://www.uu.nl/staff/JCClevers/. D.H., B.A. and H.C. are inventors on a filed patent application related to this work (PCT/NL2022/050641). Near the end of this study, H.C. became head of Pharma, Research and Early Development of F. Hoffmann-La Roche Ltd, Basel, Switzerland. The other authors declare no competing interests.

Figures

Fig. 1
Fig. 1. Precision gene editing in human fetal hepatocyte organoids evaluates genetic predisposition to steatosis.
a, Strategy used to generate a panel of human hepatic steatosis organoid models. b, Brightfield images and Nile Red lipid staining of vehicle-treated and FFA-exposed (640 μM) WT organoids. c, Quantification of the percentage of steatosis after exposure to increasing FFA concentrations in WT organoids (mean ± s.d.). n = 6 independent replicates from two donors. d, Nile Red lipid staining overlaid with phalloidin of PNPLA3 variant organoids generated from the same donor. e, Sanger trace sequences of the PNPLA3 genotypes of PNPLA3 variant organoids. f, Quantification of the percentage of spontaneous steatosis in PNPLA3 variant organoids. n = 11 independent replicates for PNPLA3WT and PNPLA3WT/I148M, n = 10 independent replicates for PNPLA3I148M/I148M, n = 15 independent replicates for PNPLA3KO from either two (WT, WT/I148M, I148M/I148M) or three (KO) clonal lines from two donors. Two-tailed nested t-test: KO versus WT and I148M/I148M versus WT, ***P < 0.0001; I148M/I148M versus WT/I148M, ***P = 0.0001. g, Left, immunofluorescence staining for PNPLA3 and lipid droplet visualization with BioTracker 488 Green Lipid Droplet Dye in PNPLA3I148M/I148M organoids. Right, quantification of the fluorescence signal from a to b through lipid droplets (1 and 2). h, Nile Red lipid staining of FFA-exposed (320 μM) PNPLA3 variant organoids. i, Quantification of the percentage of steatosis following FFA exposure in PNPLA3 variant organoids. n = 6 independent replicates from two clonal lines from two donors per genotype. Two-tailed nested t-test: WT/148M versus WT, **P = 0.0026; I148M/I148M versus WT, ***P = 0.0002; I148M/I148M versus WT/148M, P = 0.0584. j, Quantification of the percentage of steatosis over time after FFA exposure (320 μM) in PNPLA3WT and PNPLA3I148M/I148M organoids generated from the same donor (mean ± s.d.). n = 3 independent replicates per genotype. Two-tailed t-test: day 3, *P = 0.0128; day 5, *P = 0.0191; NS, not significant. f,i, The box indicates the 25–75th percentiles, the center line indicates the median and the whiskers indicate minimum and maximum values. b,d,g,h, Representative of n = 10, 6, 3 and 6 independent experiments, respectively. Scale bars, 100 μm (b), 50 μm (d), 5 μm (g) and 25 μm (h). PAM, protospacer adjacent motif; hom., homozygous; het., heterozygous; del., deletion.
Fig. 2
Fig. 2. Organoid models of DNL-generated lipid accumulation by introduction of APOB or MTTP mutations.
a, Workflow used to perform lipidomics on organoid cultures. b, PCA on neutral lipids found in the supernatant of WT organoids and in blank medium. n = 4 independent measurements in WT organoid cultures from two donors; n = 2 independent measurements for blank medium. c, Quantification of TAG content in the supernatant of WT organoids relative to blank medium. Sample sizes as in b. Two-tailed t-test: ***P = 0.0008. d, Brightfield images and Nile Red lipid staining overlaid with phalloidin of WT, APOB−/− and MTTP−/− organoids. Representative of n = 9 independent experiments. e, Quantification of the percentage of spontaneous steatosis in WT, APOB−/− and MTTP−/− organoids. n = 15 independent replicates from three clonal lines per genotype from three donors. Two-tailed nested t-test: APOB−/− versus WT, ***P < 0.0001; MTTP−/− versus WT, ***P = 0.0002. f, PCA of neutral lipids found intracellularly and in the supernatant of APOB−/− and WT organoids. n = 4 independent measurements in APOB−/− organoid cultures from two donors; n = 8 independent measurements in WT organoid cultures from the same two donors. g, Pie charts indicating the average distribution of different neutral lipid species in WT and APOB−/− organoids. Pie size reflects average FC in total lipid amount. Sample sizes as in f (see also Supplementary Fig. 6c). h, Workflow used to perform DNL tracing using [U-13C]-glucose in APOB−/− organoids. i, Quantification of the percentage of glucose-driven DNL contribution to the fatty acid pool in APOB−/− organoids (mean ± s.d.). n = 2 independent quantifications in APOB−/− organoid cultures from two donors. j, Quantification of the percentage of glucose-driven DNL contribution for five nonessential (n.e.) fatty acids in APOB−/− organoids 5 days post tracing (mean ± s.d.). No labeling is observed for the essential (e.) fatty acid C20:4. Sample size as in i. k, Mechanism of lipid accumulation in APOB−/− and MTTP−/− organoids. c,e, The box indicates the 25–75th percentiles, the center line indicates the median and the whiskers indicate minimum and maximum values. d, Scale bars, 100 μm (brightfield) and 25 μm (fluorescence). Dim, dimension.
Fig. 3
Fig. 3. Capturing drug responses in different organoid models of human hepatic steatosis.
a, Workflow used to perform NAFLD drug screening in the different steatosis organoid models. b, Nile Red lipid staining of APOB−/− organoids after treatment with the different indicated drugs. Green-bordered boxes highlight steatosis-reducing effects. Representative of n = 4 independent experiments using two donors. c, Lipid score analyses of genetic steatosis (APOB−/− and MTTP−/− organoids) and FFA-induced steatosis (FFA-exposed WT organoids) following treatment with the different indicated drugs. Each square represents a concentration, with four increasing concentrations as per the white-to-black triangle; see Supplementary Table 2 for drug concentrations. Black squares indicate drug toxicity (Supplementary Fig. 7e); green boxes highlight effective drugs. An arbitrary color scale ranging from 0 (blue, representing the lipid level in WT organoids) to 1 (red, representing vehicle-treated steatosis organoids from each model) is used. Quantifications represent the average lipid score from n = 3 organoid cultures/drug concentration. d, Correlation plots between lipid scores of APOB−/− organoids (top) and MTTP−/− organoids (bottom) versus those of FFA-exposed WT organoids following treatment with the different indicated drugs at the highest drug concentration, except for ACC_i, FAS_i and PPARα/γ_a, for which the third-highest dose is depicted. The coefficient of determination (R2) is indicated. e, Nile Red lipid staining of PNPLA3WT and PNPLA3I148M/I148M organoids (generated from the same donor) after treatment with selected drugs under FFA-induced steatosis. The most effective drug concentration (as used in d) was used. Representative of n = 2 independent experiments. f, Correlation plots between lipid scores of PNPLA3I148M/I148M organoids versus those of PNPLA3WT organoids following treatment with the selected drugs. Quantifications represent average lipid score from n = 3 organoid cultures/drug. R2 is indicated. b,e, Scale bars, 100 μm.
Fig. 4
Fig. 4. Transcriptome-based treatment clustering reveals steatosis-reducing drug actions and adverse effects.
a, Workflow used to address the drug effects of steatosis-reducing drugs at the whole-transcriptomic level. b, Number of DEGs following different drug treatments relative to vehicle-treated APOB−/− organoids (|log2(FC > 0.5)|, P < 0.005 (Wald test)). Whole-transcriptome analysis is based on sequencing of n = 2 APOB−/− lines from two donors treated with the indicated drugs or vehicle. c, Treatment-based clustering and assignment of biological processes per gene cluster based on all DEGs identified across the different drug treatments. The heatmap depicts representative gene expression levels of one donor in response to the indicated drugs. Similar results were obtained for the other donor. Row z-scores are plotted. d, Correlation plots between the DEGs (|log2(FC > 0.5)|, P < 0.005 (Wald test) in at least one drug treatment) identified in C1 (ACC_i and FAS_i) (left) and C2 (hFGF19 and FXR_a (right)). Green and red boxes highlight common upregulated and downregulated genes, respectively. Selected DEGs belonging to key pathways are highlighted in specific colors as indicated. R2 is indicated. e, Gene set enrichment analysis for genes related to the cell cycle for C1 using ACC_i (n = 125 genes), and for genes related to epithelial-to-mesenchymal transition for C2 using hFGF19 (n = 200 genes) in comparison with vehicle-treated APOB−/− organoids. Normalized enrichment scores (NES) and associated false discovery rate (FDR) q-values are indicated. f, Schematic of the proposed mechanism of action of effective steatosis-reducing drugs. The table indicates identified adverse drug effects per treatment cluster.
Fig. 5
Fig. 5. Development of FatTracer as a CRISPR screening platform identifies steatosis mediators.
a, Strategy used to perform CRISPR-LOF screening in FatTracer. b, Brightfield images exemplifying the steatosis scoring scale, where 0 (white) reflects the baseline steatosis level of FatTracer and 1 (red) and −1 (green) indicate increased and decreased steatosis, respectively. c, CRISPR-LOF screening results of 35 candidates evaluated in FatTracer using the steatosis scoring scale. d, Comparative analysis of results from FatTracer CRISPR-LOF screening and drug screening for the indicated gene targets. The lipid scoring system was used to quantify steatosis levels (Fig. 3c). Green boxes highlight steatosis-reducing effects. e, Brightfield images of outgrowing FatTracer organoids following CRISPR targeting of the indicated genes. Green boxes highlight lighter (fat-free) organoids, red boxes highlight darker (more fatty) organoids. f, Brightfield images of outgrowing FatTracer organoids following CRISPR targeting of DGAT2 10 and 25 days post electroporation (d.p.e.). Asterisks indicate lighter (less lipid-containing) organoids. g, Sanger trace sequences of the picked organoid lines highlighted in f. h, Brightfield images and Nile Red lipid staining of FatTracer and FatTracer; DGAT2−/− organoids. i, Quantification of the percentage of steatosis in FatTracer, FatTracer; DGAT2−/− and WT organoids (all from the same donor). n = 5 independent replicates per genotype. Two-tailed t-test, ***P < 0.0001. j, Nile Red lipid staining of outgrowing FatTracer organoids following CRISPR targeting of FASN or ACACA + ACACB 25 d.p.e. k, Nile Red lipid staining of FatTracer and FatTracer; PNPLA3−/− organoid lines. l, Sanger trace sequences of PNPLA3 genotypes of the organoid cultures shown in k. m, Quantification of the steatosis level in FatTracer and FatTracer; PNPLA3−/− organoids. n = 11 independent replicates from three FatTracer; PNPLA3−/− clonal lines; n = 5 independent replicates from the parental FatTracer line. Two-tailed t-test, ***P < 0.0001. i,m, The box indicates the 25–75th percentiles, the center line indicates the median and the whiskers indicate minimum and maximum values. e,f,h,j,k, Representative of n = 3, 6, 6, 3 and 4 independent experiments, respectively, using both APOB−/− and MTTP−/− organoids from two donors as FatTracer. Scale bars, 100 μm (e,f), 200 μm (brightfield) and 50 μm (fluorescence) (h), 50 μm (j) and 25 μm (k).
Fig. 6
Fig. 6. FADS2 is a key modulator of steatosis levels in human hepatocytes.
a, Brightfield images of FatTracer and FatTracer; FADS2−/− organoids. b, Sanger trace sequences of FADS2 genotypes of the organoid cultures shown in a. c, Nile Red lipid staining of FADS2WT and FADS2−/− organoids in homeostasis and following FFA exposure (320 μM). d, Quantification of the percentage of steatosis in homeostasis (top) and after FFA exposure (320 μM) (bottom) in FADS2WT and FADS2−/− organoids. n = 10 (homeostasis) and n = 8 (FFA) independent replicates from two clonal lines per genotype from two donors. Two-tailed nested t-test: homeostasis, ***P < 0.0001; FFA, ***P = 0.0001. e, Brightfield images and Nile Red lipid staining of FADS2 variant FatTracer organoids. f, Nile Red lipid staining of FADS2WT and FADS2OE organoids after FFA exposure (500 μM). g, Quantification of the percentage of steatosis after FFA exposure (500 μM) in FADS2WT and FADS2OE organoids. n = 7 independent replicates for FADS2WT, n = 8 independent replicates for FADS2OE from two clonal lines per genotype from two donors. Two-tailed nested t-test: ***P = 0.0004. h, Quantification of the percentage of steatosis in FADS2 variant FatTracer organoids. n = 8 independent replicates from two different clonal lines per genotype from two donors. Two-tailed nested t-test: ***P < 0.0001. i, Quantification of TAG content in FatTracer following FADS2−/− and FADS2OE relative to FADS2WT (mean ± s.d.). n = 6 independent measurements in three clonal lines from two donors for FatTracer; FADS2−/− and FatTracer; FADS2OE; n = 12 independent measurements in FatTracer; FADS2WT from the same two donors. Two-tailed t-test: KO versus WT, ***P < 0.0001; OE versus WT, **P = 0.0011. j,k, Relative distribution of degree of TAG unsaturation (j) and chain length (k) in FADS2 variant FatTracer organoids (mean ± s.d.). l, Quantification of DNL index (C16:0/C18:2 ratio) based on the fatty acid composition of the TAG in FADS2 variant FatTracer organoids. Two-tailed t-test, ***P < 0.0001. jl, Sample sizes as in i. m, Proposed role of FADS2 in regulation of hepatic steatosis. d,g, The box indicates the 25–75th percentiles, the center line indicates the median and the whiskers indicate minimum and maximum values. a,c,e,f, Representative of n = 4, 3, 4 and 3 independent experiments, respectively. Scale bars, 200 μm (a), 50 μm (c,e,f).

Comment in

References

    1. Younossi ZM, et al. Global epidemiology of nonalcoholic fatty liver disease—meta-analytic assessment of prevalence, incidence, and outcomes. Hepatology. 2016;64:73–84. doi: 10.1002/hep.28431. - DOI - PubMed
    1. Loomba R, Friedman SL, Shulman GI. Mechanisms and disease consequences of nonalcoholic fatty liver disease. Cell. 2021;184:2537–2564. doi: 10.1016/j.cell.2021.04.015. - DOI - PubMed
    1. Stefan N, Häring H-U, Cusi K. Non-alcoholic fatty liver disease: causes, diagnosis, cardiometabolic consequences, and treatment strategies. Lancet Diabetes Endocrinol. 2019;7:313–324. doi: 10.1016/S2213-8587(18)30154-2. - DOI - PubMed
    1. Younossi Z, et al. Global perspectives on nonalcoholic fatty liver disease and nonalcoholic steatohepatitis. Hepatology. 2019;69:2672–2682. doi: 10.1002/hep.30251. - DOI - PubMed
    1. Eslam M, George J. Genetic contributions to NAFLD: leveraging shared genetics to uncover systems biology. Nat. Rev. Gastroenterol. Hepatol. 2020;17:40–52. doi: 10.1038/s41575-019-0212-0. - DOI - PubMed

MeSH terms

Substances