. 2023 Nov;41(11):1633-1644.
doi: 10.1038/s41587-023-01688-w. Epub 2023 Feb 23.

Extending and improving metagenomic taxonomic profiling with uncharacterized species using MetaPhlAn 4

Affiliations

Extending and improving metagenomic taxonomic profiling with uncharacterized species using MetaPhlAn 4

Aitor Blanco-Míguez et al. Nat Biotechnol. 2023 Nov.

Abstract

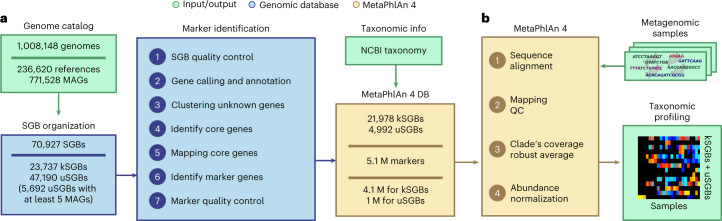
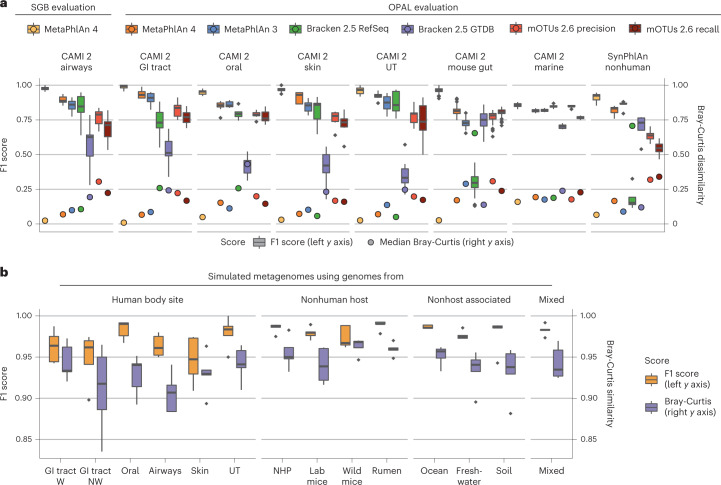
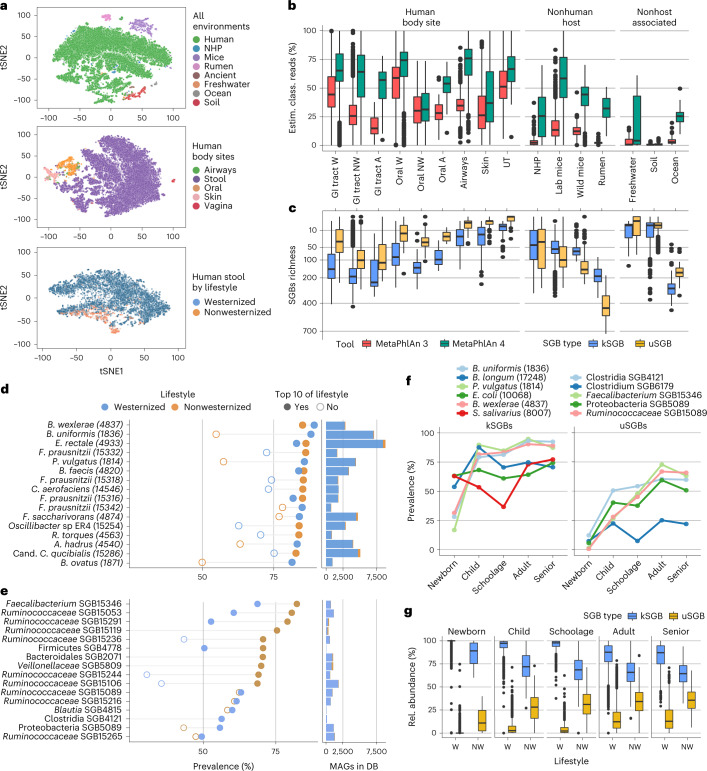
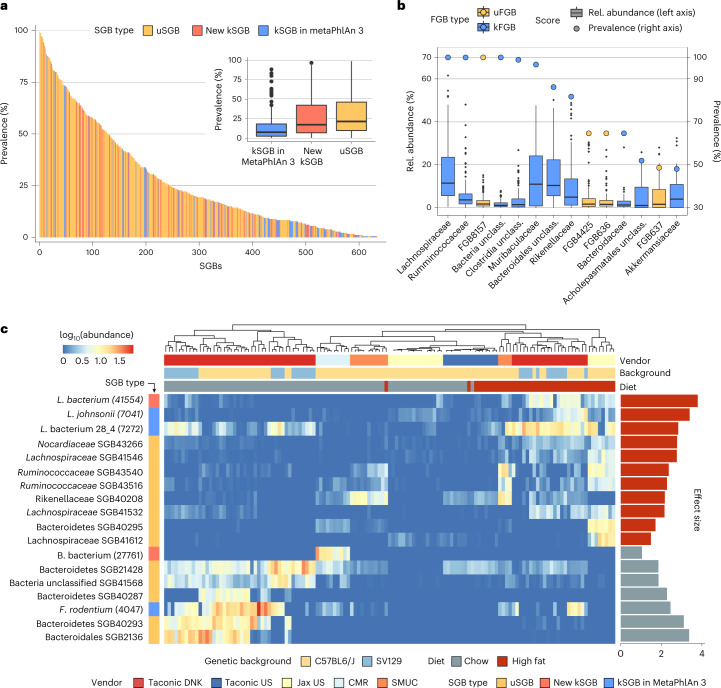
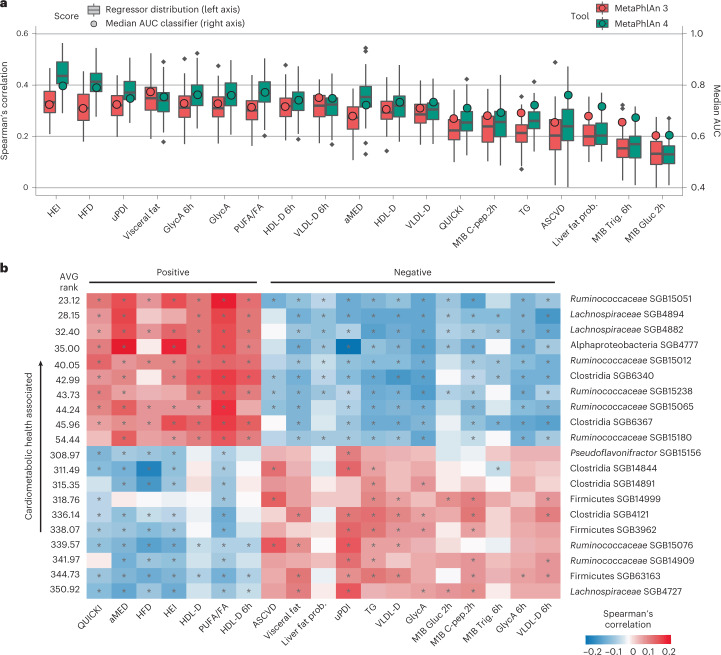
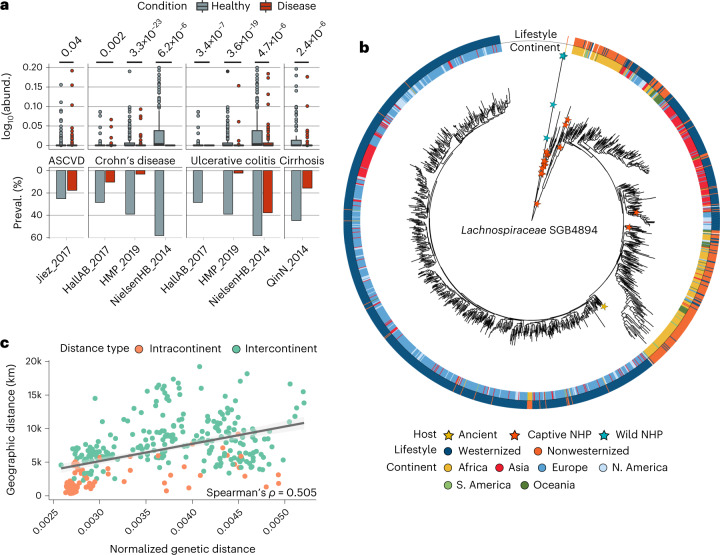
Metagenomic assembly enables new organism discovery from microbial communities, but it can only capture few abundant organisms from most metagenomes. Here we present MetaPhlAn 4, which integrates information from metagenome assemblies and microbial isolate genomes for more comprehensive metagenomic taxonomic profiling. From a curated collection of 1.01 M prokaryotic reference and metagenome-assembled genomes, we define unique marker genes for 26,970 species-level genome bins, 4,992 of them taxonomically unidentified at the species level. MetaPhlAn 4 explains ~20% more reads in most international human gut microbiomes and >40% in less-characterized environments such as the rumen microbiome and proves more accurate than available alternatives on synthetic evaluations while also reliably quantifying organisms with no cultured isolates. Application of the method to >24,500 metagenomes highlights previously undetected species to be strong biomarkers for host conditions and lifestyles in human and mouse microbiomes and shows that even previously uncharacterized species can be genetically profiled at the resolution of single microbial strains.


Conflict of interest statement

S.E.B., T.D.S., F.A. and N.S. are consultants to Zoe Global. F.G, R.D. and J.W. are employees of Zoe Global. The other authors declare no competing interests.

Figures

Fig. 1
Fig. 1. MetaPhlAn 4 integrates reference sequences from isolate and metagenome-assembled genomes for metagenome taxonomic profiling.
a, From a collection of 1.01 M bacterial and archeal reference genomes and metagenomic-assembled genomes (MAGs) spanning 70,927 species-level genome bins (SGBs), our pipeline defined 5.1 M unique SGB-specific marker genes that are used by MetaPhlAn 4 (avg., 189 ± 34 per SGB). b, The expanded marker database allows MetaPhlAn 4 to detect the presence and estimate the relative abundance of 26,970 SGBs, 4,992 of which are candidate species without reference sequences (uSGBs) defined by at least five MAGs. The profiling is performed firstly by (1) aligning the reads of input metagenomes against the markers database, then (2) discarding low-quality alignments and (3) calculating the robust average coverage of the markers in each SGB that (4) are normalized across SGBs to report the SGB relative abundances (see Methods). All data are presented as mean ± s.d.
Fig. 2
Fig. 2. MetaPhlAn 4 improves sensitivity and specificity of metagenome taxonomic profiling.
a, To evaluate its performance in taxonomic profiling, MetaPhlAn 4 was applied to synthetic metagenomes representing host-associated communities from the CAMI 2 taxonomic profiling challenge (n = 128 samples) and the SynPhlAn-nonhuman dataset (n = 5 samples), representing more diverse environments from previous evaluations. Species-level evaluation using the OPAL framework shows that MetaPhlAn 4 is more accurate than the available alternatives in both the detection of which taxa are present (the F1 score is the harmonic mean of the precision and recall of detection) and their quantitative estimation (the BC beta-diversity is computed between the estimated profiles and the abundances in the gold standard). Additional evaluations performed using genomes within the SGB organization (labeled ‘SGB evaluation’; see Methods) show that MetaPhlAn 4 further improves accuracy at this more refined taxonomic level. See Supplementary Tables 5 and 7 for more details (GI, gastrointestinal; UT, urogenital tract). b, MetaPhlAn 4 was applied to synthetic metagenomes (n = 70 samples) modeling different host and nonhost-associated environments and containing, on average, 47 genomes from both kSGBs and uSGBs (see Methods). This evaluation directly on SGBs shows the reliability of MetaPhlAn 4 to quantify both known and unknown microbial species. Additional evaluation based on a mixture of new MAGs from samples not considered in the building of the genomic database (mixed evaluation, n = 5 samples) stresses its accuracy independently from the inclusion of the profiled data in the database. See Supplementary Tables 9 and 10 for more details (NHP = nonhuman primates, W = westernized, NW = nonwesternized). Box plots in a and b show the median (center), 25th/75th percentile (lower/upper hinges), 1.5× interquartile range (whiskers) and outliers (points).
Fig. 3
Fig. 3. MetaPhlAn 4 expands observable microbial diversity, primarily by quantifying yet-to-be-characterized species (uSGBs).
a, We applied MetaPhlAn 4 profiling to a total of 24.5 k metagenomic samples from diverse environments, highlighting its ability to detect microbiome compositions and clear differences between them, even when considering distinct human body sites and variable host lifestyles (Supplementary Fig. 5b and Supplementary Table 11). b, The expanded genomic database of MetaPhlAn 4 substantially increases the estimated fraction of classified reads in comparison with the previous MetaPhlAn version across habitat types (n = 24,515 samples). c, MetaPhlAn 4 detects on average 48 unknown bacterial species (uSGBs) per human gut microbiome, and reaches up to more than 700 in other nonhuman environments (n = 24,515 samples). d, The most prevalent microbial species in the gastrointestinal tract of westernized populations are known species (kSGBs). The ten most prevalent kSGBs in westernized and nonwesternized lifestyles are shown ordered by their highest prevalence and reported together with the number of MAGs assembled from human gut metagenomes in the MetaPhlAn genome catalog. Species names are shown together with their SGB ID between brackets. e, The most prevalent SGBs in nonwesternized populations belong to yet-to-be-cultivated and named species. The ten most prevalent uSGBs of each lifestyle are shown ordered by their highest prevalence. f, In westernized populations, the most prevalent kSGBs and uSGBs vary across age categories. The two most prevalent SGBs for each age category are shown. g, The fraction of uSGBs relative to kSGB increases after infancy (n = 19,468). Box plots in b, c and g show the median (center), 25th/75th percentile (lower/upper hinges), 1.5× interquartile range (whiskers) and outliers (points). NHP, nonhuman primates; W, westernized; NW, nonwesternized; A, ancient.
Fig. 4
Fig. 4. MetaPhlAn 4 enables accurate metagenomic profiling of mouse microbiomes containing few cultured isolate taxa.
a, MetaPhlAn 4 taxonomic profiling of a cohort of mouse gut microbiome samples (n = 181 samples), spanning eight genetic backgrounds and six different vendors revealed that the majority of detected microbial taxa are uncharacterized SGBs (uSGBs) that do not contain a sequenced isolate representative. b, Some of the most prevalent families in the mouse gut microbiome (n = 181 samples) are still unclassified at the family level (uFGBs). FGBs detected in at least 20% of the samples (circles and right-side y axis) and with a median relative abundance above 1% (box plots and left-side y axis) are shown. c, Random effects models applied to the MetaPhlAn 4 profiles revealed that most of the high- and low-fat diet microbial biomarkers are uncharacterized species (FDR < 0.2). log10-transformed relative abundances of the microbial biomarkers are represented in the heatmap and their effect size (linear model beta coefficient) in the bar plots. For kSGBs, species names are shown together with their SGB ID between brackets. SGB41568 is reported in NCBI as assigned to an unclassified phylum, and we thus report only the kingdom label. SMUC = Southern Medical University in China, CMR = Craniofacial Mutant Resource at the Jackson Laboratory (Jax). Box plots in a and b show the median (center), 25th/75th percentile (lower/upper hinges), 1.5× interquartile range (whiskers) and outliers (points).
Fig. 5
Fig. 5. MetaPhlAn 4 reveals strong links between the unknown fraction of the human gut microbiome and host diet and cardiometabolic markers.
a, Compared to the original results from the ZOE PREDICT 1 study based on the MetaPhlAn 3 taxonomic profiles, random forest (RF) models trained on the MetaPhlAn 4 microbiome profiles (n = 1,001 samples) substantially improve classification (circles and right-side y axis) and regression (box plots and left-side y axis) result for a panel of 19 markers representative of nutritional and cardiometabolic health (see Methods). Box plots show the median (center), 25th/75th percentile (lower/upper hinges), 1.5× interquartile range (whiskers) and outliers (points.) b, Panel of the 20 unknown microbial species (uSGBs) showing the strongest overall correlations with the positive (top-half list) and negative (bottom-half list) dietary and cardiometabolic health markers, respectively (FDR < 0.2).
Fig. 6
Fig. 6. StrainPhlAn 4 accurately reconstructs large-scale strain-level phylogenies of uncharacterized microbial species.
a, Relative abundances (box plots and top-part y axis) and prevalences (bar plots and bottom-part y axis) of the uncharacterized species (uSGB) Lachnospiraceae SGB4894 are substantially higher in healthy individuals (n = 738 samples) in comparison with patients suffering from several gastrointestinal related diseases (n = 1,183 samples), and this difference is reproducible across populations (one-sided Mann–Whitney U test). Box plots show the median (center), 25th/75th percentile (lower/upper hinges), 1.5× interquartile range (whiskers) and outliers (points). b, Lachnospiraceae SGB4894 shows within-species genetic diversity strongly linked to geographic origin and lifestyle. c, Pairwise geographic distances between strains of different countries correlate with their median genetic distances (Spearman’s ρ = 0.505; see Methods), suggesting that human Lachnospiraceae SGB4894 strains could have followed an isolation-by-distance pattern.

References

    1. Quince C, Walker AW, Simpson JT, Loman NJ, Segata N. Shotgun metagenomics, from sampling to analysis. Nat. Biotechnol. 2017;35:833–844. doi: 10.1038/nbt.3935. - DOI - PubMed
    1. Segata N, et al. Metagenomic microbial community profiling using unique clade-specific marker genes. Nat. Methods. 2012;9:811–814. doi: 10.1038/nmeth.2066. - DOI - PMC - PubMed
    1. Truong DT, et al. MetaPhlAn2 for enhanced metagenomic taxonomic profiling. Nat. Methods. 2015;12:902–903. doi: 10.1038/nmeth.3589. - DOI - PubMed
    1. Beghini F, et al. Integrating taxonomic, functional, and strain-level profiling of diverse microbial communities with bioBakery 3. eLife. 2021;10:e65088. doi: 10.7554/eLife.65088. - DOI - PMC - PubMed
    1. Lu J, Breitwieser FP, Thielen P, Salzberg SL. Bracken: estimating species abundance in metagenomics data. PeerJ Comput. Sci. 2017;3:e104. doi: 10.7717/peerj-cs.104. - DOI