

Measuring visual information gathering in individuals with ultra low vision using virtual reality
- PMID: 36823360
- PMCID: PMC9950080
- DOI: 10.1038/s41598-023-30249-z
Measuring visual information gathering in individuals with ultra low vision using virtual reality
Abstract
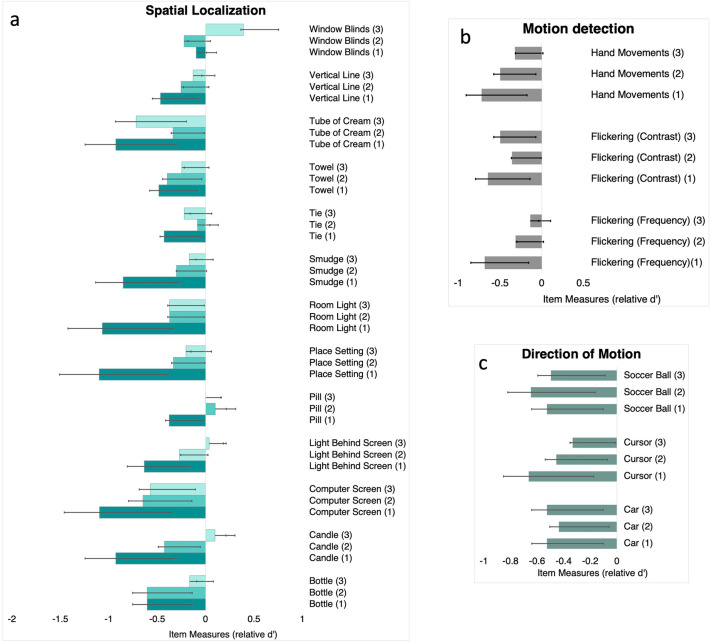
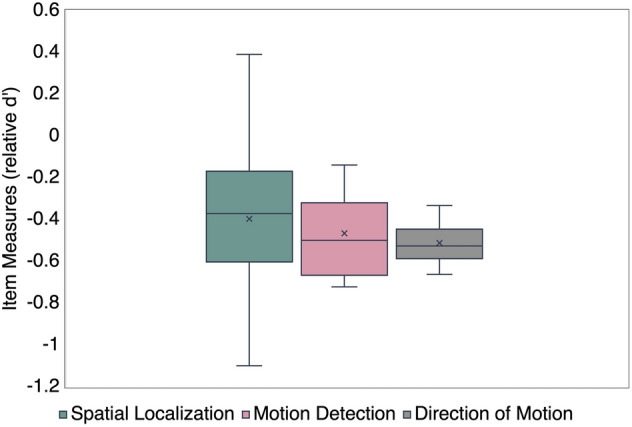
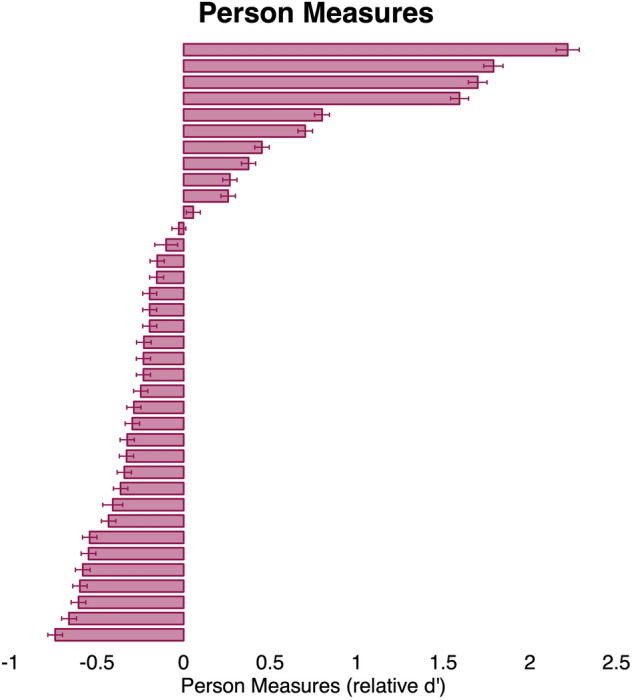
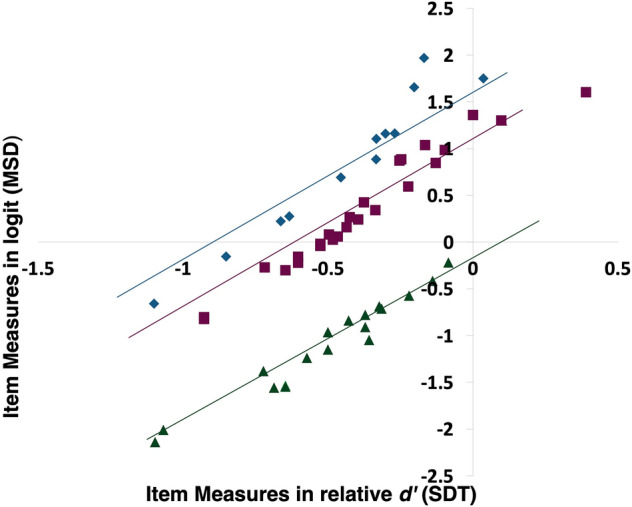
People with ULV (visual acuity ≤ 20/1600 or 1.9 logMAR) lack form vision but have rudimentary levels of vision that can be used for a range of activities in daily life. However, current clinical tests are designed to assess form vision and do not provide information about the range of visually guided activities that can be performed in daily life using ULV. This is important to know given the growing number of clinical trials that recruit individuals with ULV (e.g., gene therapy, stem cell therapy) or restore vision to the ULV range in the blind (visual prosthesis). In this study, we develop a set of 19 activities (items) in virtual reality involving spatial localization/detection, motion detection, and direction of motion that can be used to assess visual performance in people with ULV. We estimated measures of item difficulty and person ability on a relative d prime (d') axis using a signal detection theory based analysis for latent variables. The items represented a range of difficulty levels (- 1.09 to 0.39 in relative d') in a heterogeneous group of individuals with ULV (- 0.74 to 2.2 in relative d') showing the instrument's utility as an outcome measure in clinical trials.
© 2023. The Author(s).
Conflict of interest statement
The assessment module described in this paper is being licensed under the name Wilmer VRI by Johns Hopkins Technology Ventures. Authors GD and AK stand to benefit financially from such licensing and therefore wish to disclose this as a potential conflict of interest. All other authors have no competing interests. Academic researchers may qualify for use under a no-cost material transfer agreement with their institution.
Figures


Similar articles
-
Self-Reported Visual Ability Versus Task Performance in Individuals With Ultra-Low Vision.Transl Vis Sci Technol. 2023 Oct 3;12(10):14. doi: 10.1167/tvst.12.10.14. Transl Vis Sci Technol. 2023. PMID: 37847202 Free PMC article.
-
Measuring visually guided motor performance in ultra low vision using virtual reality.Front Neurosci. 2023 Dec 20;17:1251935. doi: 10.3389/fnins.2023.1251935. eCollection 2023. Front Neurosci. 2023. PMID: 38178831 Free PMC article.
-
Development of The Chinese Version of Ultra-Low Vision Visual Functioning Questionnaire-150.Transl Vis Sci Technol. 2023 Jun 1;12(6):9. doi: 10.1167/tvst.12.6.9. Transl Vis Sci Technol. 2023. PMID: 37310736 Free PMC article.
-
The use of augmented reality and virtual reality for visual field expansion and visual acuity improvement in low vision rehabilitation: a systematic review.Graefes Arch Clin Exp Ophthalmol. 2023 Jun;261(6):1743-1755. doi: 10.1007/s00417-022-05972-4. Epub 2023 Jan 12. Graefes Arch Clin Exp Ophthalmol. 2023. PMID: 36633669
-
Virtual reality simulation training for health professions trainees in gastrointestinal endoscopy.Cochrane Database Syst Rev. 2018 Aug 17;8(8):CD008237. doi: 10.1002/14651858.CD008237.pub3. Cochrane Database Syst Rev. 2018. PMID: 30117156 Free PMC article.
Cited by
-
Self-Reported Visual Ability Versus Task Performance in Individuals With Ultra-Low Vision.Transl Vis Sci Technol. 2023 Oct 3;12(10):14. doi: 10.1167/tvst.12.10.14. Transl Vis Sci Technol. 2023. PMID: 37847202 Free PMC article.
-
Measuring visually guided motor performance in ultra low vision using virtual reality.Front Neurosci. 2023 Dec 20;17:1251935. doi: 10.3389/fnins.2023.1251935. eCollection 2023. Front Neurosci. 2023. PMID: 38178831 Free PMC article.
-
Update on Clinical Trial Endpoints in Gene Therapy Trials for Inherited Retinal Diseases.J Clin Med. 2024 Sep 18;13(18):5512. doi: 10.3390/jcm13185512. J Clin Med. 2024. PMID: 39336999 Free PMC article. Review.
References
Publication types
MeSH terms
Grants and funding
LinkOut - more resources
Full Text Sources
