. 2023 May;30(5):1235-1246.
doi: 10.1038/s41418-023-01132-1. Epub 2023 Feb 23.

Lineage tracing of mutant granulosa cells reveals in vivo protective mechanisms that prevent granulosa cell tumorigenesis

Affiliations

Lineage tracing of mutant granulosa cells reveals in vivo protective mechanisms that prevent granulosa cell tumorigenesis

Shudong Niu et al. Cell Death Differ. 2023 May.

Abstract

Ovarian granulosa cell tumors (GCTs) originate from granulosa cells (GCs) and represent the most common sex cord-stromal tumor in humans. However, the developmental regulations and molecular mechanisms underlying their etiology are largely unknown. In the current study, we combined a multi-fluorescent reporter mouse model with a conditional knockout mouse model, in which the tumor suppressor genes Pten and p27 were deleted in GCs, to perform cell lineage tracing of mutant GCs. We found that only 30% of ovaries with substantial mutant GCs developed into GCTs that derived from a single mutant GC. In-depth molecular analysis of the process of tumorigenesis demonstrated that up-regulation of immune evasion genes Cd24a and Cd47 led, in part, to the transition of mutant GCs to GCTs. Therefore, treatment with the Cd47 inhibitor RRX-001 was tested and found to efficiently suppress the growth of GCTs in vivo. Together, our study has revealed an immune evasion mechanism via CD24/CD47 upregulation to GCT formation, shedding light on the future potential clinical therapies for GCTs.


Conflict of interest statement

The authors declare no competing interests.

Figures
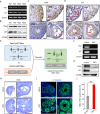
Fig. 1
Fig. 1. Deleting Pten and p27 from granulosa cells (GCs) to establish an inducible GC mutant mouse model.
A PCR results of Pten and p27 transcripts in ovaries on different postnatal days (PDs) as indicated, showing a continuous transcription of both genes in the ovaries from newborn to adult. B Immunoblot of PTEN and P27 in ovaries on different PDs as indicated, showing a continuous expression of both proteins in the ovaries from newborn to adult. Immunohistochemistry of PTEN (C) and P27 (D) on PD1, PD5, PD23, and PD35, demonstrating a clear distribution of both proteins in (pre-)GCs from newborn to adult. Red arrows indicate (pre-)GCs. Scale bars: 100 μm. E Schematic diagram of the Ptenfl/fl, p27fl/fl, and Foxl2-CreERT2 alleles and the conditional double knockout (DKO) mouse generated upon tamoxifen (Tam) administration on PD1, PD3, and PD5. F PCR results of Pten and p27 in NoCre control and DKO GC genome DNA, revealing the efficient knockout of both genes in DKO GCs. G Immunoblot of PTEN and P27 in NoCre control and DKO GCs on PD23, revealing no expression of either protein in DKO GCs. H Representative hematoxylin-stained sections from NoCre control and DKO ovaries on PD35, showing numerous growing follicles developing in the ovaries of a DKO mouse one month after completion of Tam treatment, as described above. The boxed regions in the left panels are magnified in the right panels. Scale bar: 500 μm. I Immunofluorescence staining with KI67 (proliferation marker, green) and Hoechst (nuclear stain, blue) of ovaries from NoCre control and DKO mice on PD35, illustrating the excessive proliferative activity of the mutant GCs in the ovaries of DKO mice. Scale bar:  100 μm. J Statistical results of KI67-positive cells in follicles at the developmental stage from ovaries of NoCre control and DKO mice, confirming the conclusion stated in I. Data represent mean ± SD from three mice of each genetic background. **P < 0.01, unpaired t test.
Fig. 2
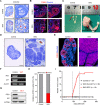
Fig. 2. GCTs formed in DKO females with relatively low incidence in a short time frame.
A Representative hematoxylin-stained sections of ovaries from NoCre control mice and DKO mice at two months after completion of Tam treatment, showing numerous cyst-like structures with cavities appearing in the ovaries of DKO mice. C indicates cyst-like structures. Red arrows indicate residual cells. The boxed regions in the left panels are magnified in the right panels. Scale bar: 500 μm. B Immunofluorescence staining of FOXL2 (GC marker, red) and Hoechst (nuclear stain, blue) in ovaries of NoCre control and DKO mice, showing residual cells were FOXL2 positive. The boxed regions in the left panels are magnified in the right panels. C indicates cyst-like structures. The red arrow indicates residual FOXL2-positive cells. Scale bar: 100 μm. C Representative images of genital ducts and ovaries dissected from NoCre control and DKO mice, showing an ovarian tumor that developed in a DKO mouse at three to four months. Red arrows indicate the normal ovary (left) and ovarian tumor (right). D Representative hematoxylin-stained sections of ovaries showing nest structures with clear outlines in a DKO ovarian tumor compared to a control ovary dissected from a NoCre control mouse of similar age. Scale bar: 500 μm. E Immunofluorescence staining of FOXL2 (red) and Hoechst (blue) in ovaries of NoCre control and DKO mice, showing that the tumor cells that developed in DKO females were FOXL2 positive. Scale bar: 100 μm. F PCR results showing that there was no Pten or p27 in the GCT cell genome DNA from DKO mice compared to the NoCre control GC genome DNA. G Immunoblot results showing that PTEN and P27 were not expressed in GCT cells from DKO mice compared to NoCre control mice GCs. H Statistical results showing that the incidence of GCTs in DKO mouse ovaries was 33.3% (19/57) during the nine months of tracing. I Statistical results showing the number of GCT cases detected at the indicated days, illustrating that GCT tumorigenesis was concentrated in a short time frame from three to four months.
Fig. 3
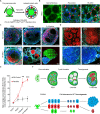
Fig. 3. Granulosa cell tumor (GCT) nests are derived from single mutant granulosa cells (GCs) in DKO females.
A Schematic diagram depicting the lineage tracing strategy using Rb-DKO (Foxl2-CreERT2;Ptenfl/fl;p27fl/fl;Rainbow) mice. B Fluorescent detection in cross-sectioned ovaries from NoCre;Rainbow, Rb-Control, and Rb-DKO mice on PD10 with tamoxifen (Tam) induction on PD1, PD3, and PD5, showing specific and random labeling of GCs in ovaries of Rb-Control and Rb-DKO mice. C Fluorescent detection of randomly labeled GCs in ovaries from Rb-Control and Rb-DKO mice after Tam induction (PD1, PD3, and PD5) at indicated time points, revealing a clear single-cell origin pattern of GCT nests in Rb-DKO females. D Fluorescent detection in Rb-DKO mice three to four months after Tam treatment, showing single-color labeling of cysts in GCTs, which demonstrates that one mutant GC is enough to form a GCT in Rb-DKO females. E Statistical results of single-colored follicles, cysts, or nests determined at the indicated times in mice from each treatment group (n = 3 mice/group), confirming the conclusion stated in C and D. Data represent means ± SD, **P < 0.01, ***P < 0.001, two-way ANOVA. F Upper panel shows a schematic diagram illustrating the process of GCT formation: each GCT nest derives from a single mutant GC, and one mutant GC is enough to form a GCT. The lower panel shows a schematic diagram depicting a potential cleaning mechanism utilized during the development of mutant GCs into tumor cells. Most mutant GCs are removed by an internal cleaning mechanism, leaving a few mutant GCs to form GCTs by gaining unknown factors.
Fig. 4
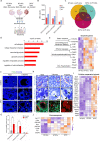
Fig. 4. Apoptosis and PGCCs formation contribute to single cell derivation of GCT.
A Schematic diagram depicting the process used to conduct RNA-Seq analysis on cells from the indicated types of ovaries (n = 3 for each group). B Bar graph of the number of differentially expressed genes (DEGs) found when WT-GCs, MT-GCs, and GCTs were compared, showing that GCTs and MT-GCs shared the lowest number of DEGs among the three compared groups. C Venn diagram showing the number of DEGs in the MT-GCs vs. WT-GCs, GCTs vs. WT-GCs, and GCTs vs. MT-GCs comparisons, revealing that 1,760 DEGs were up/downregulated in GCTs compared to those in WT-GCs and MT-GCs. D Significantly enriched pathways of the up-regulated differentially expressed genes (DEGs) between GCTs and the other two groups. Data were analyzed by DAVID Bioinformatics Resources 6.8 for Gene Ontology (GO) enrichment analysis of DEGs. GO terms with corrected P-values that lower than 0.05 were considered significantly enriched by DEGs. E Heat map of apoptotic genes in WT-GCs, MT-GCs and GCTs groups, showing upregulation of apoptosis related genes during tumorigenesis. F TUNEL detection in ovaries of No-Cre control and DKO mice, demonstrating the upregulation of apoptosis signals during cyst formation. Representative images are shown. Scale bar: 100 μm. G Statistical results of F. Data represent mean ± SD. *P < 0.05, unpaired t test. H Hematoxylin staining and fluorescent detection of ovaries at different developmental stage of Rb-DKO ovaries, showing PGCCs (arrowheads) formation was involved in the tumor formation. Boxed regions in upper panels are magnified in the lower panels. Scale bar: 10 μm. I Heat map of genes responses to hypoxia among WT-GCs, MT-GCs and GCTs, indicating a high level of hypoxia response in GCTs. J Heat map of stemness genes among WT-GCs, MT-GCs and GCTs, illustrating cancer stem cells were involved in tumor formation and progression.
Fig. 5
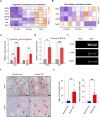
Fig. 5. Immune evasion is involved in GCT formation.
A Heat map revealing increased expressions of Cd24a and Cd47 in GCT cells. B Heat map of regulation of macrophage polarization markers associated genes in different groups, indicating the imbalance of M1/M2 macrophages in the GCTs. C q-PCR analysis of Cd24a and Cd47 expression in indicated groups, confirming the transcriptomic result of high Cd24a and Cd47 mRNA levels in GCT cells. Data indicate means ± SD; **P < 0.01; ***P < 0.001, two-way ANOVA. D Relative Cd24a and Cd47 mRNA expression levels in the non-tumor DKO ovaries and GCTs, showing higher expression levels of both Cd24a and Cd47 in GCTs than that in the non-tumor DKO ovaries. Data indicate means ± SD, *P < 0.05; ***p < 0.001, unpaired t test. E PCR results of CD47 and CD24 transcripts in the KGN cell compared to the control, showing the expression of CD47 and CD24 in KGN cell line. Blank: negative control. F Immunochemistry staining of CD47 (arrows) and CD24 (arrowheads) in human normal ovaries and GCTs, showing more CD47 and CD24 positive cells in the GCT tissues. Scale bar: 100 μm. G Statistic results of F. Data represent mean ± SD. **P < 0.01, unpaired t test.
Fig. 6
Fig. 6. In vivo inhibition of Cd47 results in a reduction of tumor growth.
A Relative mRNA expression levels of Cd24a and Cd47 in in vitro cultured GCT cells treated with RRX-001, with DMSO-treated GCT cells serving as the control. The result shows that RRX-001 treatment efficiently suppresses Cd47 expression in GCT cells. Data indicate means ± SD, ***p < 0.001, unpaired t test. B Representative morphologies of in vitro cultured GCT cells in DMSO and after RRX-001 treatment, showing that the proliferation of GCT cells was not affected by RRX-001 treatment. The boxed regions in the upper panels are magnified in the lower panels. Scale bar: 100 μm. C The statistical results of cell proliferation during 7 days culture, showing that the proliferation of GCT cells was not affected by RRX-001 treatment. Data represent mean ± SD. D Body weights of vehicle control and RRX-001-treated mice, showing comparable body weights of the RRX-001-treated and control groups. RRX-001 was administrated every two days for three consecutive weeks (n = 9). Data indicate means ± SD. E Representative images of tumors dissected from mice treated with vehicle and RRX-001, illustrating that the GCTs in the RRX-001-treated group were significantly smaller than those in the vehicle control group. F Statistical results of the size and weight of tumors from the vehicle control and RRX-001-treated groups, demonstrating that RRX-001 treatment severely inhibits GCT growth in vivo. G Immunohistochemical staining of CD68 (macrophage marker) in GCT sections from the vehicle control and RRX-001-treated groups, revealing a greater number of invasive CD68 + macrophages in the GCTs from the RRX-001-treated group than from the vehicle control group. Red arrowheads indicate CD68 + macrophages. Scale bar: 100 μm. H Cell density of CD68 + macrophages in indicated groups, confirming the conclusion stated in G. Data indicate means ± SD, **p  <  0.01, unpaired t test.

References

    1. Albertini DF, Barrett SL. Oocyte-somatic cell communication. Reprod Suppl. 2003;61:49–54. - PubMed
    1. Chen M, He C, Zhu K, Chen Z, Meng Z, Jiang X, et al. Resveratrol ameliorates polycystic ovary syndrome via transzonal projections within oocyte-granulosa cell communication. Theranostics. 2022;12:782–95. doi: 10.7150/thno.67167. - DOI - PMC - PubMed
    1. Jamieson S, Fuller PJ. Molecular pathogenesis of granulosa cell tumors of the ovary. Endocr Rev. 2012;33:109–44. doi: 10.1210/er.2011-0014. - DOI - PubMed
    1. Auranen A, Sundström J, Ijäs J, Grénman S. Prognostic factors of ovarian granulosa cell tumor: a study of 35 patients and review of the literature. Int J Gynecol Cancer. 2007;17:1011–8. doi: 10.1111/j.1525-1438.2007.00914.x. - DOI - PubMed
    1. Schumer ST, Cannistra SA. Granulosa cell tumor of the ovary. J Clin Oncol. 2003;21:1180–9. doi: 10.1200/JCO.2003.10.019. - DOI - PubMed

Publication types