. 2023 Feb 23;8(1):25.
doi: 10.1038/s41541-023-00623-z.

Intranasal multivalent adenoviral-vectored vaccine protects against replicating and dormant M.tb in conventional and humanized mice

Affiliations

Intranasal multivalent adenoviral-vectored vaccine protects against replicating and dormant M.tb in conventional and humanized mice

Sam Afkhami et al. NPJ Vaccines. .

Abstract

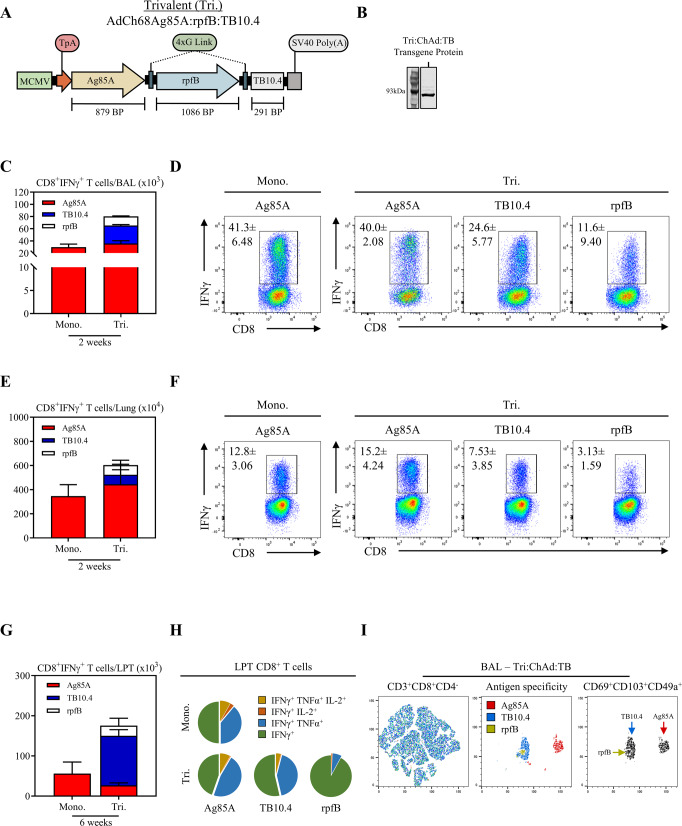
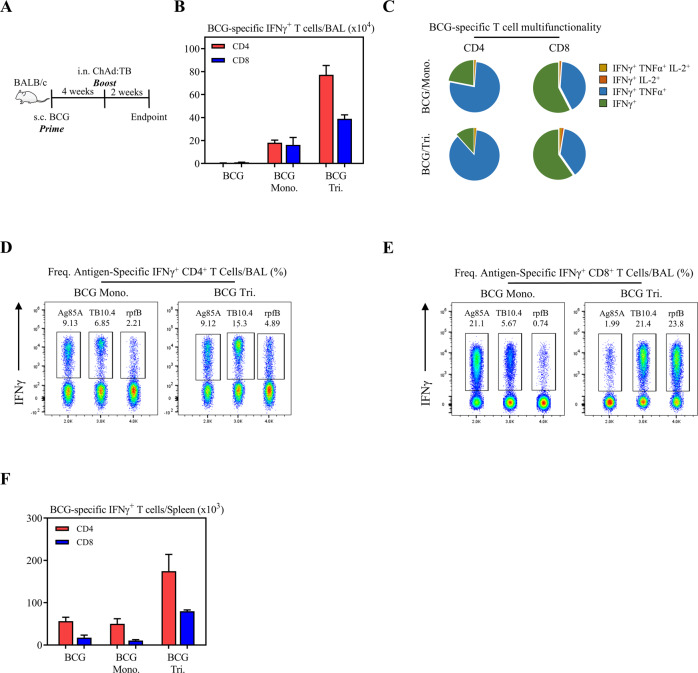
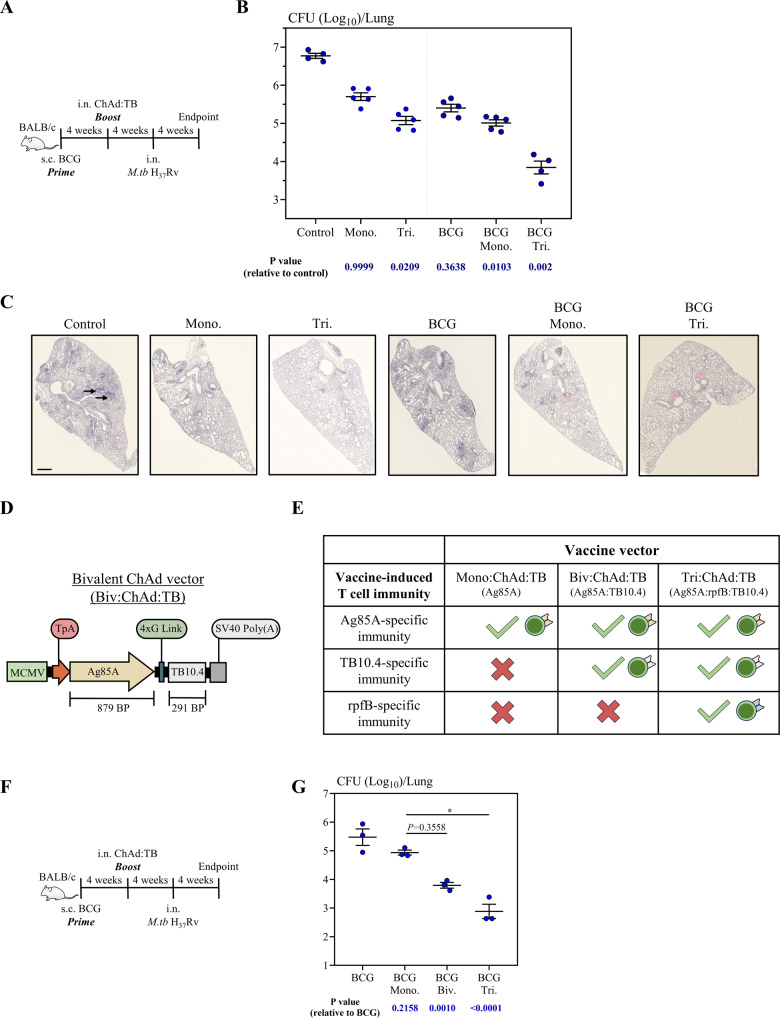
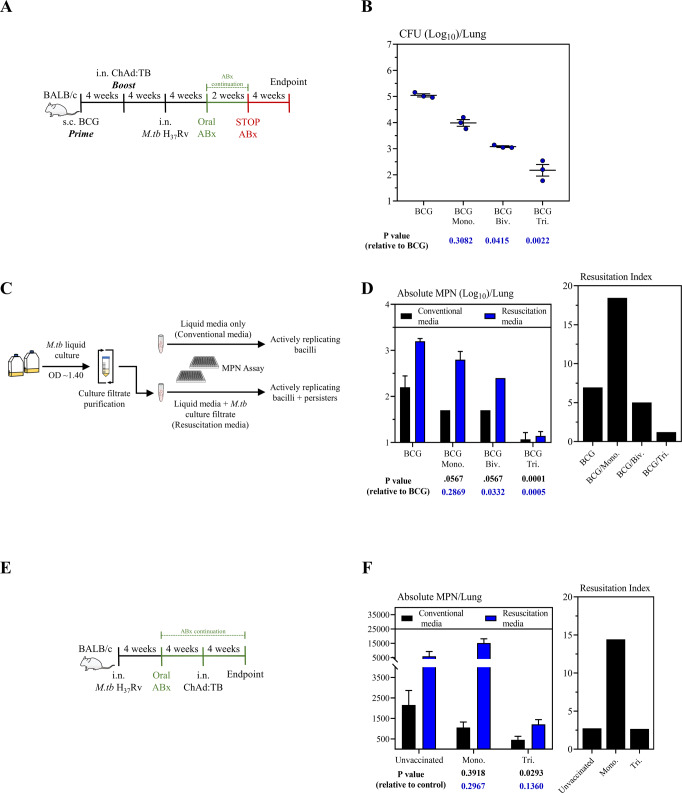
Viral-vectored vaccines are highly amenable for respiratory mucosal delivery as a means of inducing much-needed mucosal immunity at the point of pathogen entry. Unfortunately, current monovalent viral-vectored tuberculosis (TB) vaccine candidates have failed to demonstrate satisfactory clinical protective efficacy. As such, there is a need to develop next-generation viral-vectored TB vaccine strategies which incorporate both vaccine antigen design and delivery route. In this study, we have developed a trivalent chimpanzee adenoviral-vectored vaccine to provide protective immunity against pulmonary TB through targeting antigens linked to the three different growth phases (acute/chronic/dormancy) of Mycobacterium tuberculosis (M.tb) by expressing an acute replication-associated antigen, Ag85A, a chronically expressed virulence-associated antigen, TB10.4, and a dormancy/resuscitation-associated antigen, RpfB. Single-dose respiratory mucosal immunization with our trivalent vaccine induced robust, sustained tissue-resident multifunctional CD4+ and CD8+ T-cell responses within the lung tissues and airways, which were further quantitatively and qualitatively improved following boosting of subcutaneously BCG-primed hosts. Prophylactic and therapeutic immunization with this multivalent trivalent vaccine in conventional BALB/c mice provided significant protection against not only actively replicating M.tb bacilli but also dormant, non-replicating persisters. Importantly, when used as a booster, it also provided marked protection in the highly susceptible C3HeB/FeJ mice, and a single respiratory mucosal inoculation was capable of significant protection in a humanized mouse model. Our findings indicate the great potential of this next-generation TB vaccine strategy and support its further clinical development for both prophylactic and therapeutic applications.


Conflict of interest statement

The authors declare no competing interests.

Figures

Fig. 1
Fig. 1. Transgene design and immunogenicity of a multivalent ChAd:TB vaccine.
A Transgene cassette diagram for Tri:ChAd:TB. B Left: Transgene expression analysis by western blot using protein isolated from A549 cells infected with Tri:ChAd:TB. Fusion protein derived from transgene expression was probed with an anti-TB10.4 monoclonal antibody. C Stacked bar graphs depicting absolute numbers of CD8+IFNγ+ T-cell responses in the BAL 2 weeks post-intranasal (i.n.) vaccination with either Mono:ChAd:TB or Tri:ChAd:TB, as measured by expression of IFNγ following ex vivo stimulation with Ag85A (red), TB10.4 (blue), or RpfB (white) whole protein. D Representative flow cytometric plots of IFNγ+CD8+ T cells in the BAL 2 weeks post-i.n. immunization with either Mono:ChAd:TB or Tri:ChAd:TB, following ex vivo stimulation with Ag85A, TB10.4, or RpfB whole protein. Gating strategy provided in Supplemental Fig. 5. E Stacked bar graphs depicting absolute numbers of CD8+IFNγ+ T-cell responses in the lung 2 weeks post-i.n. immunization with either Mono:ChAd:TB or Tri:ChAd:TB, as measured by expression of IFNγ following ex vivo stimulation with Ag85A (red), TB10.4 (blue), or RpfB (white) whole protein. F Representative flow cytometric plots of IFNγ+CD8+ T cells in the lung 2 weeks post-i.n. immunization with either Mono:ChAd:TB or Tri:ChAd:TB, following ex vivo stimulation with Ag85A, TB10.4, or RpfB whole protein. G Stacked bar graphs depicting absolute numbers of CD8+IFNγ+ T-cell responses in the lung parenchymal tissue (LPT) 6 weeks post-i.n. immunization with either Mono:ChAd:TB or Tri:ChAd:TB, as measured by expression of IFNγ following ex vivo stimulation with Ag85A (red), TB10.4 (blue), or RpfB (white) whole protein. H Pie charts depicting the functionality (IFNγ, TNFα, and/or IL-2) of LPT CD8+ T cells 6 weeks post-i.n. immunization with either Mono:ChAd:TB or Tri:ChAd:TB, following ex vivo stimulation with Ag85A, TB10.4, or RpfB whole protein. I Left panel: t-SNE map generated from concatenating CD3+CD8+CD4 gated cells from lung mononuclear cells from animals i.n.-vaccinated with tri:ChAd:TB and stimulated with either Ag85A,TB10.4, or RpfB whole protein. Middle panel: Overlayed populations representing either Ag85A (red), TB10.4 (blue), or RpfB (green)-specific T cells. Right panel: Heatmap projection of CD69+CD103+CD49a+ populations. Data presented in (C–G) represent mean ± SEM of n = 3 mice/group. Data are representative of one independent experiment.
Fig. 2
Fig. 2. Immunogenicity of a multivalent ChAd:TB vaccine in BCG-primed animals.
A Experimental schema. B Bar graphs depicting absolute numbers of either CD4+ (red) or CD8+ (blue) T-cell responses in the BAL, as measured by expression of IFNγ following ex vivo stimulation with crude BCG/culture filtrate. C Pie charts depicting the functionality (IFNγ, TNFα, and/or IL-2) of CD8+ or CD4+ T cells in the BAL following ex vivo stimulation with crude BCG/culture filtrate. D Flow cytometric plots of IFNγ+CD4+ T cells in the BAL from concatenating CD3+ gated cells following ex vivo stimulation with Ag85A, TB10.4, or RpfB whole protein. E Flow cytometric plots of IFNγ+CD8+ T cells in the BAL from concatenating CD3+ gated cells following ex vivo stimulation with Ag85A, TB10.4, or RpfB whole protein. F Bar graphs depicting absolute numbers of either CD4+ (red) or CD8+ (blue) T-cell responses in the spleen, as measured by expression of IFNγ following ex vivo stimulation with crude BCG/culture filtrate. Data presented in (B, F) represent mean ± SEM of n = 3 mice/group. Data are representative of one independent experiment.
Fig. 3
Fig. 3. Protective efficacy of a multivalent ChAd:TB vaccine against M.tb (H37Rv) in the BALB/c model.
A Experimental schema, pertaining to panels B and C. B Lung mycobacterial burden (Log10 colony-forming unit (CFU)) 4 weeks post-M.tb (H37Rv) challenge via the respiratory mucosal route. C Representative lung H&E images 4 weeks post-M.tb challenge. Black arrows indicate granulomatous lesions. Scale bars represent 200 µm. D Transgene cassette diagram for Biv:ChAd:TB. E Conceptual chart depicting the relationship of antigen-specific (Ag85A, TB10.4, and/or RpfB) T-cell immunity to immunization with either Mono:ChAd:TB, Biv:ChAd:TB, or Tri:ChAd:TB. F Experimental schema, pertaining to panel G. G Lung mycobacterial burden (Log10 CFU) 4 weeks post-M.tb challenge via the respiratory mucosal route. Data presented in (B, G) represent mean ± SEM of n = 3–5 mice/group. Data are representative of one independent experiment. Data in (B, G) are from two separate independent experiments. Statistical analysis for (B, G) was performed using the nonparametric Kruskal–Wallis test with Dunn’s multiple comparison test. *P = 0.05.
Fig. 4
Fig. 4. Protective efficacy of a multivalent ChAd:TB vaccine against M.tb (H37Rv) persisters in the BALB/c model.
A Experimental schema, pertaining to panel B. B Lung mycobacterial burden (Log10 colony-forming unit (CFU)) 4 weeks post-ABx cessation. C Diagram depicting generation of M.tb culture filtrates for assessment of mycobacterial persisters in lung homogenates. D Left: Most probable number (MPN) estimates (Log10) to assess actively replicating bacilli (conventional media, black bars) and persisters (resuscitation media, blue bars). Right: Resuscitation Index, as calculated by a ratio of persisters-to-actively replicating bacilli. E Experimental schema, pertaining to panel F. F Left: Most Probable Number (MPN) estimates to assess actively replicating bacilli (conventional media, black bars) and persisters (resuscitation media, blue bars). Right: Resuscitation Index, as calculated by a ratio of persisters-to-actively replicating bacilli. Data presented in (B, D, F) represent mean ± SEM of n = 3 mice/group. Data are representative of one independent experiment. Statistical analysis for (B, D, F) was performed using a nonparametric Kruskal–Wallis with Dunn’s multiple comparison test.
Fig. 5
Fig. 5. Protective efficacy of a multivalent ChAd:TB vaccine against M.tb in the C3HeB/FeJ model.
A Experimental schema, pertaining to panel B. B Survival curve following aerosol challenge with M.tb (Erdman). C Experimental schema, pertaining to panels DG. D Lung mycobacterial burden (Log10 colony-forming unit (CFU)) 15 weeks post-M.tb challenge via aerosol. E Most Probable Number (MPN) estimates to assess actively replicating bacilli (conventional media, black bars) and persisters (resuscitation media, blue bars). F Top: Representative gross lung pathological images 15 weeks post-M.tb challenge. Bottom: Representative lung histopathological images of H&E staining 15 weeks post-M.tb challenge. Scale bars represent 200 µm. G Bar graph depicting total number of gross lesions on the left lungs. Data presented in (D, E, G) represent mean ± SEM of n = 4–5 mice/group. Data are representative of one independent experiment. Statistical analysis for (D, G) was performed using a nonparametric Kruskal–Wallis with Dunn’s multiple comparison test. *P = 0.05, ***P = 0.001.
Fig. 6
Fig. 6. Protective efficacy of a multivalent ChAd:TB vaccine against M.tb (H37Rv) in the humanized mouse (Hu-mouse) model.
A Experimental schema. B Body weight change curve following respiratory mucosal challenge with M.tb (H37Rv). C Lung mycobacterial burden (Log10 colony-forming unit (CFU)) 4 weeks post-M.tb challenge. D Representative lung histopathological images of acid-fast Bacilli (AFB) staining 4 weeks post-M.tb challenge. Scale bars represent 100 µm. E Top: Representative gross lung pathological images Scale bars represent 200 µm. Bottom: Representative lung histopathological images of H&E staining. Scale bars represent 100 µm. F Scatter plots depicting percentage areas of granulomatous lesions in the lungs. Data presented in (B, C, F) represent mean ± SEM of n = 3–4 mice/group. Data are representative of one independent experiment. Statistical analysis for (C) was performed using a nonparametric Mann–Whitney T tests.

References

    1. WHO. W.H.O. Global Tuberculosis Report 2021 (WHO, 2021).
    1. Pai M, Kasaeva T, Swaminathan S. Covid-19’s devastating effect on tuberculosis care—a path to recovery. N. Engl. J. Med. 2022;386:1490–1493. doi: 10.1056/NEJMp2118145. - DOI - PubMed
    1. Lange C, et al. 100 years of Mycobacterium bovis bacille Calmette-Guérin. Lancet Infect. Dis. 2022;22:e2–e12. doi: 10.1016/S1473-3099(21)00403-5. - DOI - PMC - PubMed
    1. Jeyanathan M, Yao Y, Afkhami S, Smaill F, Xing Z. New tuberculosis vaccine strategies: taking aim at un-natural immunity. Trends Immunol. 2018;39:419–433. doi: 10.1016/j.it.2018.01.006. - DOI - PubMed
    1. Kaufmann SHE, et al. TBVAC2020: advancing tuberculosis vaccines from discovery to clinical development. Front. Immunol. 2017;8:1203. doi: 10.3389/fimmu.2017.01203. - DOI - PMC - PubMed